

 The threats that sea level rise poses to coastal development from direct inundation are better understood than the threats due to rising groundwater levels. Rising sea level will raise the level of groundwater in coastal aquifers, resulting in damage to buried infrastructure and increased potential for flooding from groundwater inundation.
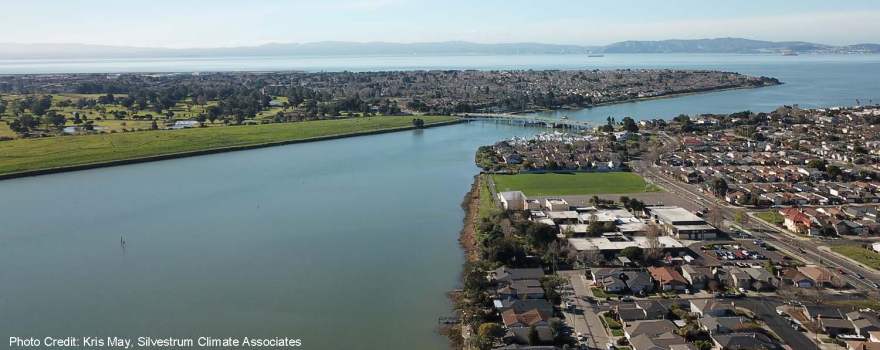
Researchers at UC Berkeley and Silvestrum Climate Associates have performed a preliminary investigation of the potential regional impacts of sea level rise on coastal aquifers of the San Francisco Bay Area. Some of California’s densest and most economically valuable development is built around the Bay on unconsolidated sediment, with an already high water table that will be lifted higher as sea level rises.
At the 2018 Bay Delta Science Conference, Ellen Plane from UC Berkeley and Abby Mohan with Silvestrum Climate Associates discussed their research.
ELLEN PLANE: Effects of sea level rise on shallow groundwater in the San Francisco Bay Area
Ellen Plane is a student at the College of Environmental Design at UC Berkeley. Her presentation draws upon work done with her co-authors Dr. Kristina Hill from the College of Environmental Design and Dr. Kris May from Silvestrum Climate Associates on sea level rise and shallow groundwater in the San Francisco Bay Area.
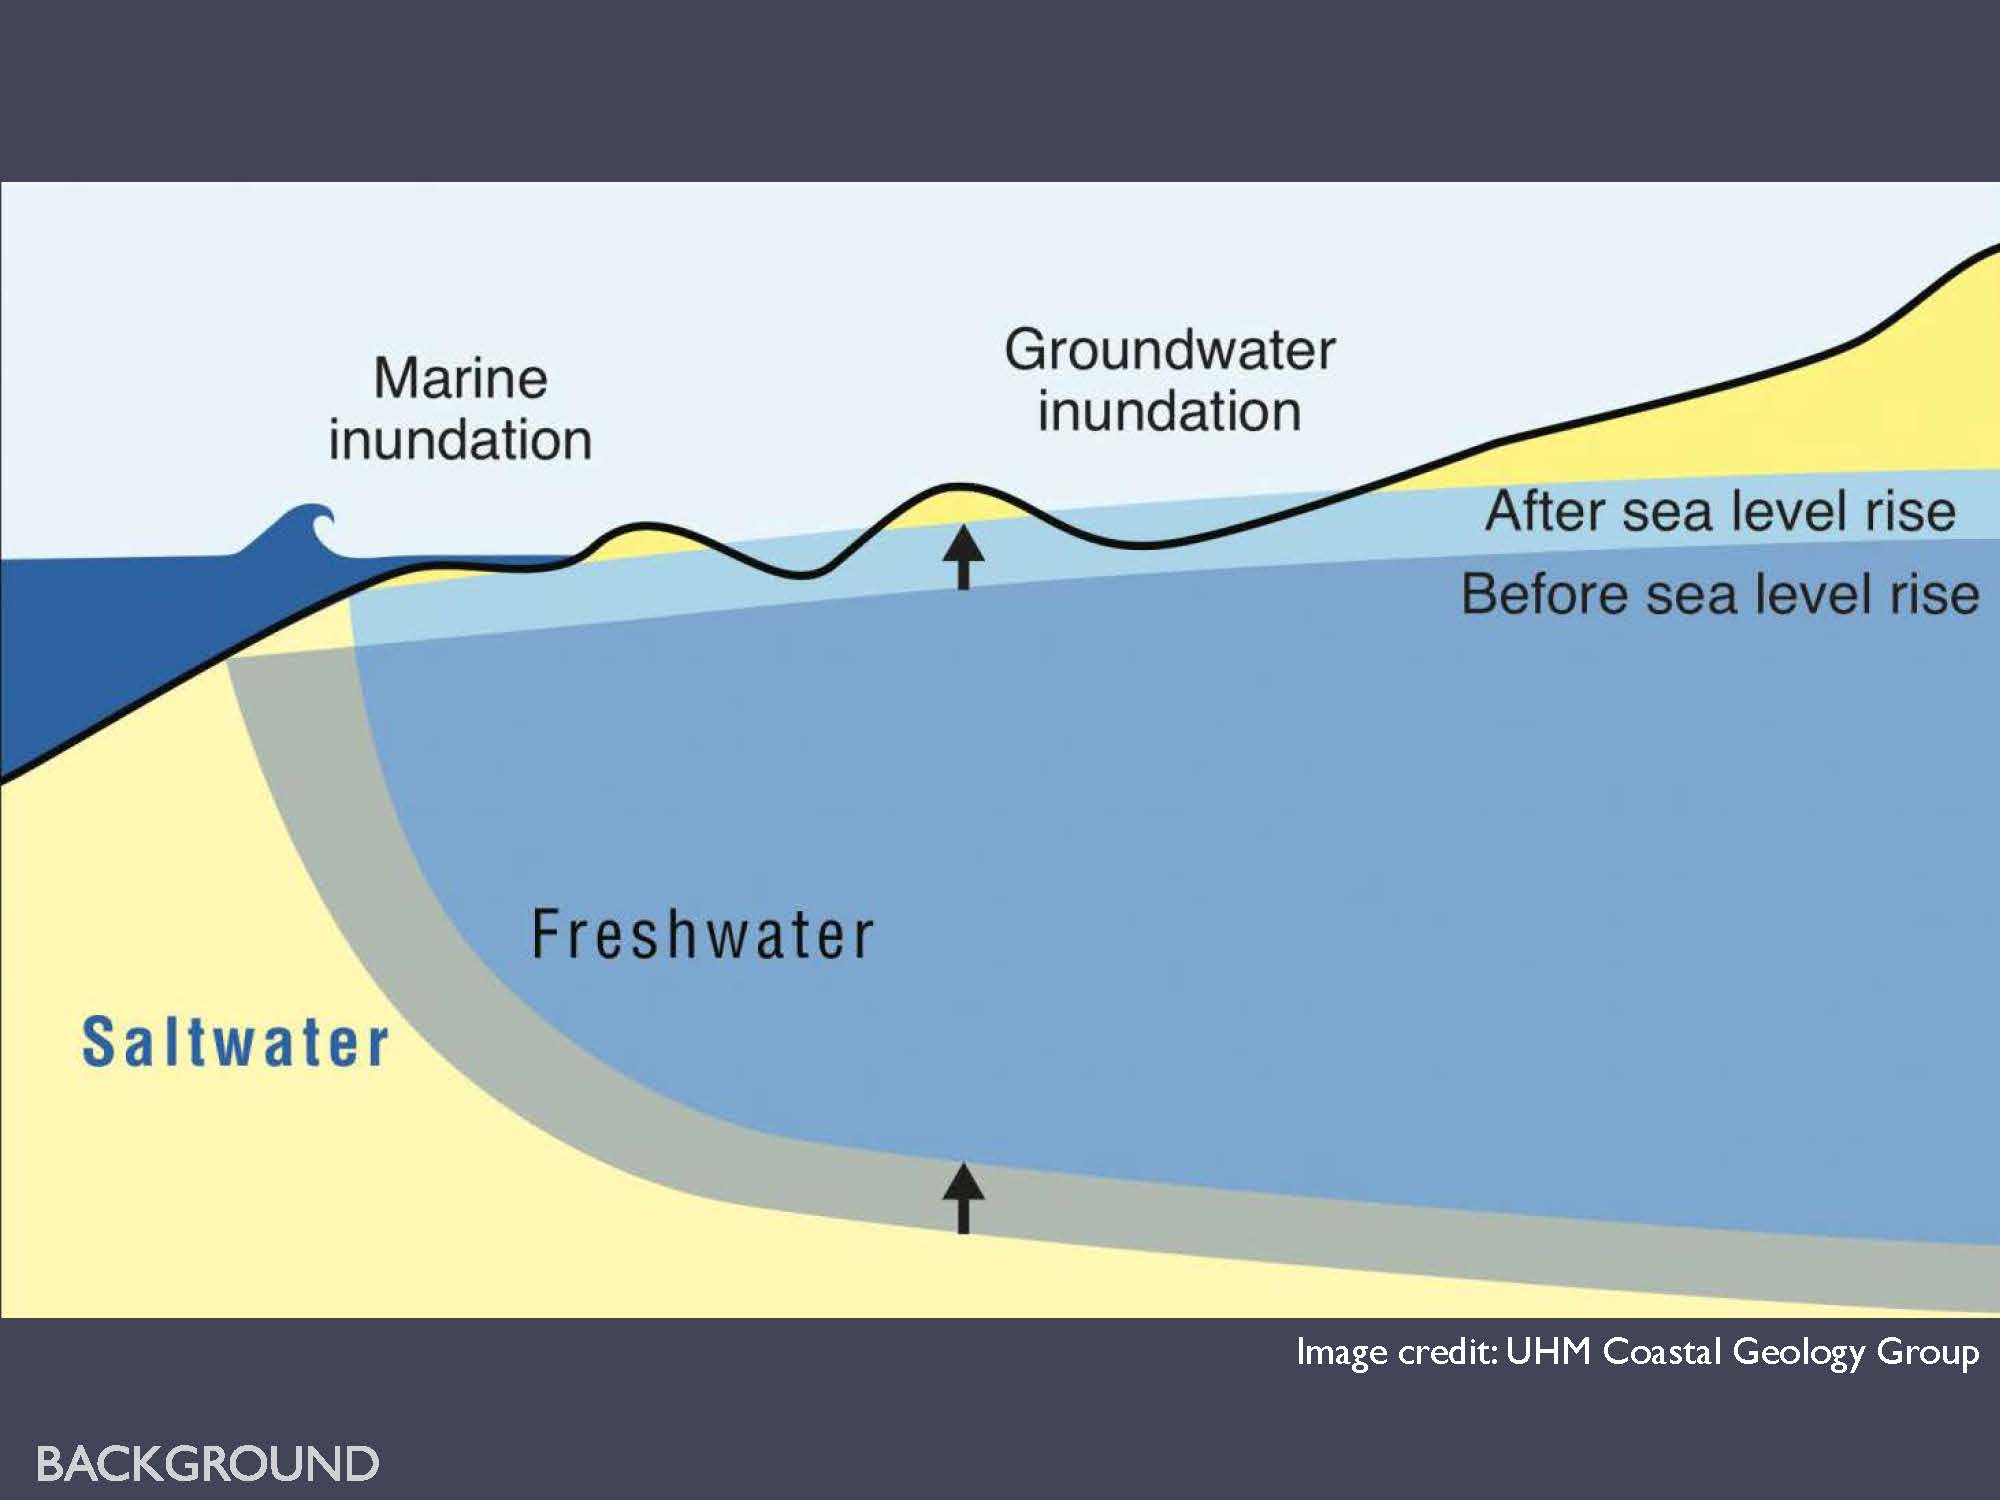 Ms. Plane began by presenting a figure adapted from a paper from the University of Hawaii at Manoa, Coastal Geology Group headed by Chip Fletcher, who have done a lot of research in the area of sea level rise impacts on shallow coastal aquifers.
She presented a figure which shows how inundation can occur in low-lying areas not directly connected to the shoreline. “In areas where you have a shallow unconfined coastal aquifer, as sea level rises and intrudes farther inland, the interface between the salt water and fresh water will rise and push the fresh water lens upward, potentially causing emergence and inundation in areas that you wouldn’t expect from salt water inundation alone, because they are not directly connected,” she explained.
She next presented an image (bottom, left) from a 2012 Rotzell & Fletcher paper from 2012; the top figure is how much flooding is expected from direct inundation; the bottom figure shows the extent of flooding that could be expected in Honolulu when the additional factor of groundwater rise is accounted for.


Another important study is the Hoover et al paper (above, right) from 2016 where they applied a similar method at case study sites around California, including Stinson Beach; they explored using existing groundwater data to look at contours and then look at how much sea level rise would impact not only direct inundation, but inundation due to a rising groundwater table. So based those papers, they decided to look into how shallow groundwater would be affected in San Francisco Bay area.
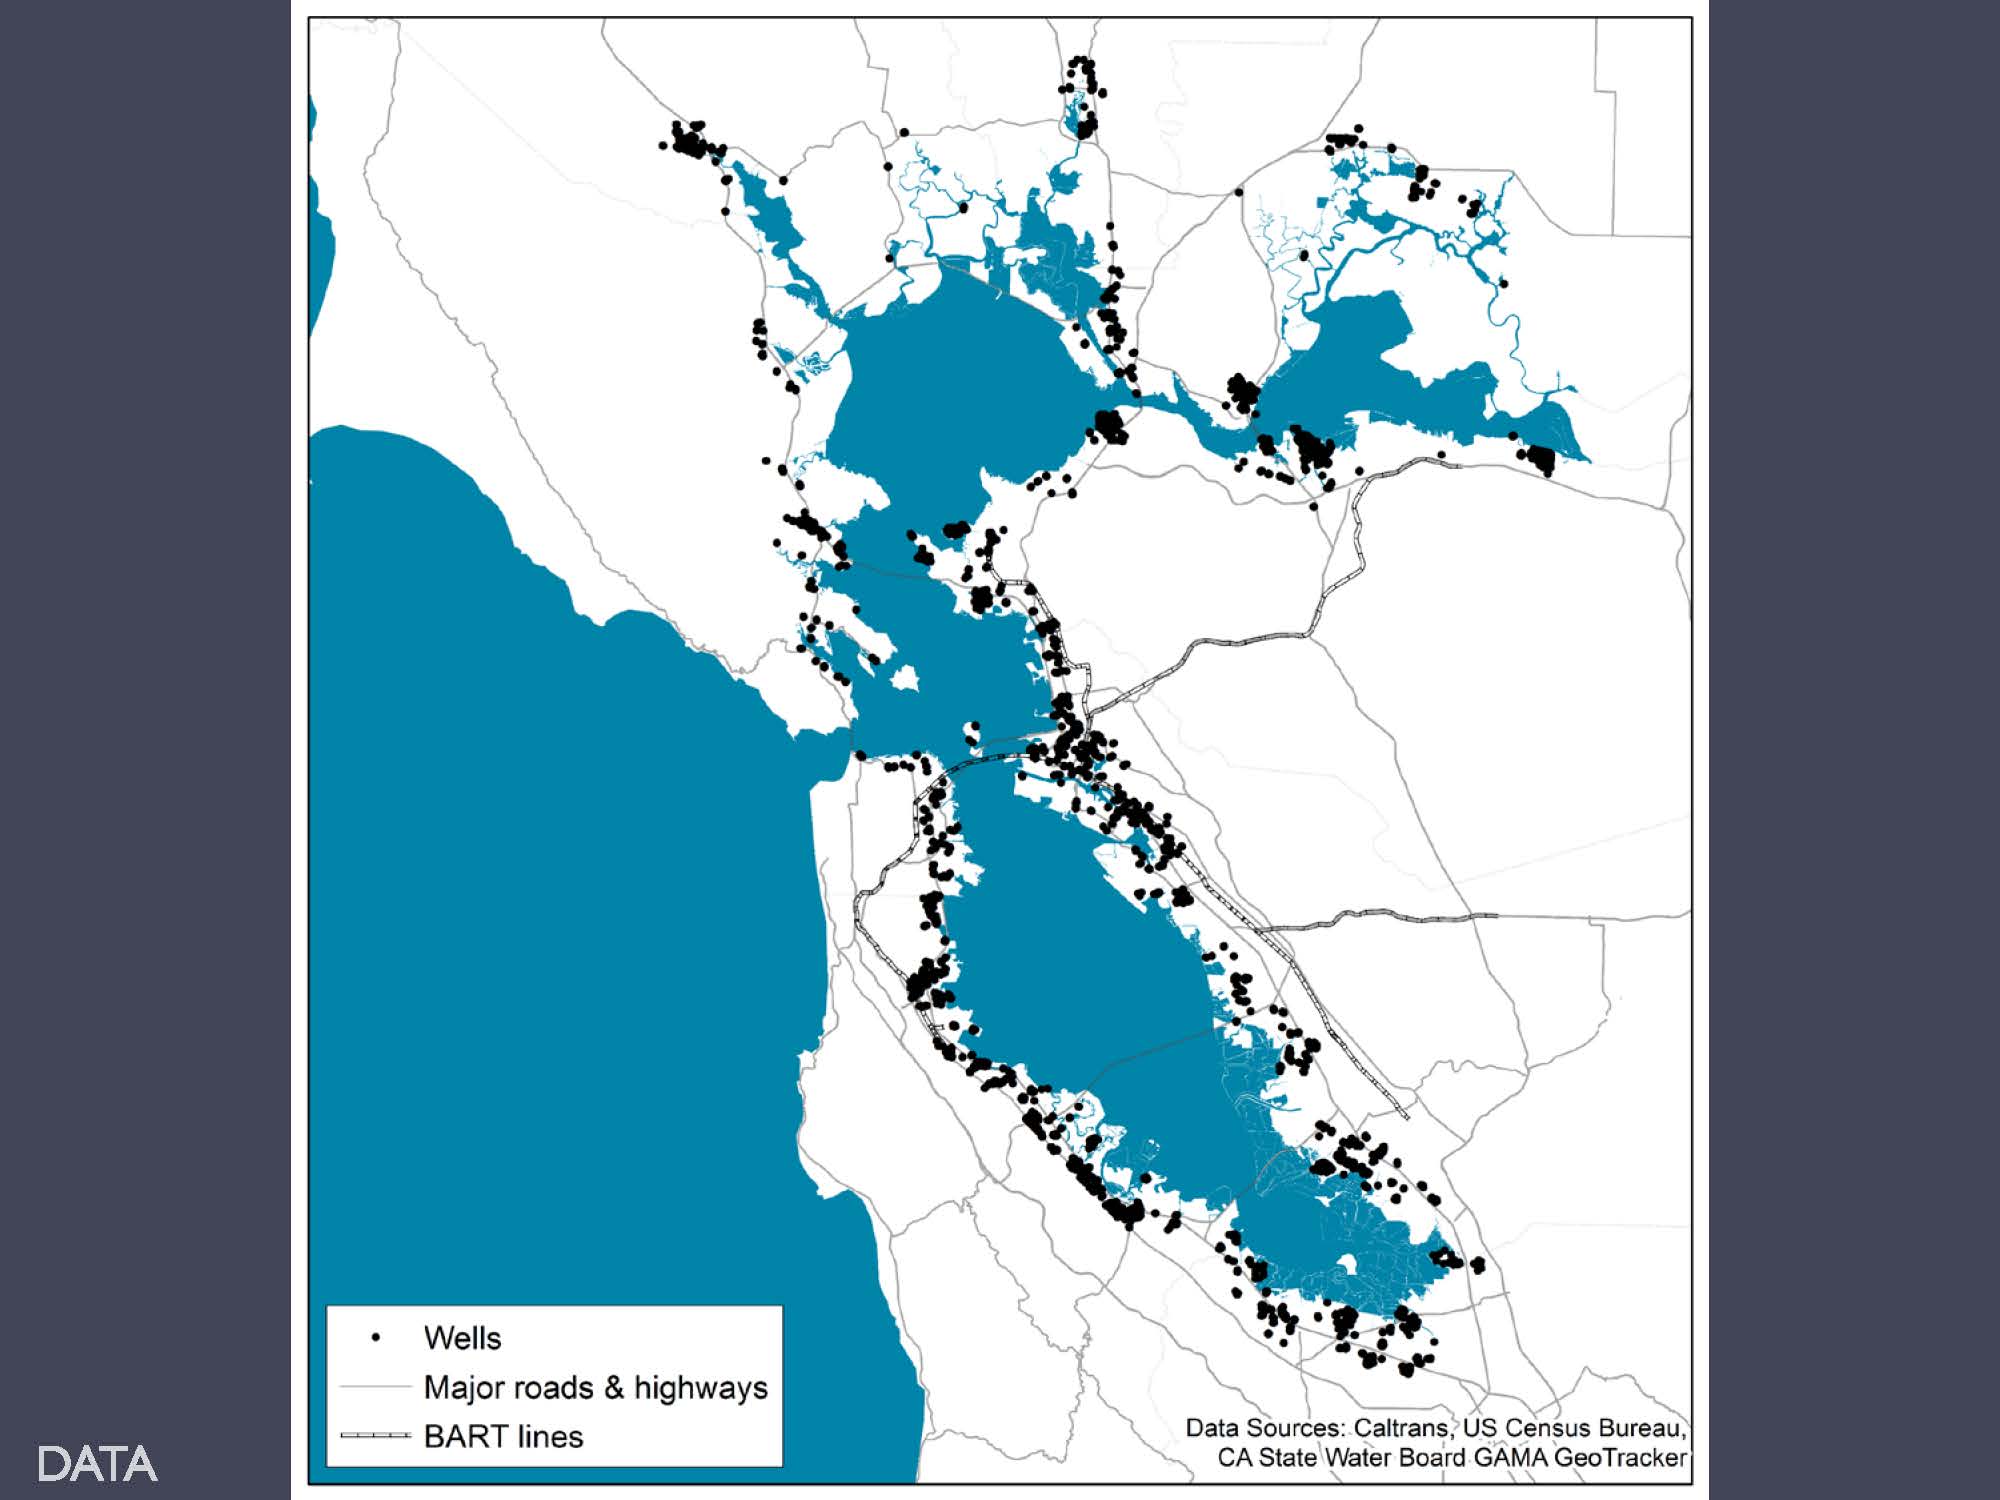 They used a dataset from the State Water Board’s GAMA Geotracker website where there is publicly available information from their monitoring of groundwater wells around the state.
“This is empirical data which is skewed toward areas with a lot of contamination because that’s what these monitoring wells are there for,” she said, noting that there were a lot more data points to work with in the Central Bay and South Bay in the North Bay.
They used the data to determine the minimum depth to water value and the highest water table level between the years 1996 to 2016 and then used that data together with digital elevation model from the USGS to put together a basic interpolation model that looks at where the groundwater table is in wet years. The first pass of the data was made available on the UC Berkeley data sharing site in 2017 and was used in a paper by Hummel et al published earlier this year that considered the vulnerability of wastewater treatment plants around the Bay Area.
 Since that time, improvements have been made to the model. Dr. Kris May and Abby Mohan at Silvestrum Climate Associates had good suggestions on how to improve the model and remove some of the artifacts that they were seeing.
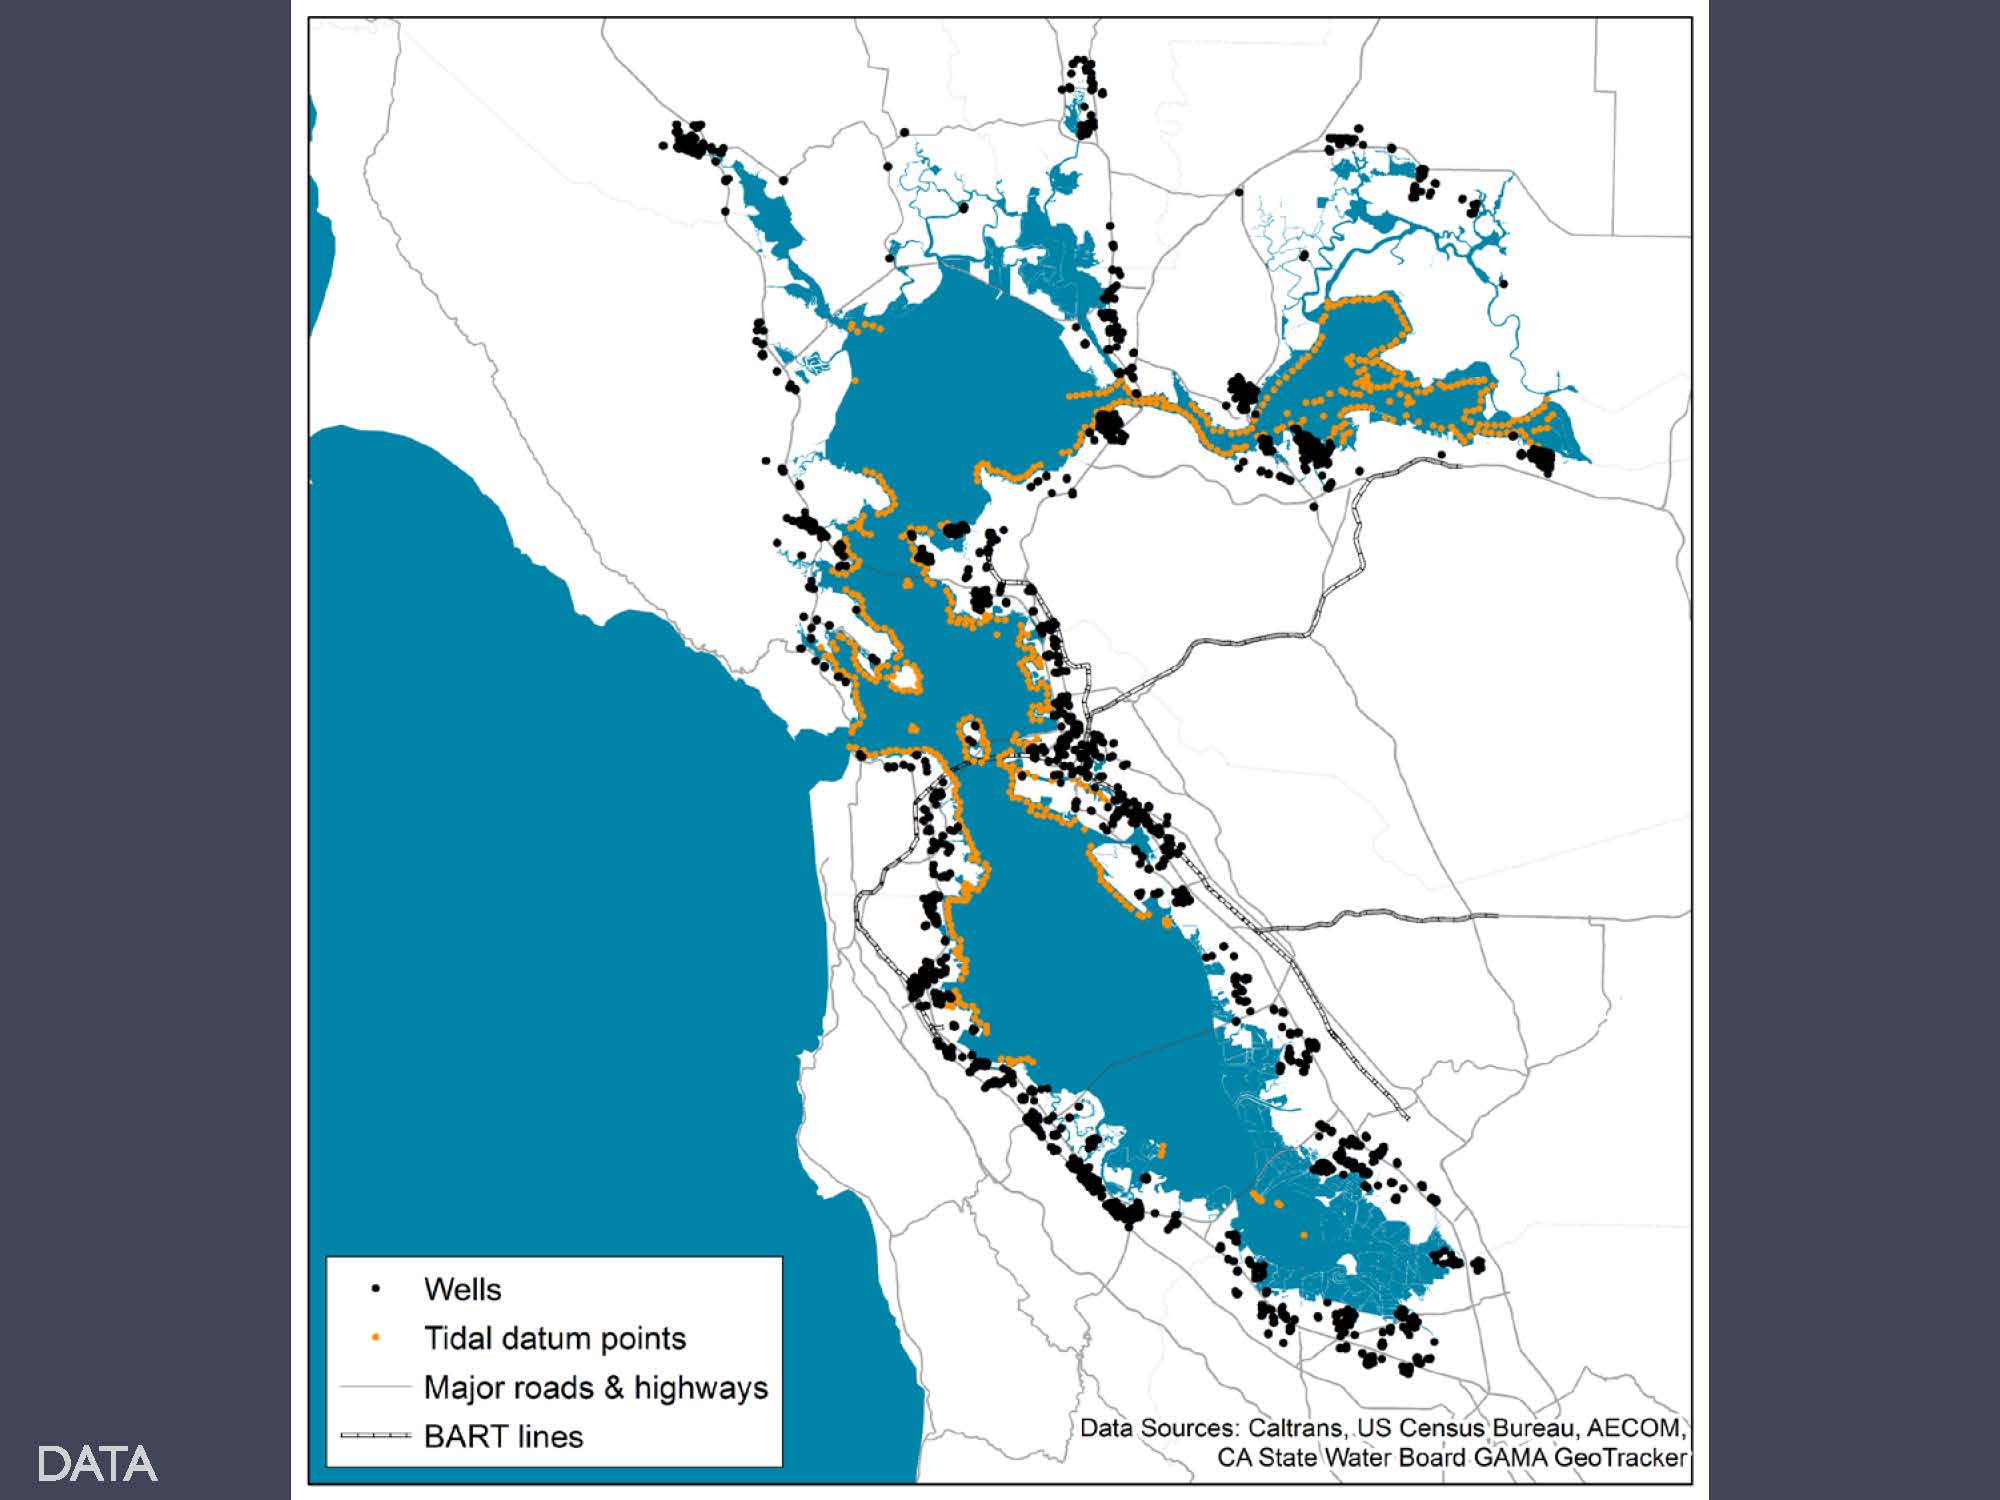
“We added in the tidal datum points into the interpolation, using the Mean Tide Line of +0.3 meters to reflect the expectation that groundwater surface will lie slightly above the mean tide line, and that allowed our model to be a little more realistic as it slopes down toward the Bay edge,” said Ms. Plane. “We also tweaked some of the parameters of the interpolation to remove some of the other artifacts that we were seeing.”
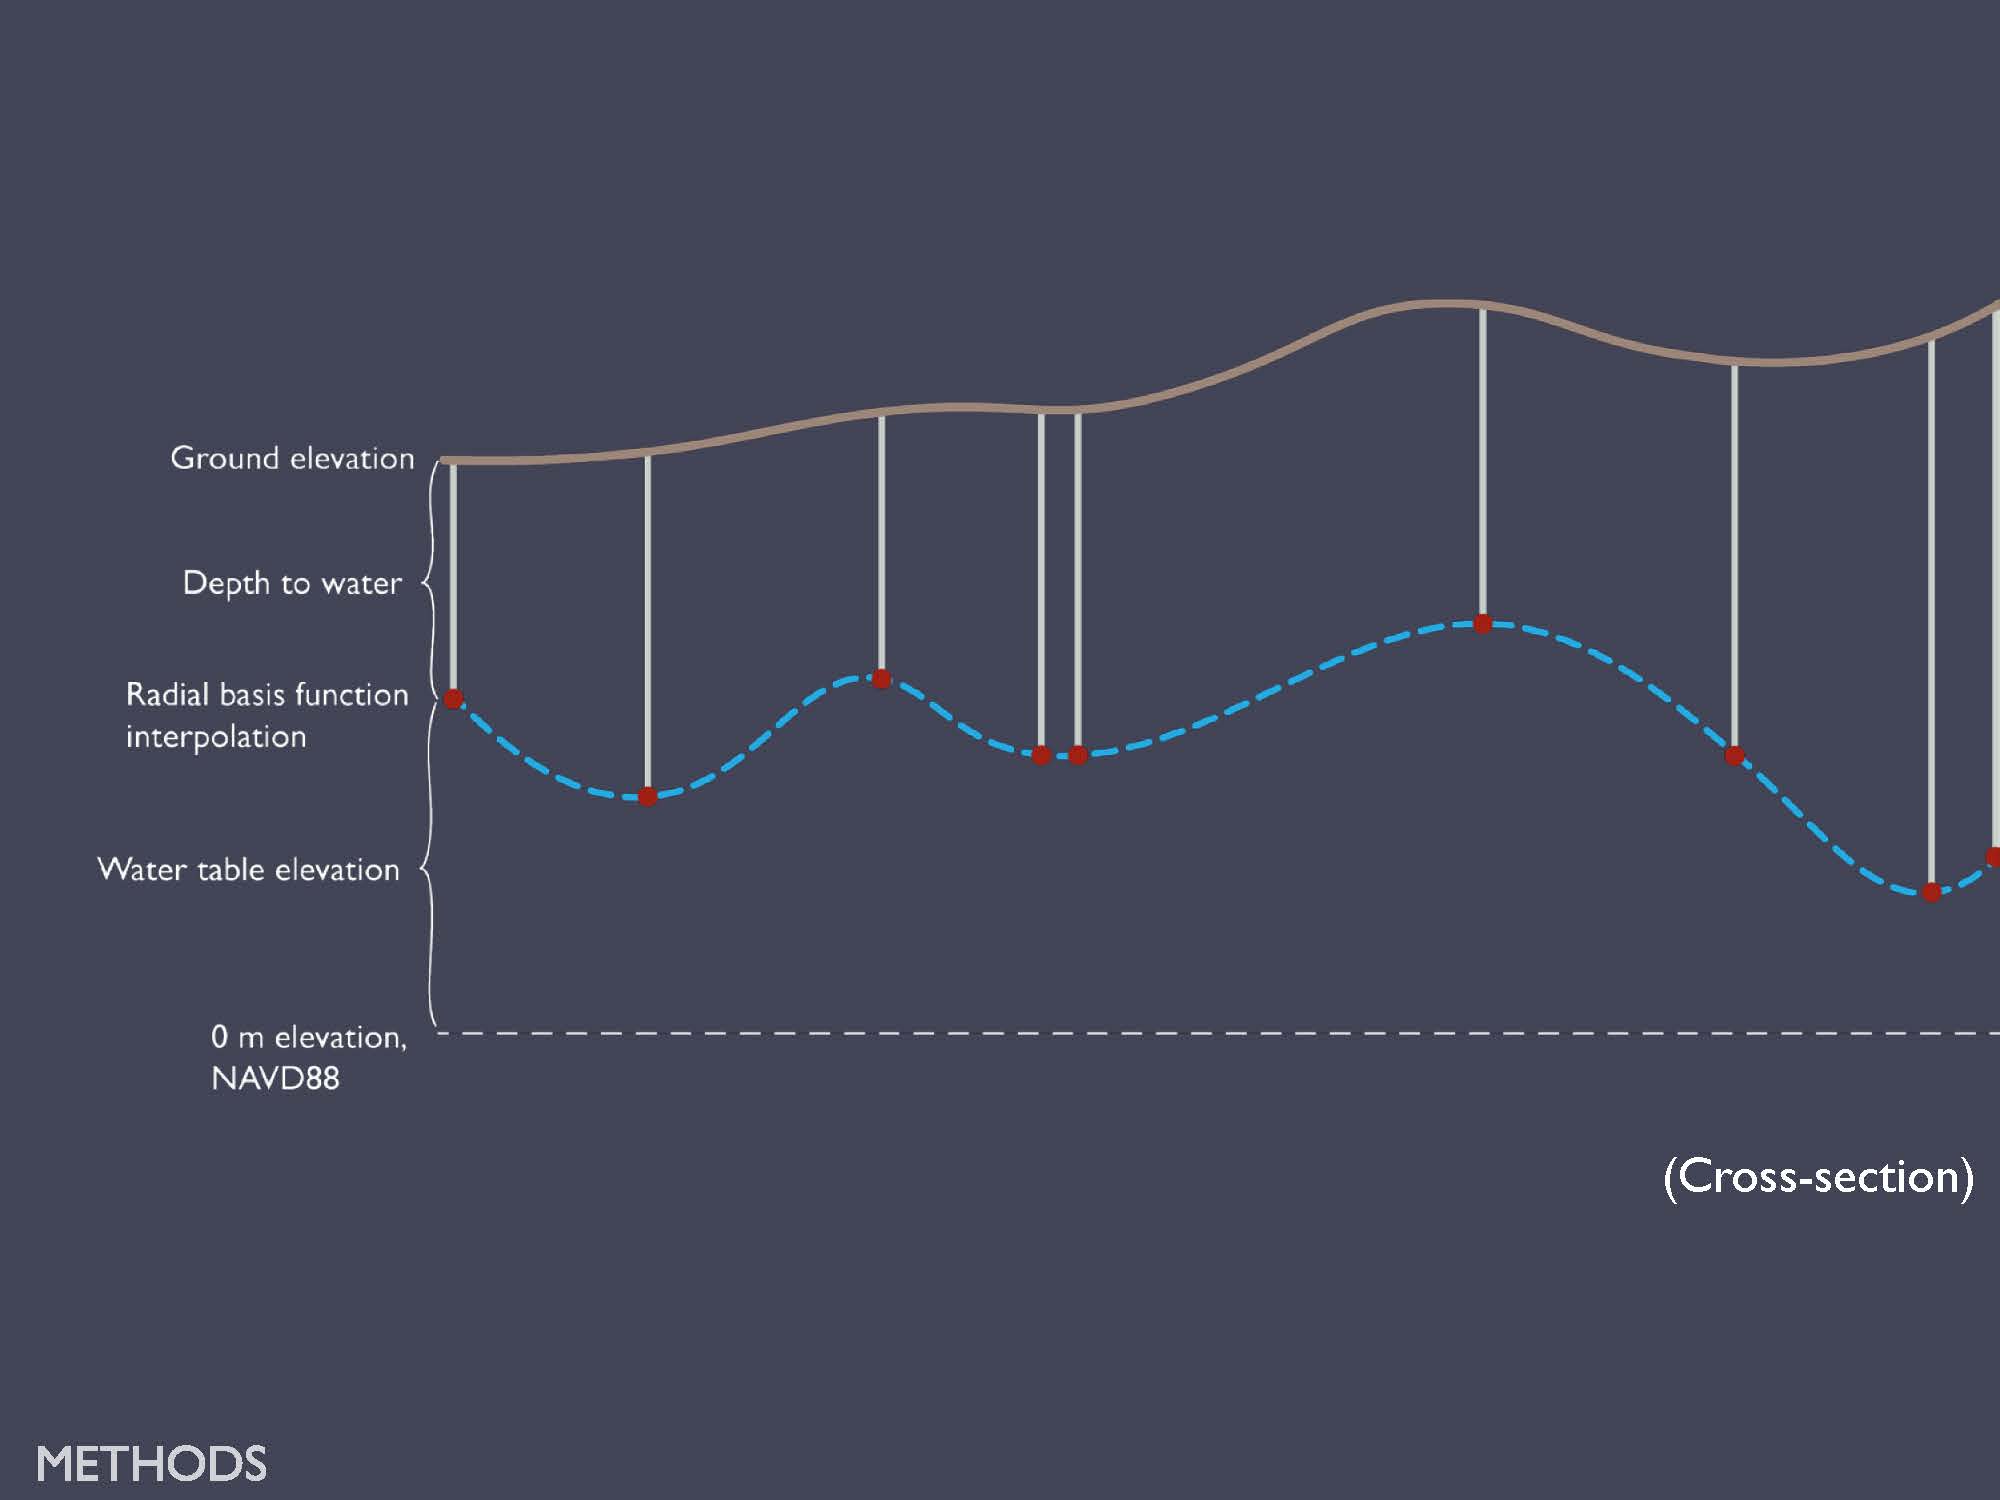 Using the ground elevation from the 2 meter Digital Elevation Model, they subtracted the depth to water values from the wells at that ground elevation to determine a water table elevation, and then interpolated on that a water table elevation using a radial basis function, after testing a variety of different functions to find the best fit by minimizing root mean square. The slide is showing a cross-section. Once the water table surface elevation was determined, it was then subtracted that from the ground elevation to generate depth to water maps.
 Ms. Plane then presented the results for the San Francisco Bay Area region, noting that the red is 0 to 1 meter depth to water, orange 1 to 2 meters, and yellow 2 to 3 meter depth to water.
The black areas represent emergent groundwater under current conditions, for which there could be several reasons, she explained. One possible reason is the minimum depth to water is sort of a worst case scenario for planning purposes, and those might be areas that already are saturated in really wet times. Another possibility is that the model is a static empirical interpolation model, rather than accounting for groundwater flow; there could be surface discharge that is not accounted for in this model. Another possibility is error from the interpolation method, or perhaps that pumping has started to happen since the last data collection at that well that’s nearby, so actually the groundwater surface is lower in reality than what is being mapped here.
Ms. Plane then showed a series of slides which took a closer look at specific areas of the Bay Area, acknowledging that the model is not perfect, but the objective is to get this information out to the planners so they can start to think about how sea level rise might affect local shallow groundwater conditions.
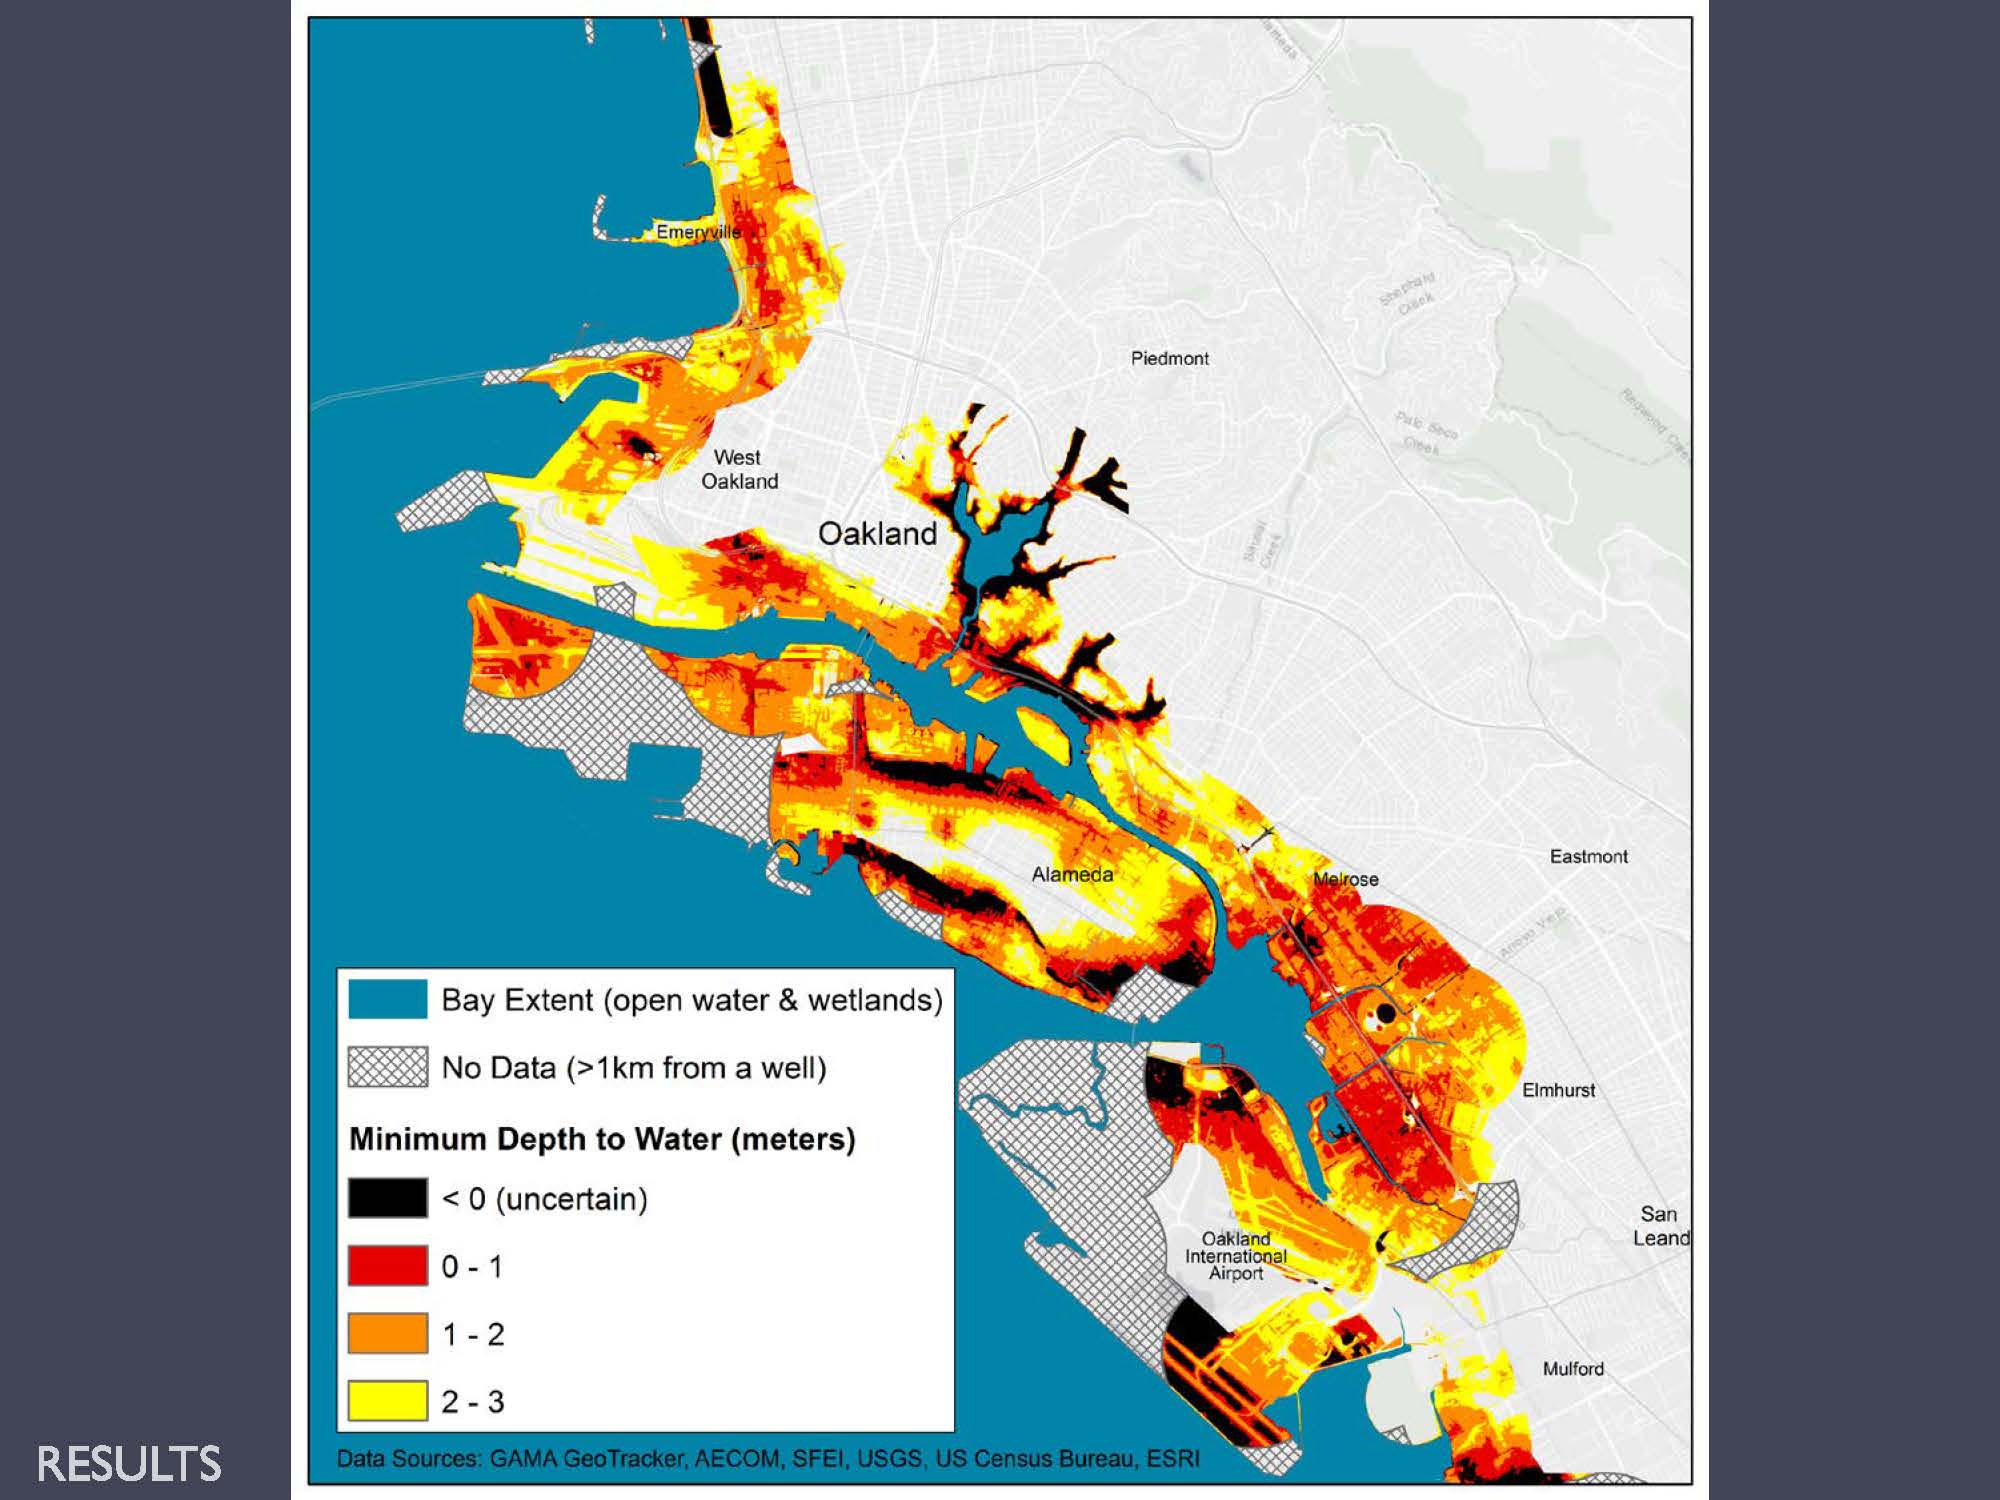 The first slide was for the Oakland and East Oakland area, which has some areas that are quite low-lying. Some of the areas are already exposed to direct inundation from sea level rise, including the Oakland Airport and the Lake Merritt area, she noted. She also pointed out that the maps identify areas where groundwater inundation had not previously been identified as an area of concern.
“In the East Oakland area, there’s a really vulnerable neighborhood if we consider groundwater inundation,” she said. “It’s not directly connected to the bay, but when we think about groundwater coming up, there could be ponding in that area that’s happening from groundwater emergence alone. So this is how we are starting to think about identifying some additional areas that should be targeted for adaptation planning efforts.”
Next, she presented a map of the Alviso area in the South Bay (lower, left). This area has already experienced some flooding with water at times coming up behind their levees, so there is pumping occurring. “On this map, there are several areas shown in white that you might expect to have higher groundwater than we’re actually seeing because there are landfill areas that are being actively pumped under current conditions,” she said.


Ms. Plane presented a map of the East Palo Alto – Mountainview area (above, right), noting that there are already adaptation efforts underway, including the San Francisquito Creek project, but even so, there are a lot of areas of concern. “Looking at the East Palo Alto area, one might start talking about what would happen if we put a horizontal levee here, and the thing to really consider when we think about rising groundwater is that we’re going to have water rising up from behind that levee also. So even if its preventing direct inundation, we might be seeing ponding from groundwater coming upward. It might become a cost-prohibitive and ineffective project if we don’t account for this additional threat.”
She added that this is an area with a lot of high value development, such as the Google campus, and right now it’s at a 1 to 3 depth to water level, but as sea level rises and pushes that upward, it might raise more concern from some of these companies.
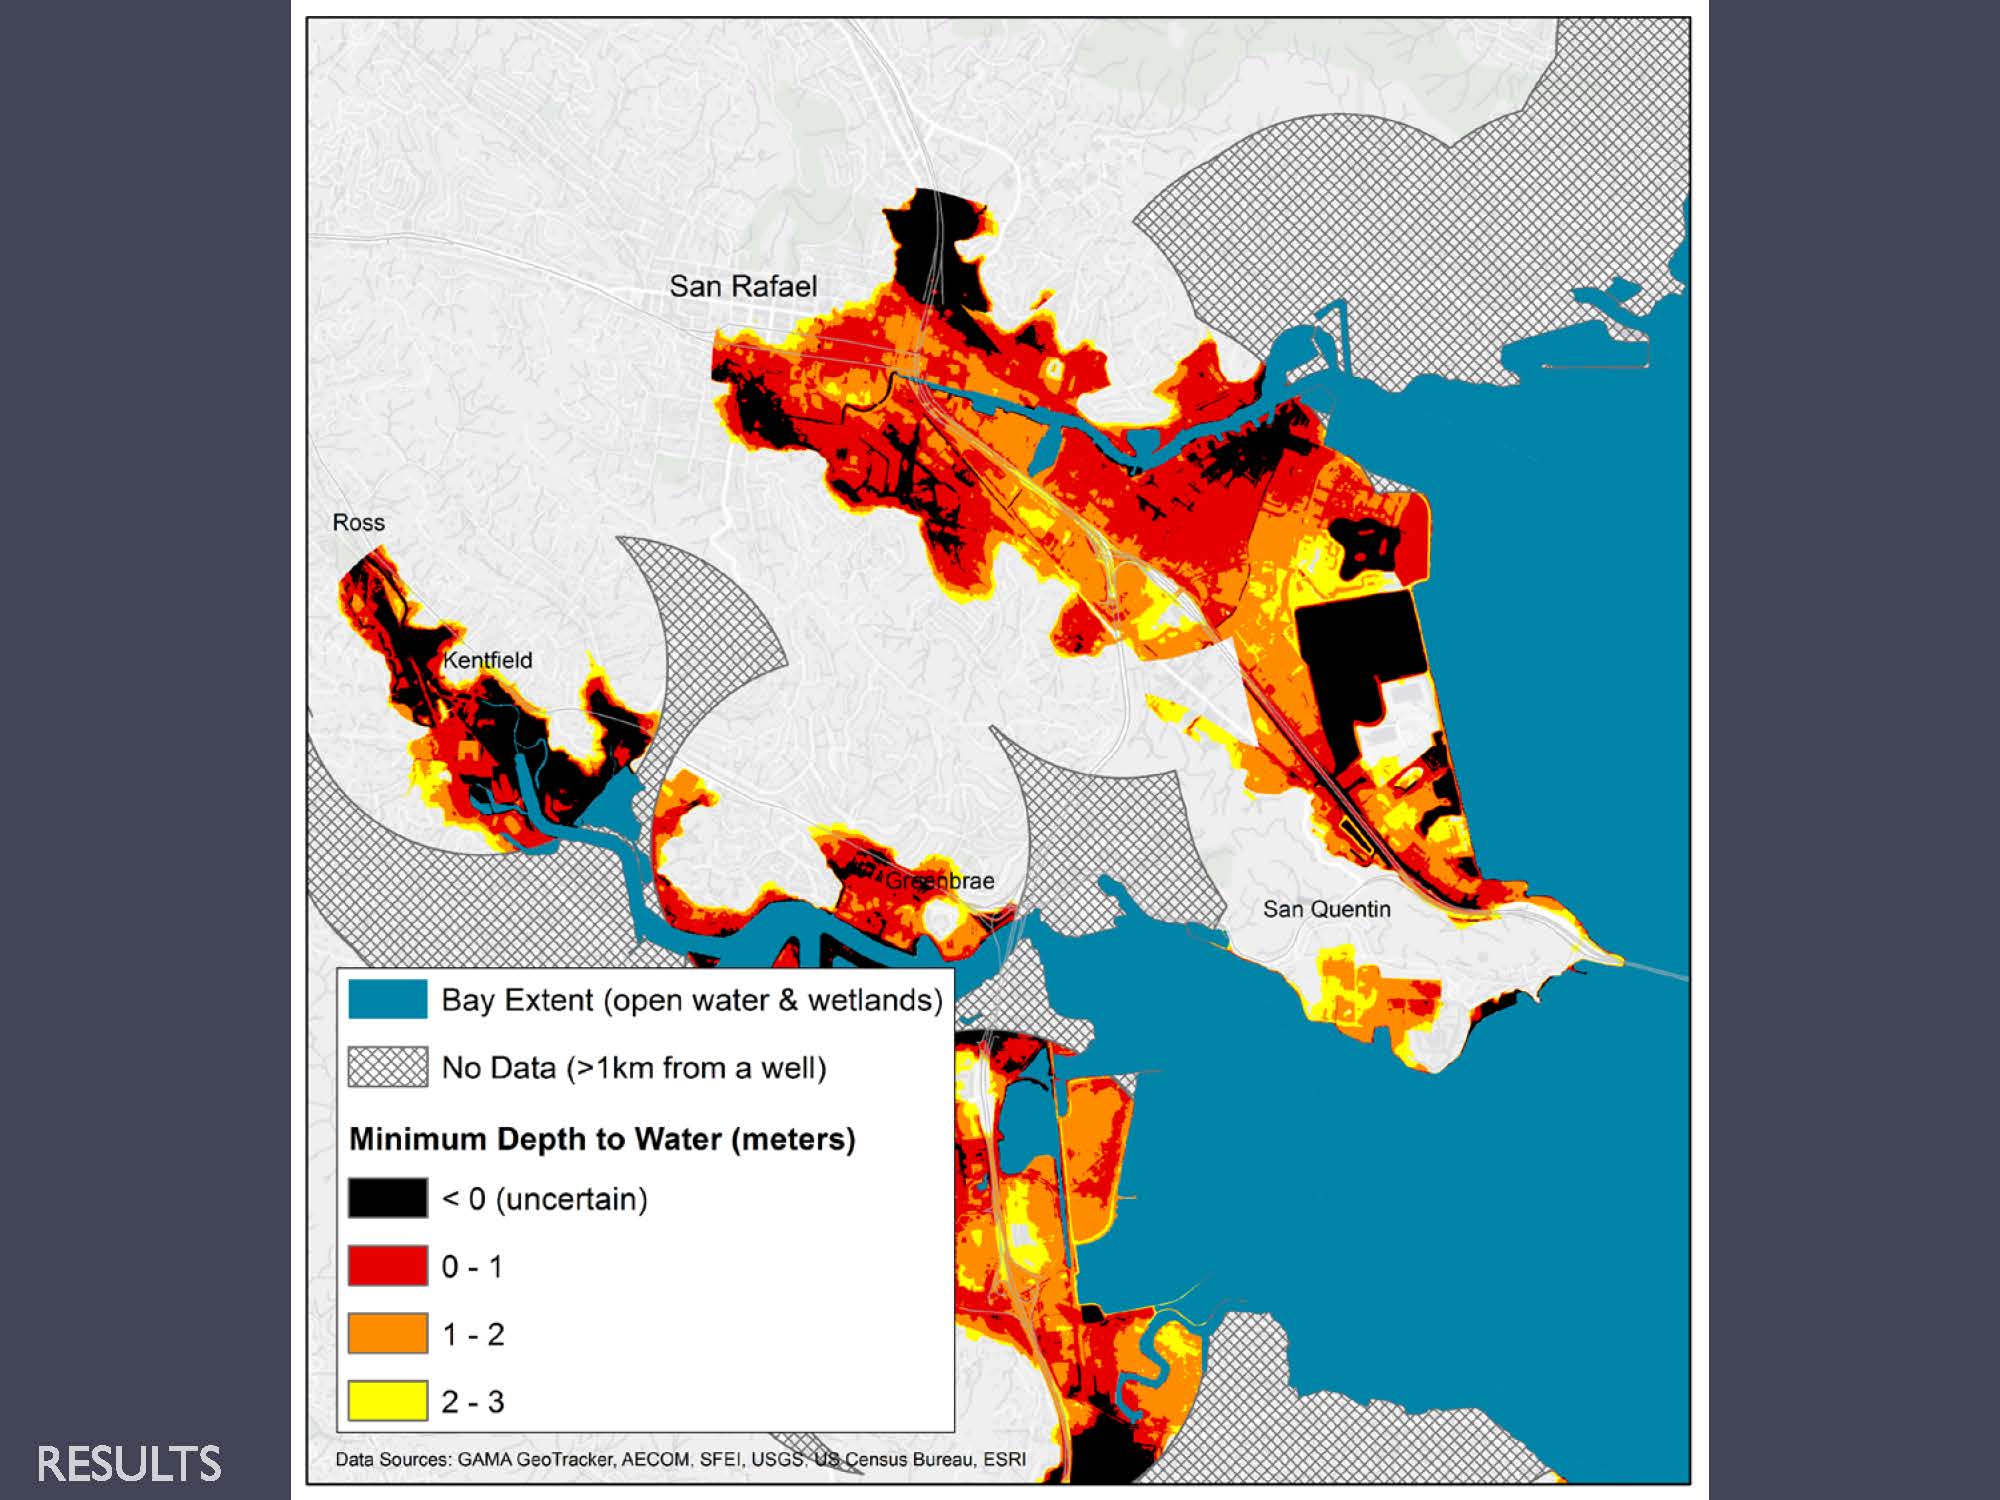 Next was a map of Marin County and the San Rafael area. “There’s a lot of development that’s built on artificial unconsolidated fill around the Bay Area, and this is one of those places where we have very high groundwater, we have direct inundation threats from sea level rise,” she said. “It’s all built on fill, which means that there’s a pretty high liquefaction risk in this area during a seismic event. And so another area for further research is thinking about how having more saturated ground is going to change liquefaction risk, particularly in areas like this where the geology is a little looser.”
Ms. Plane said that next, they used the same method that Rotzell & Fletcher and the Hoover et al paper used, which simply assumed that within a certain distance of the coast, a sea level rise of 1 meter will result in a corresponding rise of 1 meter in the groundwater table. In reality, it will drop off the farther the distance from the coast, but this is just a first pass effort at identifying what some of these issues might be, she said.
She presented the results (lower, left), noting that the areas shown in light blue depict areas newly inundated by emergent groundwater. She also noted that there are areas now showing up in orange and red that didn’t show up at all before. “The threat to underground infrastructure such as flooding of basements or wastewater treatment infrastructure is also important, so it’s not just when the groundwater becomes emergent that it becomes an issue,” she said.


Ms. Plane then presented a map of the San Mateo and Foster City area with the updated results. “We’re looking at emergent groundwater in this area, and there’s a huge housing crisis around the Bay Area, especially in Silicon Valley, so when thinking about new development and where that goes in and who is threatened by it, we’ll have to start thinking about this groundwater element as well.”
In conclusion …
Ms. Plane then wrapped summarized her presentation. First of all, the combination of direct inundation with groundwater emergence on coastal development will mean increased flooding; secondly, there’s a lot of contamination in the soil around the Bay Area, and as sea level rises and the groundwater rises, those contaminants are going to start to become mobilized and cause some public health threats around the Bay, she said.
“The rising water table will start threatening the infrastructure and cause inflow and infiltration into wastewater pipes that can cause backups and cause the infrastructure to become more ineffective, so we need to be thinking about how we can start to redesign our systems to be more waterproof or more resilient, not only to sea level rise, but to rising groundwater,” she said. “With the rising water table and the increased saturation, the increased liquefaction risk needs to be taken into account. And we need to be thinking about how we change our consideration of adaptation planning strategies to account for what’s happening potentially behind a levee or a sea wall, in addition to in front of it.”
“In conclusion, the maps that you saw today are presenting a minimum depth to groundwater condition, so this is sort of worst case scenario based on interpolation of empirical data,” she said. “This is a static model; all we’ve done is averaged between all those data points that we know we have just to see what the water table looks like. There is error associated with this interpolation, but it starts to give us an impression of shallow the groundwater is and how much of an issue it might become.”
There are a lot of other factors that should be considered in this modeling process, such as seasonality and how the conditions change throughout the year, she said. Tides will influence how the change in sea levels will propagate throughout the coastal aquifer and how much it will be contained. The simple interpolation model doesn’t account for the geologic differences which affects how groundwater moves throughout this system. Precipitation, recharge, discharge, and how the water is actually moving will be affected. The tidal influence, the geology and groundwater flow will be included in a project that USGS is working on to model for the entire coast of California to look at the groundwater issue, and hopefully that will be something that will be available for all of us to look at soon. Subsidence is also a factor; the land itself isn’t static, and pumping and human effects on the shallow coastal aquifer are going to affect how it looks in the future.
“The takeaway from this presentation is that we need to start shifting how we think about sea level rise planning to include this additional threat of rising groundwater,” Ms. Plane concluded.
ABBY MOHAN: Emergent Groundwater and Sea Level Rise, the Silent and Largely Unknown Underground Threat
The next presentation was by Abby Mohan, a Marine Geographer and GIS Analyst at Silvestrum Climate Associates. Her presentation built upon the work of Ellen Plane and Dr. Kristina Hill at the College of Environmental Design at UC Berkeley. This work supported the All Bay Collective’s work as part of the Resilient By Design Challenge, in which they modeled shallow groundwater layer for the Island of Alameda, Bay Farm Island, and the Oakland-Coliseum area around the San Leandro Bay.
“We understand how flooding will overtop the shoreline due to sea level rise and storm surge events,” she said. “And we’re also starting to see increased urban riverine flooding due to extreme precipitation events, such as an atmospheric river or in years of El Nino which are predicted to become more frequent in the future. But to really understand the whole story about flooding, you also have to understand the groundwater table and how it might respond to climate change. Adaptation and resilience measures must consider all three flooding components: coastal flooding from sea level rise and storm surge, urban riverine flooding, and groundwater.”
Groundwater flooding may not be a big hazard today, but it could be a significant risk in the future, she said.
Using the same dataset as the Ms. Plane’s presentation, they dug a bit deeper into the data. There are a lot of data points throughout the Bay Area, with some well locations that had data collection extending back to 1937, and many with data collected multiple times a year with a lot of variability, both through seasons and over time, and they wanted to better understand what drove that variability.
This required some tailoring of the dataset. They focused on wells with data collected from 2001 to the present data to focus on recent trends and patterns. They also eliminated all artesian and deep monitoring wells and other wells that were not associated with the shallow groundwater layer. This allowed the researchers to develop an enhanced understanding of how the shallow groundwater surface varies with large rainfall events, with periods of drought, and with tidal influences near the shoreline.
The graphic (below, left) shows the connection between the salt water of the bay and the fresh groundwater layer. The first thing that was apparent from the modified dataset was how much the groundwater levels varied throughout the year, with the water table at its highest during the rainy season from January, February, and March, and falling during the drier months of summer and during drought years.


“We really wanted to create a good model of the groundwater surface, and so in order to do that, we needed to incorporate the interaction between the waters of San Leandro Bay and San Francisco Bay and the groundwater surface,” she explained. “So we added in the mean tide level points from the FEMA tidal datum study to help draw out the surface to reflect where the Bay meets the groundwater.”
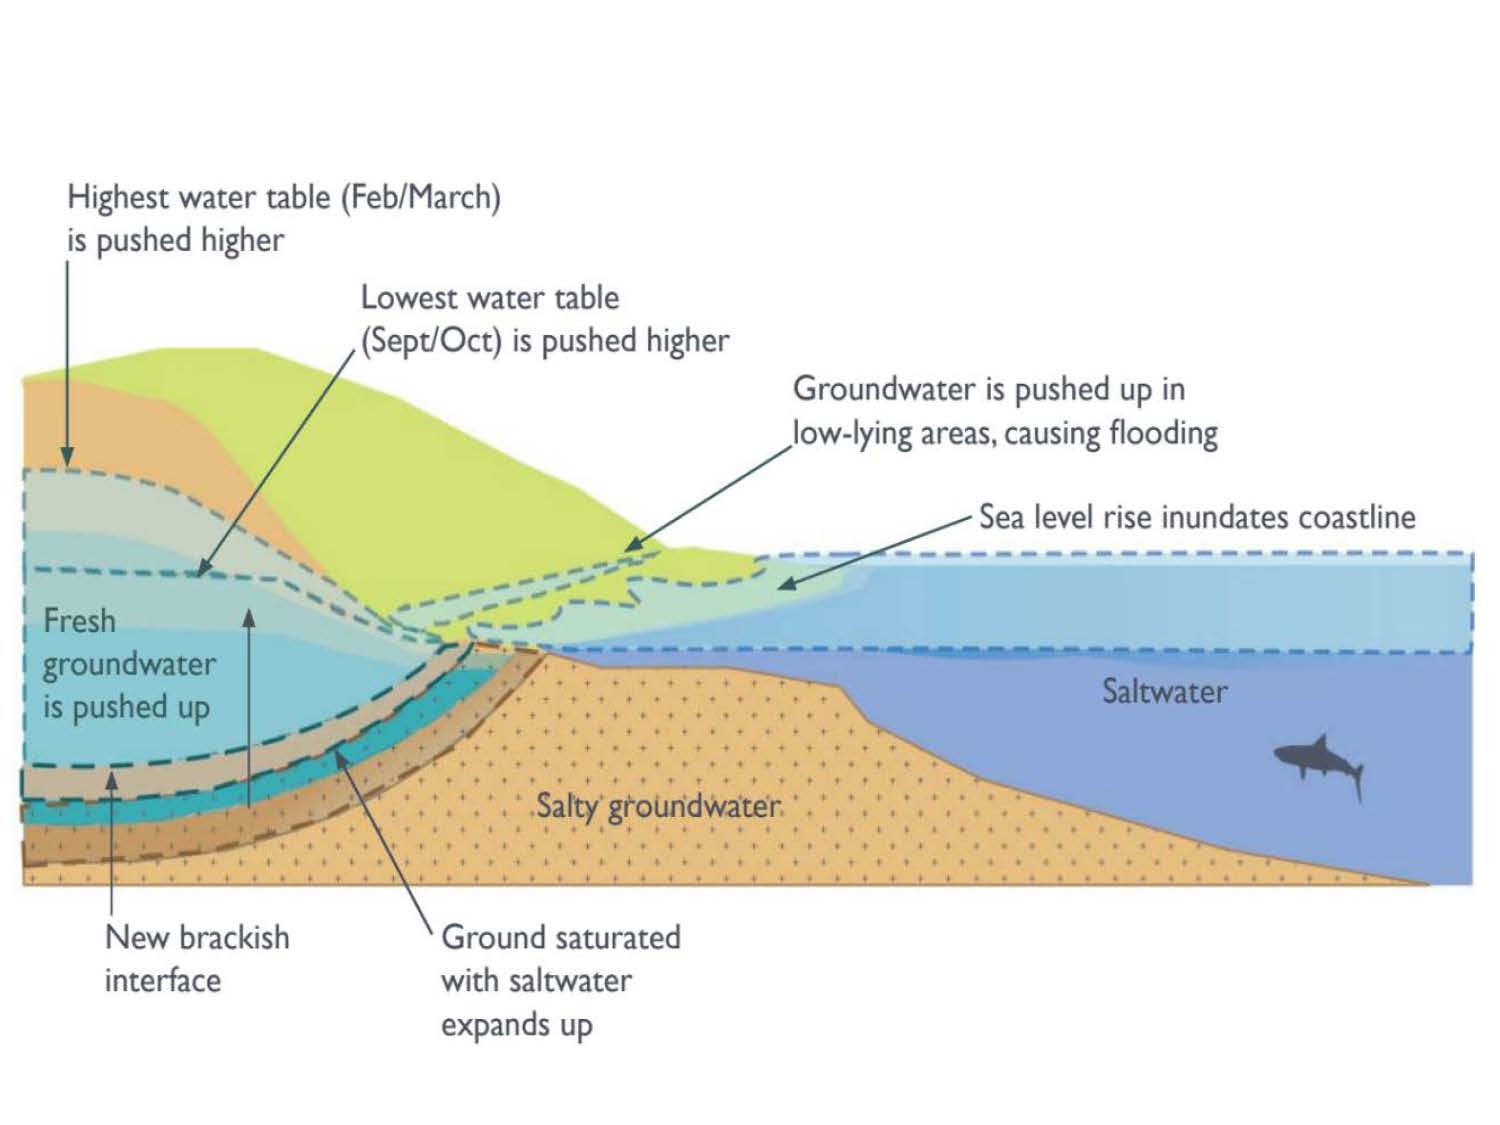 They next started to model response of the groundwater surface to sea level rise. “As sea levels rise, the saltier Bay water along the coastline will push the fresher groundwater layer up creating a rise in the groundwater table,” explained Ms. Mohan. “That fresh groundwater could get pushed up to the ground surface and pond at the surface, creating emergent flooding. This will be particularly accentuated during very wet years when that groundwater table is at its highest. As the ground starts to get saturated, sort of like a sponge, it will create emergent ponds above ground.”
She presented the results of the model reflecting 24” of sea level rise (lower, left), which is the 2050 high-end scenario of the range. The pink shows where water could pond at the surface.


The next map (above, right) shows the areas where rising sea levels have overtopped the shoreline in blue, the areas where both overtopped water from the shoreline and emergent groundwater are shown in purple, and low-lying areas are shown in green. “You can really see that in 2050, the story is groundwater,” she said. “There’s a lot of potential flooding, and it’s located in areas that extend well beyond the areas where sea level rise is likely to flood.”
The map (below, left) of 36” of sea level rise is the 2100 most-likely scenario; the map (below, right) of 66” sea level rise is the 2100 upper end of the spectrum.


“As you can see, it’s going to be really wet,” Ms. Mohan said. “The areas that are pink are emergent groundwater that has really extended beyond the previously flooded zone, and communities thought to be out of the sea level rise vulnerability zone are going to be vulnerable to flooding. And the combined effects of groundwater and sea level rise will compound health impacts, displacement, and limited access to open space that already characterizes this deep East Oakland community.”
“All three cities surrounding San Leandro Bay will face significant challenges to their sewer systems and to building and roadway stability,” she said. “Adaptation planning is already happening, and if we only focus on levees to keep the water out of the bay, we won’t be solving the entire flooding problem and we’re not going to be able to understand the whole story.”
Ms. Mohan acknowledged that this is just a first step and a novel use of the dataset; there are several ways the methodology could be improved, such as adding additional well data points where the data is sparse. She noted that Silvestrum is about the kick off a study with the Lawrence Berkeley National Labs looking at extreme precipitation around the bay; they hope to return next year to present on the results of that study, which can then be incorporated into their groundwater modeling.
“If we want to be prepared for the future, we need to learn how to tell the whole story, and that includes groundwater,” she concluded.
Question: What is the adaptation strategy? Can this water be pumped?
Ms. Mohan: “The problem is they’ve tried doing some pumping, for example in New Orleans or up here in the Delta, and in other areas with similar soil that we see in this area, the problem with pumping is that it can causes subsidence, and that can be even more pronounced in areas of Bay fill like the areas around San Leandro Bay. I don’t necessarily have any adaptation solutions to offer yet. More research is needed on that field.”
Question: How is the rising of the groundwater affected by an impervious surface?
Ms. Mohan: “It would probably just push the parking lot surface up, and it would crack and break apart so the water could find its way out. If it was an impervious parking lot, it would displace it and just push it into the areas where it would come out. The other thing it would do … if a concrete parking lot that was two feet deep, and previously the groundwater table had been below that, there wouldn’t have been any issue. But if the groundwater table is now immediately underneath that concrete, water finds a way to get into the cracks and cause a lot of infrastructure instability. So when we’re talking about building infrastructure and flooding basements, this is the problem we’re talking about is exactly that. When you have a basement that’s concrete and you have a groundwater table that is now directly underneath it, that water is going to start to seep into that concrete and cause infrastructure instability. The other thing is that if there are new building regulations in order to address that, there could be more FEMA flood insurance that’s required which adds to the cost of housing in this area.”
FOR MORE INFORMATION …
- Click here for more information on this study from Silvestrum Climate Associates.
- For more information on the Resilient by Design Challenge, click here.
 Sign up for daily email service and you’ll never miss a post!
Sign up for daily emails and get all the Notebook’s aggregated and original water news content delivered to your email box by 9AM. Breaking news alerts, too. Sign me up!
