


Symposium focuses on how to integrate agriculture, wildlife, and public access on the managed floodplain
 In between Sacramento and Davis lies the Yolo Bypass, a narrow strip of land 40 miles long and 3 miles wide. Capable of carrying four times the flow of the Sacramento River, the bypass is part of a larger flood control system that performs the critical function of protecting the city of Sacramento from catastrophic flooding and as such, the bypass has been integral in protecting the city from flooding at least seven or eight times.
 The Yolo Basin is part of the Pacific Flyway, a migration route traveled by millions of waterfowl annually. The basin had historically supported many species, but this changed after the Army Corps built the Sacramento Flood Control Project in the early 20th century. The construction of levees and weirs transformed the naturally draining basin into a managed floodplain.
While the flood control system and Shasta Dam served to reduce flooding and protect downstream communities such as Sacramento, the taming of the river system eventually took its toll on wildlife. Populations of native species plummeted, and within just a few decades, researchers were calling attention to the loss of wetland and riparian habitats and voicing their concerns for the impacts to the millions of migratory birds dependent on Pacific Flyway.
 In 1990, the community-based Yolo Basin Foundation spearheaded an effort to restore habitat in the bypass, culminating with the establishment of the Yolo Bypass Wildlife Area in 1997. Since its inception, the wildlife area has grown from 3700 acres to over 17,000 acres with its success credited to a unique combination of commercial agriculture, wildlife protection, and public access. The Yolo Basin Foundation’s efforts have been recognized internationally as a model, having achieved its success by forming collaborative partnerships with local farmers, private wetland managers, conservation organizations, and elected officials, as well as local, state, and federal government agencies.
 Research in recent decades suggests that seasonal floodplain habitat could provide substantial benefits for salmon, steelhead, and other native species. As the largest remaining contiguous floodplain remaining in the lower Sacramento Valley, the Yolo Bypass finds itself in the focus of numerous plans and processes that envision infrastructure changes and habitat restoration, including substantial amounts of seasonal floodplain restoration. Some of the changes being proposed would increase the frequency and duration of flooding in the Yolo Bypass to provide more habitat, but this increased flooding could potentially create conflicts between existing land uses such as agriculture, flood protection, migratory waterfowl, and terrestrial species habitat.
 With habitat degradation and loss being thought to be the most serious threat to species on the edge of extinction, a movement has emerged in recent decades towards ecological restoration as a strategy to address and counter these species losses. However, ecological restoration is not simply a matter of returning to natural conditions; oftentimes what can be achieved reflects a host of trade-offs between different land uses, different stakeholders, funding constraints, and natural resource demands as well as political forces.
 In the Yolo Bypass, the success achieved so far has been through collaboration and cooperation in a process that is inclusive of all stakeholders. As additional governments, agencies, stakeholders come to the table, creating a process to integrate these many plans and processes that is collaborative, acknowledges trade-offs, and inclusive of local interests will be critical to success. With many multi-benefit projects planned around the state and in the Delta in particular, the outcome of the efforts in the Yolo Bypass to reconcile and resolve the many conflicts and challenges could have far-reaching implications.
In December of 2014, the UC Davis Center for Aquatic Biology and Aquaculture and the Delta Science Program hosted the symposium, Meeting Nature Halfway on a Floodway: The Yolo Bypass as a Reconciled Ecosystem, which brought together scientists, researchers, conservationists, and stakeholders to discuss how the Yolo Bypass can be re-engineered to accommodate increased seasonal floodplain restoration while still retaining its agricultural productivity and flood protection functions.
In this first portion of coverage, Jeff Opperman from the Nature Conservancy and Mike Mierzwa from the Department of Water Resources discuss the power of rivers and the function the Yolo Bypass as a flood control facility.
JEFF OPPERMAN: The Accidental Model: the Yolo Bypass and the multiple benefits of floodplain restoration
 Opening the symposium was Jeff Opperman with the Nature Conservancy’s Great Rivers Partnership, a global community working to secure the health of the world’s Great Rivers for the benefit of people and nature.
“The Yolo Bypass is so interesting and so valuable in so many ways, and in so many ways that were never really intended,” began Jeff Opperman. “I suggested the title ‘The Accidental Model’ because it’s something that we do use as a model, but a better title is that it was accidentally multi-purpose but it’s becoming intentionally a model. There’s a difference there.”
The Yolo Bypass is two-thirds agriculture and one-third wildlife refuge, and it provides a whole array of amazing benefits for waterfowl, open space and recreation, groundwater recharge, and now fish, he said. “But the bypass wasn’t created to provide any of these benefits; it was basically created just to solve a problem and the problem was that the Sacramento River was continually flooding,” he said.
 Back in 1850, the editors of the Placer Times after experiencing a flood wrote, ‘It will be seen that the Sacramento city can be easily protected against inundations and that, too, at a comparatively small expense,’ Mr. Opperman noted. “So their first exposure to the power that the Sacramento River could generate left them not shaken with humility about this amazingly powerful river they lived next to, but filled them confidence and optimism that they were going to relatively quickly solve the problem.”
 Initially, they tried building levee after levee only to have them fail over and over, he said. “There was a debate; there were people who were saying, ‘We can put levees close to the channel, it will confine and constrict it, it will cause the river to scour the bed and remove the hydraulic mining sediments, it will flush out the channels, and that’s how you keep the system safe’”, he said. “Other people were saying, ‘This river generates flows that can never be contained within close levees’, so that was an interesting debate that was happening as long ago as the 1870s about how the river could be best managed to make the rest of the valley predictable and dry.”
However, multiple levee failures finally won the debate, and so the system that emerged created this parallel drainage system which in a sense was a reconnection of the floodplain, although people didn’t talk about it that way, he said. “The bypass is 60,000 acres and the Sutter Bypass is another 20,000-30,000 acres. They tried to levee them off, they tried to drain them and farm them, and then they acknowledged that they couldn’t, and they reconnected them. It was a controlled connection over weirs, but what they wound up doing is reconnecting vast areas of floodplain and setting the stage for all these floodplain benefits we’ve only now come to appreciate.”
 “The Yolo Bypass is an important model because in the past few decades, there’s been a growing appreciation that floodplains provide diverse benefits, while at the same time, scientists, managers and conservationists have been realizing that most floodplains in big temperate rivers have been disconnected,” he said. “So as all of the benefits that are being quantified and understood, those benefits are in jeopardy or have been lost.”
“It’s also becoming clear that traditional approaches to flood management are under strain because of aging infrastructure, development changes, and climate change, and there is the realization that connected floodplains can help,” Mr. Opperman said. “This is not a new realization; it seems it was people of the Sacramento Valley came to realize in the 1920s that connected floodplains can be a huge part of the solution to try to maintain overall management of floods.”
 He then presented a graph of the value of ecosystem benefits from different habitat types, noting that it was from a paper in 1997 that was the first to try to quantify the full set of ecosystem services that arise from naturally functioning ecosystems. “Floodplains wound up being on a per acre basis, by far, the most valuable non marine ecosystem, dwarfing even forests on a per-acre basis,” he said. “This paper found that floodplains and swamps might represent about 2% of earth’s land surface, but they provide about 25% of the terrestrial ecosystem service benefits, so there is an amazing concentration of benefits that come from these floodplains.”
 “There’s been almost an 80 to 90 percent conversion or disconnection of floodplains in the Central Valley,” Mr. Opperman said. “It’s about an order of magnitude difference between the historic and the current extent of floodplains, and this is true for a lot of the major temperate rivers around the world: the Mississippi, rivers in Europe, and the Yangtze.”
 “Another trend is that even though floodplains have been lost largely because of the infrastructure built to manage flood risk such as dams and levees and that despite billions, maybe trillions in aggregate of investment in this infrastructure, the flood damages in the United States continue to rise over periods in constant dollars,” he said. “In fact, they’ve gone from a couple billion per year to $7-8 billion per year in flood damages.”
 Climate change is likely to bring greater frequency of large flood events, and this is already occurring, Mr. Opperman said. “If you look at the last 30 years compared to previous years, there’s already an increase in intense precipitation and particularly in the Midwest and the northeast, there’s been significant increase of the frequency of very intense rainfall events. That will translate likely into changing flood frequencies.”
 As an example of how the Yolo Bypass has provided valuable flood protection, Mr. Opperman presented a graph of the flow in the Sacramento River system in February of 1986. “It was about a month and a half period where the stage of the Sacramento River within its levees, but very close to complete capacity, so the rest of that water was in the bypass for a full month. Obviously the channel capacity had no way of managing this flood and it had to be dealt with in the bypass, so at a time when the major reservoirs were full and discharging at their maximum and the rivers were close to full at the levees, the bypass was absorbing all that water and conveying it through.”
So how do you turn this accidentally multi-purpose Yolo Bypass into an intentional model? Mr. Opperman suggested a three step process:
Step 1: Study and learn
This is already happening on the bypass, he said. “Scientists began to study the bypass to quantify and articulate what was happening and what those multiple benefits were,” he said. “We have a bypass that is accidentally providing a full range of much broader benefits than ever intended, and we now know about it, and then it becomes a management choice. Now it’s something that people can respond to.”
 As a example of some of the studies in the bypass that he’s participated in, Mr. Opperman presented a graph of the comparison of changes in long-term flooding from before and after the construction of Shasta Dam, noting that this was from a paper he worked on with others. “We were looking at a particular type of floodplain that is flooded fairly regularly for a fairly long period of time in the late winter to spring, which is the time period when there is the most biological response,” he said. “Before Shasta, these weirs were overflowing for long periods in the spring for 80% of the time. Almost every year, the bypasses were getting flooded in the spring for long duration flooding. After Shasta, it dropped to about 20% and it became much less common.”
 He explained that for their study, they defined an activated floodplain as one that is flooded for a long period of time, biologically active, and predictable, happening in two out of three years; they then mapped where that occurred in the system. “In places in the leveed river system, that hydrological set of criteria correspond to the river channel and that’s it; there really isn’t floodplain that’s being inundated, it’s just the very channel margins,” he said. “In the more complex Sacramento river system, it’s the river plus these other features, oxbows, sandbars, some side channels, so there is a lot more habitat complexity than in other parts of the system.”
“Of course the place that has it the most, this activated floodplain, as we defined it in this paper, is basically the Yolo Bypass. The bypass had the vast majority of all the acreage that gets this activated biologically important floodplain, so it was another study confirming that the bypass is somewhat unique in terms of its ability to support these functions that we’re looking for.”
Step 2: Adapt and optimize
“We are learning what the bypass can do, how it can do it, the types of floods, the types of durations, and I know this work is ongoing,” Mr. Opperman said. “There is a lot more we need to know about that specifically, but as we learn more, now there is this dialog about moving this accidental system into an intentional system of optimized and refined management.”
 Another important feature of the Yolo Bypass is that it greatly increases the flexibility of the reservoir system, he said. “To be somewhat simplistic, in a multi-purpose reservoir, you have flood control space that’s basically competing with water supply space, so you’re vulnerable to having empty space in a drought,” he said. As a thought experiment, he added up the total volume conveyed in the 1986 flood and found it to be 13 billion cubic meters, which is almost the exact same amount of total reservoir storage in the Sacramento Valley. “Basically the Yolo Bypass managed and conveyed the equivalent volume of what we’re able to store on the Sacramento. … It was during a period when the rest of the reservoirs were full, the levees were almost full, meaning there was no place in that system to put water, and the bypass was in just three days handling as much water as could possibly be stored in the reservoirs.”
“So the thought experiment is what does the bypass offer California in terms of its flexibility for managing water?” he said. “Clearly, it is giving a lot of flexibility in terms of reservoir storage dedicated to water supply versus flood storage, or the height of the levees or the number of reservoirs … but if the bypass had not been built, and California tried to solve this with reservoirs and levees, how many more reservoirs, how much higher levees? So for countries who are thinking about embarking on the construction of new reservoirs and construction of levees and they are trying to manage for multiple purposes, this kind of information should be interesting to them about the flexibility that big floodplains provide in the system.”
Step 3: Communicate it
 Communication is needed to turn the accidental model into an intentional model because nothing is as influential as a successful example, Mr. Opperman said. Through the Nature Conservancy’s Great Rivers Partnership which has eight rivers around the world, they give advice to government and companies as they plan infrastructure. “That’s the great challenge going forward is that rivers around the world,” he said. “Here in the U.S., we have a mature set of infrastructure, in fact too mature, but in much of the world, they are just beginning this process of developing major infrastructure, so we see a great opportunity to try to influence decisions so that they are not accidental.”
“If you could plan from the very beginning, you could plan for the fact that floodplain provide these multiple benefits, you could plan flood management systems that don’t just rely on dams and levees, but instead have large areas of connected floodplain to help manage those high flows and to provide those other benefits,” he said.
In places like the Magdelena River in Columbia, the Nature Conservancy put in proposals and is now working on a set of hydrologic and hydraulic models to demonstrate how levee setbacks and bypasses could be a big part of the solution. “So that’s what we’re trying to do,” Mr. Opperman said. “We’re taking the example of the Yolo Bypass to places like Columbia that are having the same debate that people were having in Sacramento in 1900, and inform that debate today.”
MIKE MIERZWA: Past, present, and future roles of the Yolo Bypass in flood management
 Sacramento has sometimes been described as ‘the most flood prone city not named New Orleans’. Sitting at the confluence of the Sacramento River and the American River, Sacramento has a well-documented history of flooding. Settlers soon learned that torrential storms and a melting snowpack would periodically and frequently rush down the river and its tributaries, causing it to overflow its banks, spreading floodwaters over hundreds of miles and millions of acres, creating a large inland sea that would take months to drain.
Efforts to control flooding in the Sacramento Valley began in the Gold Rush days and continues today in an ongoing process called the Sacramento River Flood Control Project. The SRFCP consists of 980 miles of levees, plus overflow weirs, pumping plants and bypass channels that are designed to protect the communities and agricultural lands of the Sacramento Valley and the Delta.
 In this next presentation, Michael Mierzwa with the Department of Water Resources discussed the important role that the Yolo Bypass plays in protecting the city, touching on the history of the bypass, how the bypass works to bypass flows, and how it performs under significant flood events.
He began by saying that he would like people to think about the Yolo Bypass as actually being a river. “It has always been part of the Sacramento River; it will always be part of the Sacramento River,” he said. “While I think it’s appropriate to call it the Yolo Bypass, we need to think of it as a river.”
 He began with the rise and fall of rivers using the Mississippi River basin as a concept, presenting a slide of satellite pictures of the confluence of the Missouri River and the Mississippi rivers in August of 1991 and August of 1993, during record floods in the basin. “What I want you to see here is that there’s both a seasonality with rivers and there are also interannual differences,” he said. “Literally the physical and flow changes over the course of time and it can happen over the season as the river swells and recedes back again, and it can happen between flood years and drought years.”
He also noted that in the 1993 picture, some of the areas some of the floodplains next to the river had risen a bit higher. “What’s physically happening in a lot of our river systems is that the river over time builds up higher and higher and higher,” he said. “During those drier periods in a non-significant flood event, there would be some inundation in these areas, and as the floodwaters would recede, it would actually start building up these natural banks. That same type of configuration exists here in California, it’s common to most rivers in the world, and it’s one thing that I really want us to think about when we talk about the Yolo Bypass.”
History: Looking at the Yolo Bypass in a broader context
 He then presented a slide of a timeline of significant events in the Yolo Bypass. He noted that the top track is legislative actions, starting with the 1861 state flood control act, and the establishment of Reclamation Districts. The central track is the flood event track, and the bottom track is the construction track. He noted that levees were constructed before there were federal and state laws regulating levee construction.
Mr. Mierzwa pointed out the 1907 and 1909 floods on the slide. “These are the basis for a lot of the actual design water surface elevations in our Sacramento River flood control project; it is the information we gathered over a century ago that our system is based on and operated today.” He also noted that the Sacramento Weir was built prior to the construction of the Fremont Weir, so there was water coming into the Yolo Bypass from the Sacramento River even before the northern part of the bypass was completed. He also noted that the federal 1928 act came after the great flood of 1927. “You can see that our response to managing floodwaters has been very reactive,” he said.
 The physical extent of the bypass is pretty small, Mr. Mierzwa noted, presenting a map taken from the State Plan of Flood Control, the state’s official documentation of the flood control system. He noted that the red lines are levees that are part of the federal-state levee system. “These are levees that in 1957, the state provided an assurance memorandum to the federal government saying that in perpetuity, we would operate and maintain these levees to whatever standards the federal government wishes to have for that, with the intent being that we would put that to beneficial use.”
The numbers on the map are the design flow capacities based on the 1907 and 1909 flood events. “We actually went through and did backwater calculations using a slide rule to figure out what we thought the amount of flow that the Sacramento River and the Yolo Bypass convey at a similar latitude,” he said. “In this case, about 5/6ths of the flow in a significant flood event will pass through the Yolo Bypass.”
 Mr. Mierzwa noted that the numbers at the Sutter Bypass and its confluence with the Feather River appear to show an error in that 320,000 cfs and 180,000 cfs most certainly equal more than 380,000 cfs. “The reason for that the system was never designed to have every element of the system operating at capacity at the same time,” he said. “There’s a hydrologic principle behind that, but the other thing that’s happening is that the system is backwater-dominated. This means as flows come from upstream, they are governed by the water that’s actually sitting downstream, and so the lesson here is when you make any modification to a federal facility, you need to be worried about what’s coming from where the floodwater is coming from, but you also need to take into consideration everything downstream of you.”
Hydrology: Understanding how the Yolo Bypass works to bypass flows

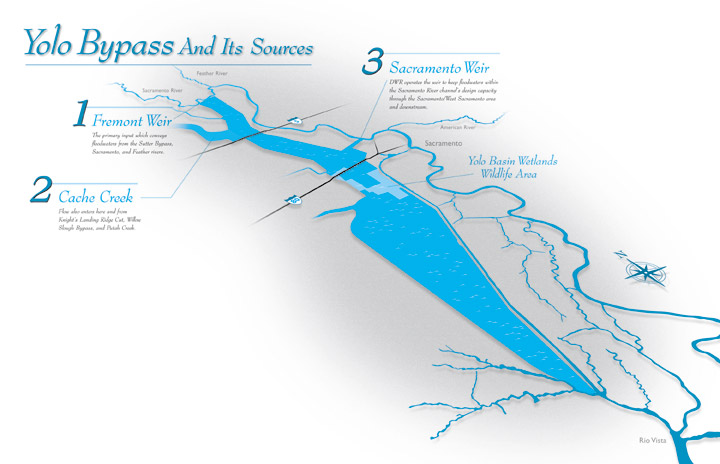
Water enters the bypass at its northern end over the Fremont Weir when the Sacramento River reaches a crest of 33.5 feet. Flows also enter the Yolo Bypass from Knight’s Landing Ridge Cut, Cache Creek, Willow Slough Bypass, and Putah Creek. Additional water enters from the Sacramento Weir located in West Sacramento adds flow from the American River. The waters collect and flow out to the Delta just above Rio Vista. As the floodwaters recede, the basin empties through the Toe Drain, the perennial riparian channel on the east side of the bypass.
Mr. Mierzwa began his discussion of flows through the Yolo Bypass with the analogy of running in a fun run or a marathon. “I’m not a fast runner, but I make a decent pace,” he said. “Invariably what happens is that there’s a group of 3 or 4 people ahead of me that have carriages with kids in them and dogs, and the race starts, and I spend the first couple minutes of that race trying to get around the people that are downstream of me. So when you’re thinking about how a river flows or works, if you haven’t had the opportunity to do a fun run, please do because it’s a really excellent opportunity and mental construct to think about how our river systems flow.”
 Our current flood system was designed based on limited experience, and our descriptions of peak capacities in our system does not take into account the rise and recession of water levels, and we tend to forget about the importance of backwater. “The key to managing floodwaters is to keep the water down,” he said. He noted that the schematics had flow rates, but that was a disservice, because what harms people is water coming up into those areas. “What I have here is a concept that shows that the greater the depth of the water, the larger the force on the levee. In this case, I have two Design Water Surface Elevations, and as the design water surface water elevation increases, the hydrostatic force or the force that’s wanting to push that levee out increases, so the name of the game in a simplest terms, is to keep the water level down for as short as time as possible so that you actually reduce the force on that levee.”
 He then presented a slide depicting the stage discharge relationship, explaining that the graphic shows Sacramento on the left and the Yolo Bypass on the right because the graphic is looking downstream. “What I’m showing here is that there’s a difference in the cross section between the Sacramento River which is very deep and the narrow, and the Yolo Bypass which is very broad and shallow,” he said. “They work together to move flows, but they do it in very different ways.”
He explained that the graph on the right is a simplified version of a rating table that shows stage as a function of discharge. “For any given discharge in a hypothetical channel on the Yolo Bypass, or a hypothetical channel or cross-section for the Sacramento River, you’ll have a different stage for a given flow, and if the goal is to keep the levee from slipping and to keep the water levels down, then what you really want to do is spread the water laterally as it moves downstream through the system, relative to having a really deep and narrowly focused incised channel out there.”
 “They work together, and so really what happens is that the water levels are going to tend to be pretty balanced,” he said. Much like the marathon, if there’s someone ahead of you that is blocking you, you might go around them or perhaps even take a shortcut. “As you go through, the water levels are going to be within a couple feet of each other at a similar latitude when there are opportunities for the flow to go back and forth, but you’re going to have different discharges between those two systems, so when we go through and talk about managing the floodwaters through a system, we need to look at how there’s connectivity through the system. We need to balance those water levels and those stages, and we also need to consider the flows that are coming through there.”
 Mr. Mierzwa then presented a graph showing the three stages of rivers, and acknowledged it was a bit tricky. “This is the area where we make a lot of mistakes,” he said. “What happens here is that we need to acknowledge the variability within the river itself, the hydropgraph. The simplest design in this case would have been what we call a steady state flow, a solid cue and just operate to that cue, but the reality is that the water levels, they rise and recede.” He then stepped through the hydrograph, first noting that there is a rising limb as the water goes up, hits peak flow, goes through a falling limb and eventually gets to a base flow.
He explained that there was a convention that came about in the 1940s through the National Weather Service’s River Forecast Center that the local entities come up with an E19 agreement between the federal government and those local entities as to what assets are exposed when the water gets high enough. He then described the three stages:
- Monitor stage: “What we typically say is when you get to a certain level, you come up with a monitor stage; in non-leveed systems, they call it a bank-full condition, meaning that the river is full and now it’s going to start overflowing.”
- Flood stage: “At this point we actually have consequences associated with the flooding. There are road closures, there are emergency responders are going out, strucutures, usually non-occupied, beginning to get inundated, agricultural operations have ceased at this point in time, and parks are closed.”
- Danger stage: “There’s a point in your riverine system where you get to a danger stage where you have catastrophic consequences.”
He noted that there’s not a big difference in the elevation between the three stages, just a foot or two in a lot of locations. “The beauty of it is that for each location, it is those local entities that go through and describe what it means to them, and they get to set what these levels are, but in our activities, we forecast literally where we should be at that.”
He noted that as we go through and make configurations or changes to reservoir operations, set back levees, or building things new, we have the opportunity to attenuate the hydrograph, which can literally redefine what the hydrograph looks like.
 Another important concept is the factor of safety in the design considerations, he said. “We use freeboard to account for the uncertainties associated with the hydrology,” he said. “It does not account for climate change, levee performance, or variability within the actual downstream conditions – that backwater that’s coming through. It’s literally the variability and uncertainty associated with the upstream hydrology. We don’t’ really know what the 100-year flood looks like; we don’t know that the 200-year flood looks like so we use freeboard to account for it.”
He said that the graph shows that for a given design water surface elevation, there can be two different freeboards. “It happens in the Sacramento River valley,” he said. “We have traditionally a three foot freeboard for riverine leveed system and a six foot freeboard for what’s sitting on to the bypass, and the reason we have this larger factor of safety on the bypass is to account for wave fetch, because as the wind moves across this large, narrow body, can actually bring a lot of that water up onto one of the two levees.”
 He then presented a slide showing a chart of the duration and timing of inundation at the Fremont Weir, noting that it is updated every couple of years. “This gives you two things. You can go through and see the length of time there was flow coming over the Fremont Weir, and the second things you can see is when there was flow coming into the Fremont Weir.”
Hydraulics: Showing how the Yolo Bypass performs under significant events.
He then said he was going to put up three maps that are draft right now that show how the system performs today, and how it will be performing in 2030.
 The first map was of the Yolo Bypass with 100-year flood flows, and he noted that the map is showing deficiencies in freeboard. “Where you’re seeing yellow, that means that those leveed systems are deficient, they are actually holding back the water, but the water is on that 6 feet of freeboard. Yellow means that somewhere between six and four feet of freeboard exists, so it’s not within the specifications, but people aren’t getting wet yet. And when you get to orange, we’re now between four and two feet, so now there’s a greater risk of water coming up as that hydrostatic force increases. And then finally when you get to the red, you are now between two and 0 feet of freeboard out there. This was roughly the flow volume that came through in 1997.”
 He next presented same map, now with a 200 year flow, noting that they’ve increased the flow volume by 15% which corresponds to a 200-year level frequency event. “Now we have some increased deficiencies sitting in within our system.”
 He then presented the same map, this time with near-term conditions. “All I want to say is there’s an imperative for us to act,” he said. “Now I’ve gone back down to 100-year flows, I’ve taken out that 15%, I don’t have climate change in here, I’m just going through playing with roughness, and 30,000 cfs, and I’ve done no other physical constraints in the system, and as we look through this, we’re seeing in some places actual purples, which means some overtopping is forecasted within our hydraulic models. It’s a very simple explanation, but it’s imperative for us to act.”
He also noted that some areas that were yellow have now become green. “That water that is coming out of the system upstream, it actually reduces the water downstream. Now that’s an artifact of the model, it’s not something you would necessarily account for, but it’s something to let you know that this is a dynamic system, and that the water is going to go somewhere.”
He then closed with some key points:
- The Yolo Bypass is part of the Sacramento River – think of it as a river with high interannual variability
- Any changes to the Yolo Bypass must safely address significant flood events through the entire system – downstream & upstream
- The Yolo Bypass remains a multi-purpose landscape that has been designed and managed to provide public safety benefits (i.e. reduced water levels throughout the system), economic stability benefits (i.e. by supporting seasonal agricultural production), and environmental sustainability (i.e. ag friendly and dedicated water fowl habitat); Proposed changes need to address all of these considerations.
“When we think of the Yolo Bypass, we talk of it being a flood management system, but really it’s a water management system that’s paid for on the backs of a publicly funded flood management system, which is poorly resourced to go through and meet all of these future needs out there,” he said. “Finally, the Yolo Bypass is a multi-purpose landscape. It protects public safety, economic stability and environmental stewardship.”
Mr. Mierzwa closed by saying he likes the name the “River Cats” for the local baseball team, “but I do not want it to be a literal name and to see the river run through Raley Field.”
Coming up tomorrow…
Yolo Bypass Symposium, part 2: Fish, fowl, and the mercury conundrum
For more information …
For more information on the seminar and to watch the webcast, click here.
 Make a tax-deductible donation to Maven’s Notebook today and help make an impact on California water in 2015!
Click here for more information.
