
Scripps Oceanography experts explain phenomenon, why this event is likely to be a very strong El Niño, and how these events are detected
By Scripps Institution of Oceanography
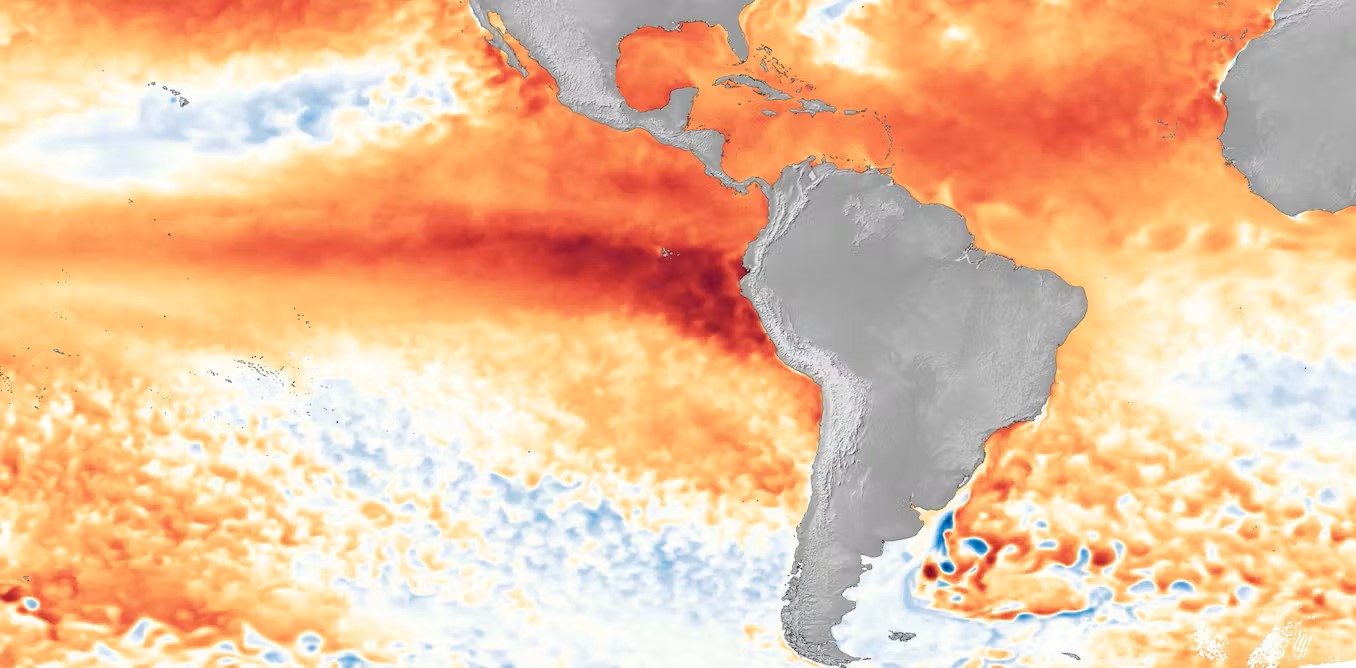
 NOAA declares an El Niño when temperatures in the equatorial Pacific are 0.5°C (0.9°F) above average for several consecutive months. As of August 2026, the National Oceanic and Atmospheric Administration (NOAA) issued an advisory that with ocean temperatures now 2.0°C (3.6°F) above average there is “a greater than 90% chance of a very strong event during the Northern Hemisphere fall and winter 2026-27.”
El Niño’s effects can be powerful — the El Niño-driven ocean warming can increase global temperatures, alter atmospheric patterns, raise sea-levels along coastlines, and impact marine ecosystems.
UC San Diego’s Scripps Institution of Oceanography has put together an El Niño hub to answer questions about El Niño. Here, we dive into what El Niño is, why this year could be a very strong El Niño, and the key observational programs led by Scripps Oceanography helping scientists detect, track and understand this event.
For additional information on El Niño, visit the El Niño Resource Hub.
What is El Niño?
Shang-Ping Xie (Professor of Climate Science and Physical Oceanography, Roger Revelle Chair in Environmental Science): El Niño refers to anomalously warm waters in the central and eastern Pacific Ocean near the equator. La Niña is the opposite — colder than average water temperatures in the equatorial Pacific.
The tropics are like the engine room of the Pacific. Heat in the tropics drives global atmospheric circulation. In that sense, variations in the tropical Pacific like El Niño can have huge impacts on global weather patterns.
What causes El Niño?
Shang-Ping Xie (Professor of Climate Science and Physical Oceanography, Roger Revelle Chair in Environmental Science): El Niño and La Niña are the result of complex interactions between the ocean and the atmosphere.
The trade winds that normally blow from east to west across the tropical Pacific relax in response to El Niño’s warmer water conditions. The trade winds normally push warm water from east to west in the tropical Pacific and cause cold, nutrient-rich water upwelling in the eastern equatorial Pacific. Without the trade winds, warm water builds up in the central and eastern equatorial Pacific.
Anomalously warm water can cause the trade winds to weaken but weaker trade winds can cause ocean warming. It’s somewhat of a chicken-egg problem: “Do we see the ocean side of El Niño or the atmospheric side first?” But really it’s a chicken-egg coupled problem, because the atmosphere and the ocean are in contact and influence each other.
Once an El Niño gets established these atmospheric and oceanic effects can reinforce each other.
What makes this likely to be a very strong or “super” El Niño? How could this one look different from our most recent El Niño in 2023?
Art Miller (Research Oceanographer and Senior Lecturer in Climate Sciences): Calling this a Super El Niño simply refers to the magnitude of the event in the tropical Pacific. There are many measures of the strength, and also the patterns, of El Niño. Forecast models are in strong agreement that there will be a moderate-to-large El Niño event in 2026-27, with some of them predicting the largest ever seen in the historical record of the past 150 years. However, it does not necessarily mean that the event will have a huge impact on our own weather in the U.S. during the upcoming fall and winter, as Shang-Ping has articulated.
This is expected to be a very large event due to the very large amount of heat that has been sequestered below the surface in the western tropical Pacific Ocean. This fuels the positive changes in sea-surface temperature in the central and eastern tropical Pacific, which defines the magnitude of El Niño. A contributing factor in the strength of this event is the increase in overall tropical Pacific Ocean temperatures from global warming. In fact, a new index of El Niño called the Relative Oceanic Nino Index, which removes the warming trend before computing the strength of El Niño, results in a somewhat weaker (~0.5°C reduction) peak in recent El Niño events. Thus, part of the Super El Niño appellation is due to global warming, while the bulk of it is due to the normal build-up of heat in the western tropical Pacific that precedes an El Niño. This heating event also has a very strong signature of the precursor pattern of El Niño, which is also called the Pacific Meridional Mode (PMM). The PMM warming pattern has been evident for many months, stretching from Baja California southwestward towards south of Hawaii, and it’s slowly helping to trigger the developing El Niño in the tropical Pacific.
A key feature that determines how strongly fall/winter weather in the U.S. will respond to this El Niño is the magnitude of the warming near the dateline (180 degrees longitude) in the tropical Pacific. This is the region that triggers the atmospheric teleconnection that drives changes in the North Pacific jet stream and downstream weather over the continental U.S. If the developing Super El Niño is largely confined to the eastern tropical Pacific, it would likely only have relatively local impacts on weather there. If the pattern strongly warms the dateline tropical region for many months, it could establish strong teleconnections with the U.S. But again, as Shang-Ping explained, there are random weather variations and other climate-driven changes in circulation that can confound that El Niño teleconnection; for example, only about 30% of the variability in winter rainfall amounts in the western U.S. are “explainable” by El Niño.
How do we detect El Niño?
Daniel Rudnick (Physical Oceanographer and Director of the Instrument Development Group): El Niños are detected using measurements from a combination of instruments including moored buoys, the Argo network of robotic floats, and satellite measurements. Sea-surface temperatures in the equatorial Pacific from those different sources are the measurements that the National Oceanic and Atmospheric Administration (NOAA) uses to officially declare an El Niño.

Locally, I’ve been monitoring the effects of El Niño off California’s coast using underwater Spray gliders since 2005. These autonomous gliders can cover about 15 miles underwater each day during a series of dives from the surface down to about 500 meters (1,600 feet). This network of gliders gives us continuous measurements of temperature not just at the surface but at depth, as well as various other measurements including oxygen concentration, salinity, and direction of ocean currents. The glider data let us see how California’s waters are responding to changes caused by El Niño in real time. Taking all these measurements down to 500 meters helps screen out local factors that might only be altering conditions at the surface.
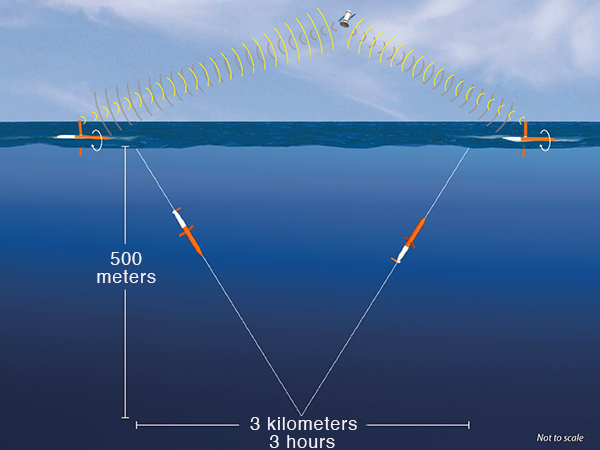
El Niño typically reduces the coastal upwelling that brings cold water full of nutrients like nitrate to the surface off California’s coast, and so having nitrate sensors on the gliders will help us to monitor the status of upwelling along the coast before, after and during El Niño events.
How are ecosystem changes detected and tracked?
Erin Satterthwaite (Sustainability Researcher and Marine Ecologist at California Cooperative Fisheries Investigation (CalCOFI) and California Sea Grant): Marine ecosystem change is tracked through a combination of remote, autonomous and scientist observations. Each observing platform provides a different piece of the puzzle, allowing scientists to monitor changes across the surface and into the depths of the ocean, and over time. By combining observations from ships, satellites, autonomous platforms such as buoys and gliders, and laboratory analyses, researchers can identify ecosystem trends, better understand the processes driving change, and develop models that help predict future ocean conditions.

Ship-based surveys remain especially important because they enable researchers to directly measure ocean conditions using a wide range of oceanographic instruments, including CTDs (which measure conductivity, temperature, oxygen and a suite of additional parameters at depth), water sampling systems, plankton and fish net tows, acoustic instruments, and other specialized sensors. They also enable scientists to observe communities living at the surface ocean such as birds and marine mammals.
Long-term monitoring programs provide the consistent observations needed to detect gradual ecosystem change. For example, CalCOFI has surveyed the ocean off of California every three months since 1949, collecting information on the physical, chemical, and biological characteristics of the ocean. These repeated observations are similar to regular health checkups for the ocean and allow researchers to distinguish natural variability from long-term environmental change. Samples collected during these surveys are analyzed using a wide range of approaches, including microscopy, imagery, biochemical analyses, genetic sequencing, and other molecular tools.
What can Argo tell us about this and past El Niños?
Sarah Purkey (Physical Oceanographer and Argo Lead): Argo is a global ocean observing system providing real-time data on the interior of the ocean. This means it not only describes the embedded tropical Pacific regional variability of El Niño and La Niña, but simultaneously reveals all patterns of oceanic variability anywhere and everywhere in the world. For example, at present the strong El Niño signal in the tropical Pacific coincides with a maximum in global ocean temperature. It is the superposition of these ocean heat anomalies that results in unprecedented heatwaves and precipitation events that impact communities and people on land. Think of Argo as the glue that binds all regional and global oceanic and atmospheric observations, for understanding and prediction of the physical and biogeochemical state of the Earth. Furthermore, the changing ocean conditions have direct impacts on ocean health. Biogeochemical Argo floats reveal how El Niño affects ocean ecosystems by measuring changes in oxygen, nutrients, acidity, chlorophyll, and carbon cycling.

Is climate change altering the frequency or intensity of El Niño events?
Shang-Ping Xie (Professor of Climate Science and Physical Oceanography, Roger Revelle Chair in Environmental Science): The short answer is we don’t know. It’s the subject of an ongoing and intense debate. Models suggest that global warming may have amplified El Niños (with strong events including 1982, 1997, 2015 and the current El Nino clustered in the recent 40-50 years) but this trend may reverse in this century. Projected changes in El Nino are not quite consistent among models. This means our physical understanding isn’t yet precise enough to pin down how El Niño changes in a warmer climate. Really, it tells us we need more research into El Niño.
Mike DeFlorio (Seasonal to Subseasonal Researcher at the Center for Western Weather and Water Extremes) I think Shang-Ping’s answer is still the consensus we have today. There is some evidence that the strongest El Niño events may become more frequent.
Rosa Luna-Niño (Postdoctoral Scholar): Our recent study does not address whether El Niño events themselves will become more frequent or more intense in the future. But we explore whether El Niño and La Niña will continue to provide predictability about winter precipitation in the Southwest. Global climate models give different answers: Some suggest that El Niño and La Niña could become more strongly linked to Southwest precipitation, while others suggest the connection could weaken. When all models are considered together, there is no clear tendency toward either direction. Even the models that do a good job of reproducing the historical El Niño/La Niña – Southwest precipitation relationship project very different futures.
The California coast has already been experiencing a marine heat wave. What could an El Nino mean on top of already high ocean temperatures?
Art Miller (Research Oceanographer and Senior Lecturer in Climate Sciences): As El Niño develops further over the coming seasons, the ample heat already sequestered beneath the surface of the tropical Pacific is poised to drive a stronger El Niño transition there. We expect that it would add to the strong, persistent regional ocean warming (marine heat wave) that has been prevalent off the U.S. West Coast and Baja since early 2026. Wind-driven coastal upwelling, which normally occurs in spring and summer, has been rather weak so far in Southern California. As a result, it appears likely that ocean warming along our coast will increase this summer and continue into the fall and winter because El Niño warms our coastal ocean in two distinct ways. First, El Niño conditions change the atmospheric winds over the North Pacific in fall/winter along our coast, which pushes warmer waters from offshore towards the normally cooler coastal regions. Second, El Nino conditions instigate subsurface waves in the ocean that are trapped along the coast and that push down the surface waters to suppress cool-water upwelling along the coast thereby causing ocean warming.

The presence of El Niño-fueled marine heat waves off our coast can slightly affect the air that arrives in coastal California by slightly warming it and slightly increasing the humidity, making summer and fall less comfortable, and it may somewhat enhance rainfall during the fall/winter seasons. Additionally, marine ecology can be disrupted by marine heat waves due to numerous factors. Decreased vertical mixing can suppress nutrients from reaching the sunlit upper ocean, which fuels the base of the food chain and can thereby lead to less food availability for birds, sea lions, whales and other marine life. Shifts in fish species can occur as tropical species move into our normally cooler ocean waters (Learn more in this Q&A on marine ecosystem impacts.) The double-whammy of an existing strong marine heat wave enhanced by a Super El Niño could wreak havoc on our coastal ecosystem and the economies that rely on it.
Daniel Rudnick (Professor of Physical Oceanography): The temperatures we are observing on two of our underwater glider lines, at Pt. Conception and Monterey Bay, are the highest we have seen them in 20 years as a result of the ongoing marine heat wave. This marine heat wave is unusual in that it developed over the past year while temperatures at the equator were cool. With the onset of the El Niño the question is whether the existing marine heat wave will continue to grow. Measurements in the next several months will be telling.
What are the economic impacts of El Niño?
Tom Corringham (Staff Research Economist): In 2019, Dan Cayan and I published a paper on the economic impacts of El Niño on flooding in the western United States. We found that damages in Southern California were 10 times greater in El Niño winters than in La Niña winters over the 40-year period from 1978–2017. We also found that damages in the Pacific Northwest were three times greater in La Niña winters than in El Niño winters over the same period. In Northern California the signal is mixed. El Niño and La Niña winter flood damages in Southern California can be predicted eight months ahead of time which gives planners time to prepare for the impacts. These figures do not account for other impacts to infrastructure along the coast, shifts in fisheries, agriculture, energy costs, or water supply.
Beyond flooding, El Niño affects agriculture, fisheries, wildfire, energy and economic growth around the world. For example, El Niño can disrupt the extremely productive anchovy fishery off Peru, while drought associated with the 2015 El Niño contributed to Indonesian fires that caused significant economic losses. It also changes crop yields and global food prices. Interestingly, some effects are beneficial: El Niño tends to suppress Atlantic hurricanes, reducing hurricane risk in the eastern United States. A recent economic study estimated that the strongest El Niño events can ultimately affect global economic output by trillions of dollars.
For additional information on El Niño, visit the El Niño Resource Hub.

