
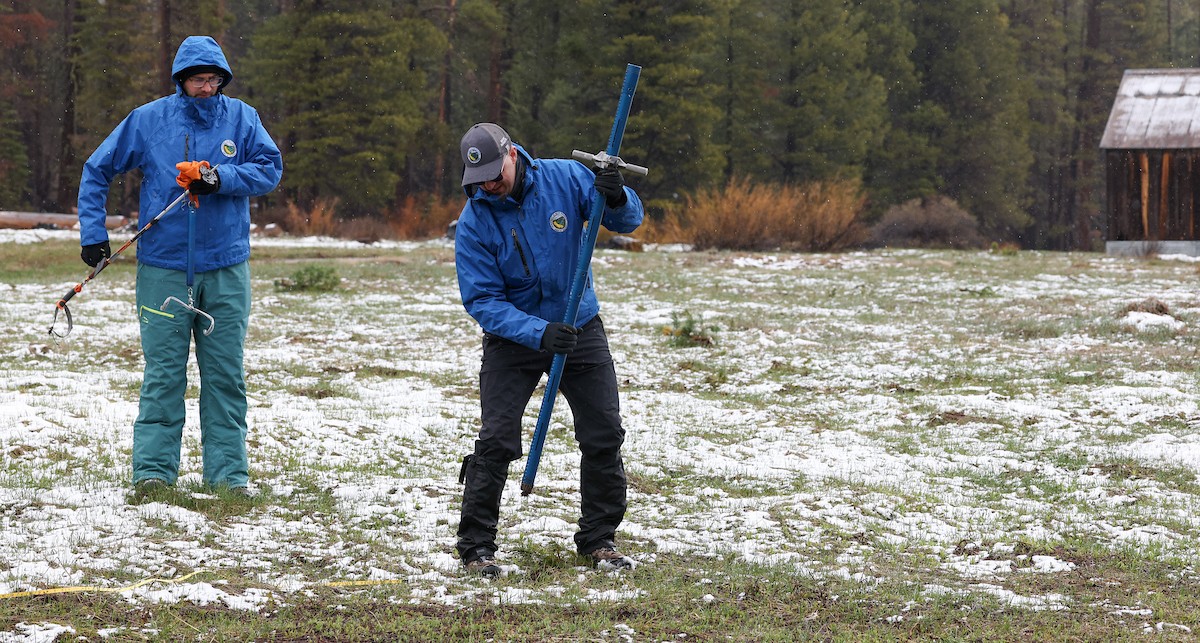
Even by California’s standards of extreme variability, water year 2025–26 has been a strikingly poor snow year, especially in the mountains that feed the Delta watershed. A dry fall and January limited snow buildup even after a few early storms, and by late February snowpack had peaked at just 55% of the historical average. A subsequent heat wave then triggered an extraordinary melt event, and the snowpack never recovered.
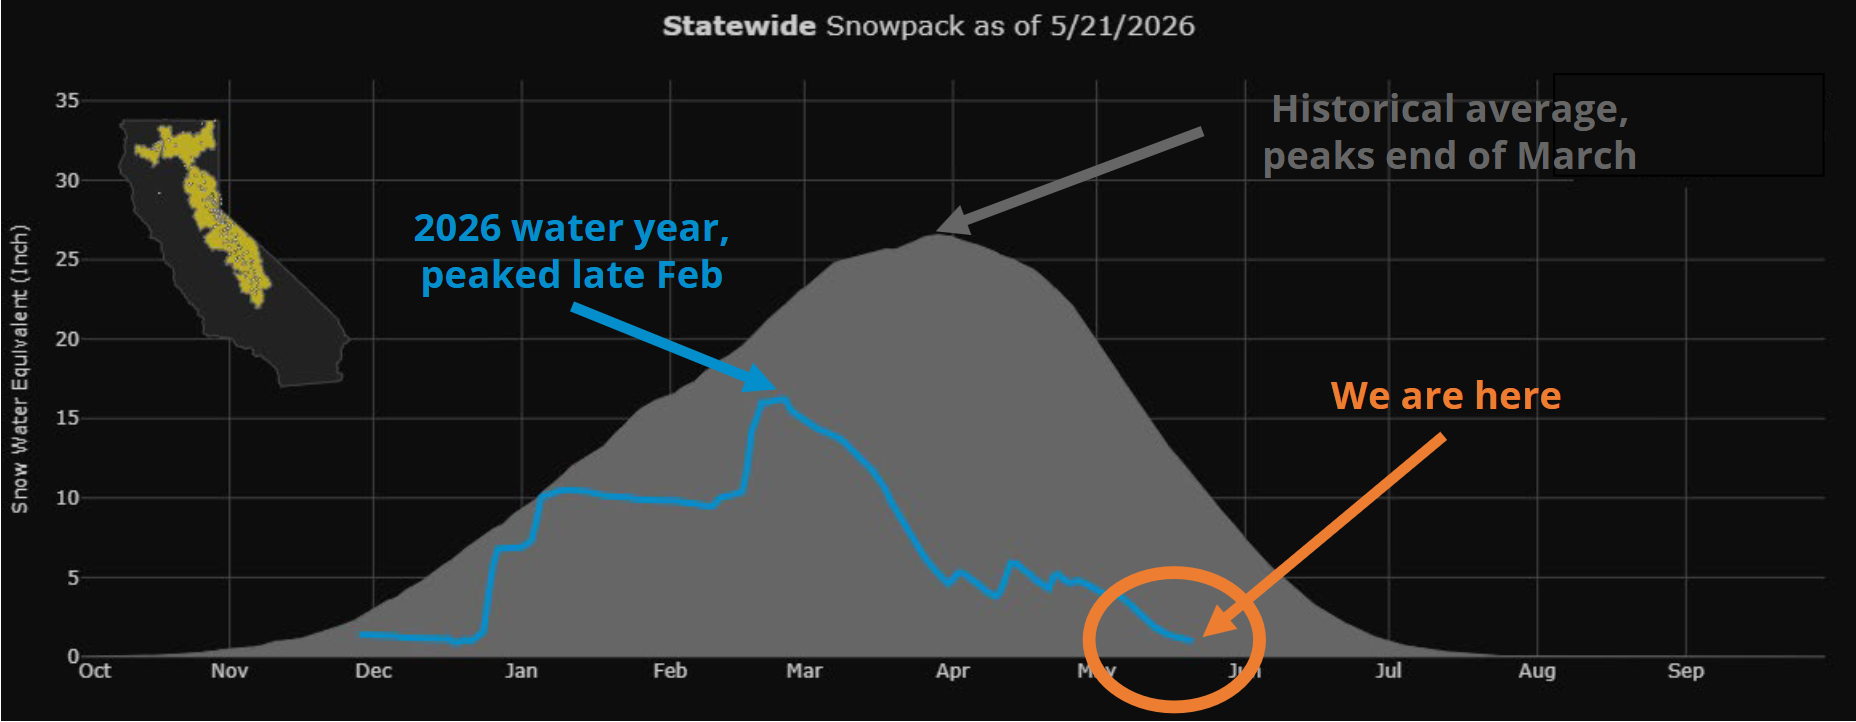
This year’s losses raise a larger question: Is 2025–26 an outlier, or does it reflect the increasingly unstable snowpack conditions California must now plan for as warming reshapes when and how water is stored and released?
“Recent work such as the extreme events edition of the State of Bay-Delta Science, the Independent Science Board’s Emerging Climate Science Symposium, and the forthcoming 2026 update to the Delta Science Plan highlights why forward-looking science is vital to long-term planning and resilience in a water future that no longer resembles the past,” said Delta Lead Scientist Lisamarie Windham-Myers.
At the May meeting of the Delta Stewardship Council, Dr. Areidy Beltran-Peña, a climate and catastrophe risk mitigation specialist with the California Department of Insurance, and Dr. Alan Rhoades, a hydroclimate research scientist at Lawrence Berkeley National Laboratory, presented findings from the study, California’s shifting snowpack: Future implications of enhanced hydroclimate variability and reduced snowpack on California’s water resources, recently published in Environmental Research. The study examines how Sierra Nevada snowpack may change under future climate scenarios, tracing impacts and trends at both smaller watershed scales and across the broader West. Its findings show that a warmer, more variable climate is likely to increase both the magnitude and duration of California’s water gaps, posing growing risks for the state’s major agricultural regions.
Snowpack Decline and California’s Growing Water Gap
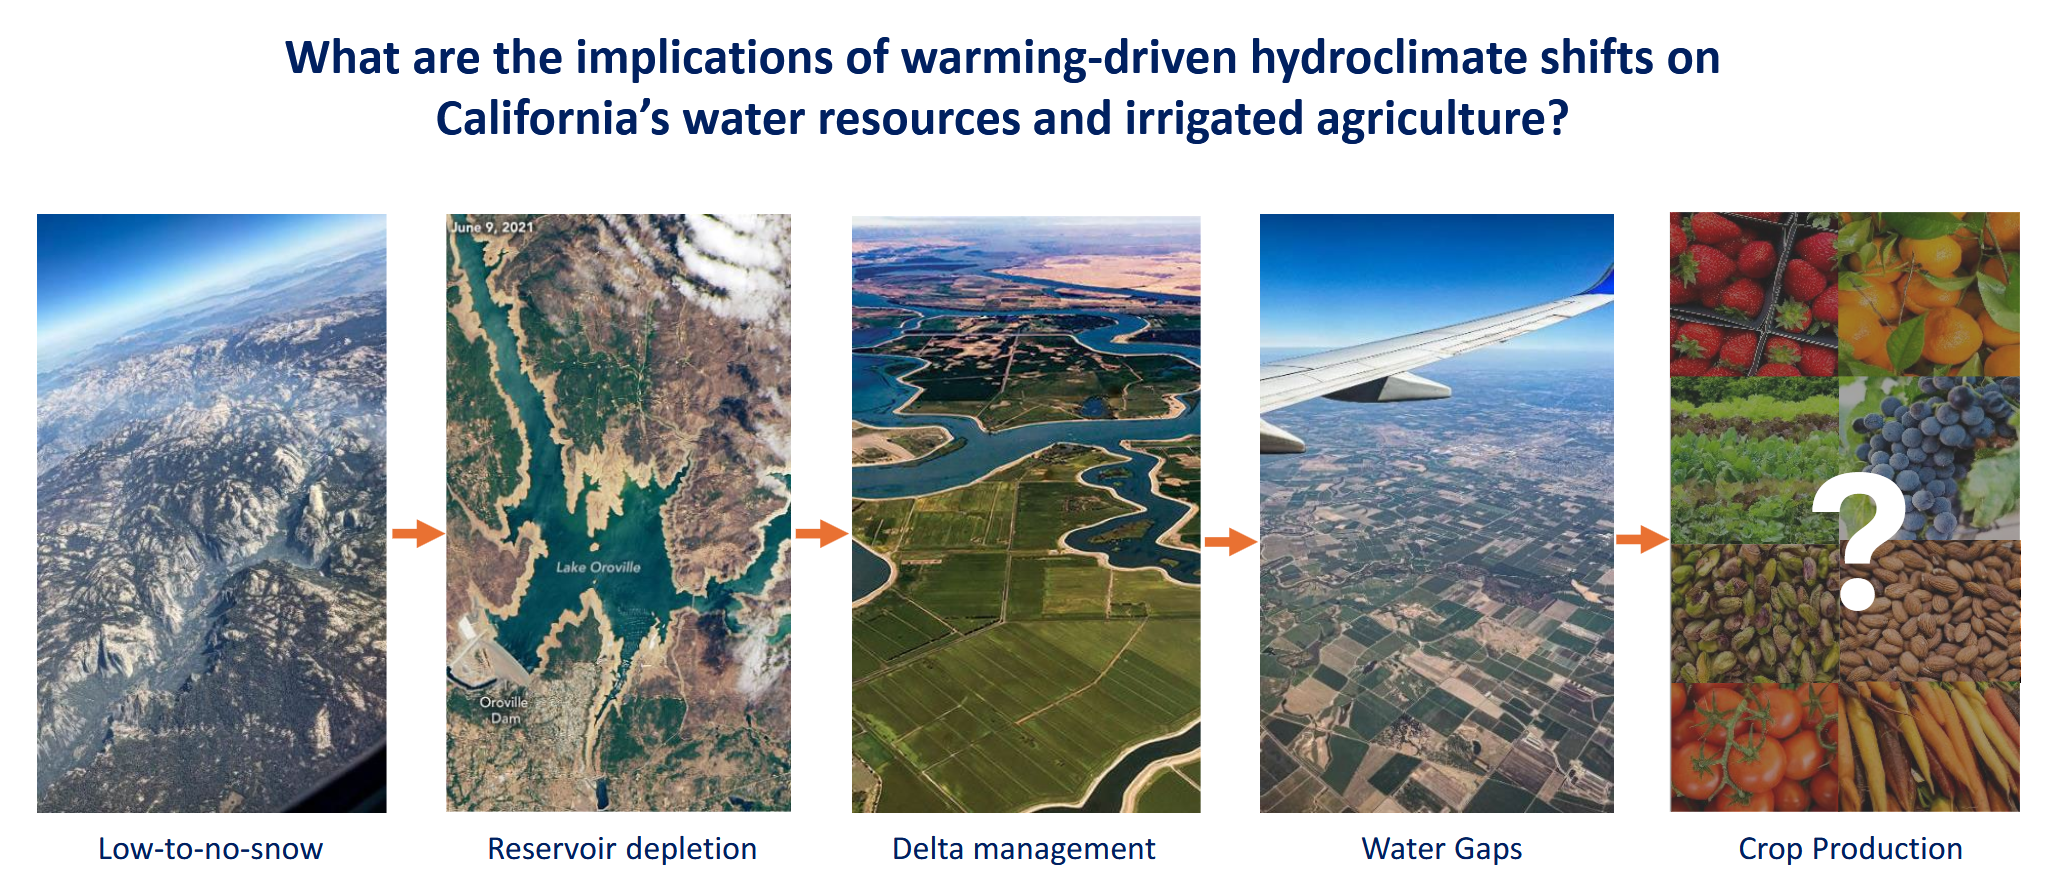 Mountains serve as natural water towers, storing winter precipitation as snow and ice and releasing it as runoff during warmer months. In the western United States, 53% of runoff comes from snowpack. In California, Sierra Nevada snowpack is the main source of water for the state and federal water systems, supporting hydropower, ecosystems, and water supplies for cities and farms.
This water system helps make California the nation’s largest agricultural producer and exporter. The state grows more than 400 commodities and supplies over half of the country’s vegetables and three-quarters of its fruits and nuts.
The study focused on the Sacramento, San Joaquin, and Tulare basins, where irrigated agriculture is the largest water user, accounting for 37% of use in the Sacramento Basin, 66% in the San Joaquin Basin, and 83% in the Tulare Basin. At the heart of the study is a simple question: What will warming-driven hydroclimate shifts mean for California’s water resources and irrigated agriculture? As snowpack declines, understanding how reduced snow-water availability affects farming will become increasingly important.
 The Sierra Nevada provides natural storage equal to roughly 70% of the capacity of the state’s surface reservoirs. Snowpack can be measured in several ways, but snow water equivalent indicates how much water a given depth of snow would yield if it melted instantaneously. This measure matters because snowpacks vary in density as they accumulate, depending on factors such as air pockets and ice crystal structure. Snow water equivalent therefore provides a consistent basis for comparing snowpack across the western United States.
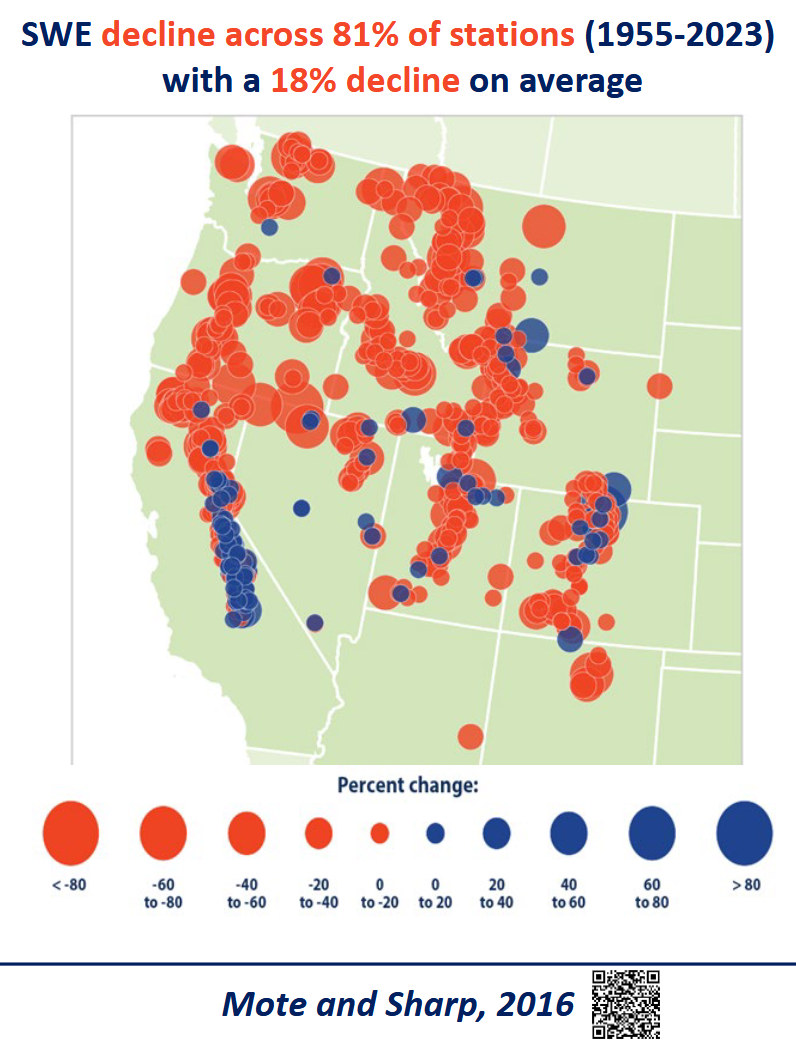
“In terms of snow water equivalent, the observed trends since the 1950s have unfortunately been a declining trend across 81% of stations,” said Alan Rhoades. “It’s about an 18% decline across most stations across the West, and we observe this decline usually around April 1, because that’s traditionally when we think the peak timing of snowpack is occurring, although that is shifting earlier in the year as we continue to warm.”
He noted that California stands out from the rest of the western United States: trends show significant declines in the northern Sierra Nevada but increases in the southern Sierra. He said this pattern reflects strong interannual variability; for example, 2023 was an anomalously high snow year that influenced the trends. Even so, projections indicate that April 1 snowpack will continue to decline.
The graphic shows below the April 1 snow water equivalent on top and the peak snow water equivalent on the bottom for the north, central, and southern Sierra Nevada under historical conditions, as well as the 1.5, 2, and 3 three degrees of warming scenarios. The study found that peak snow water equivalent is projected to occur earlier in the water year.
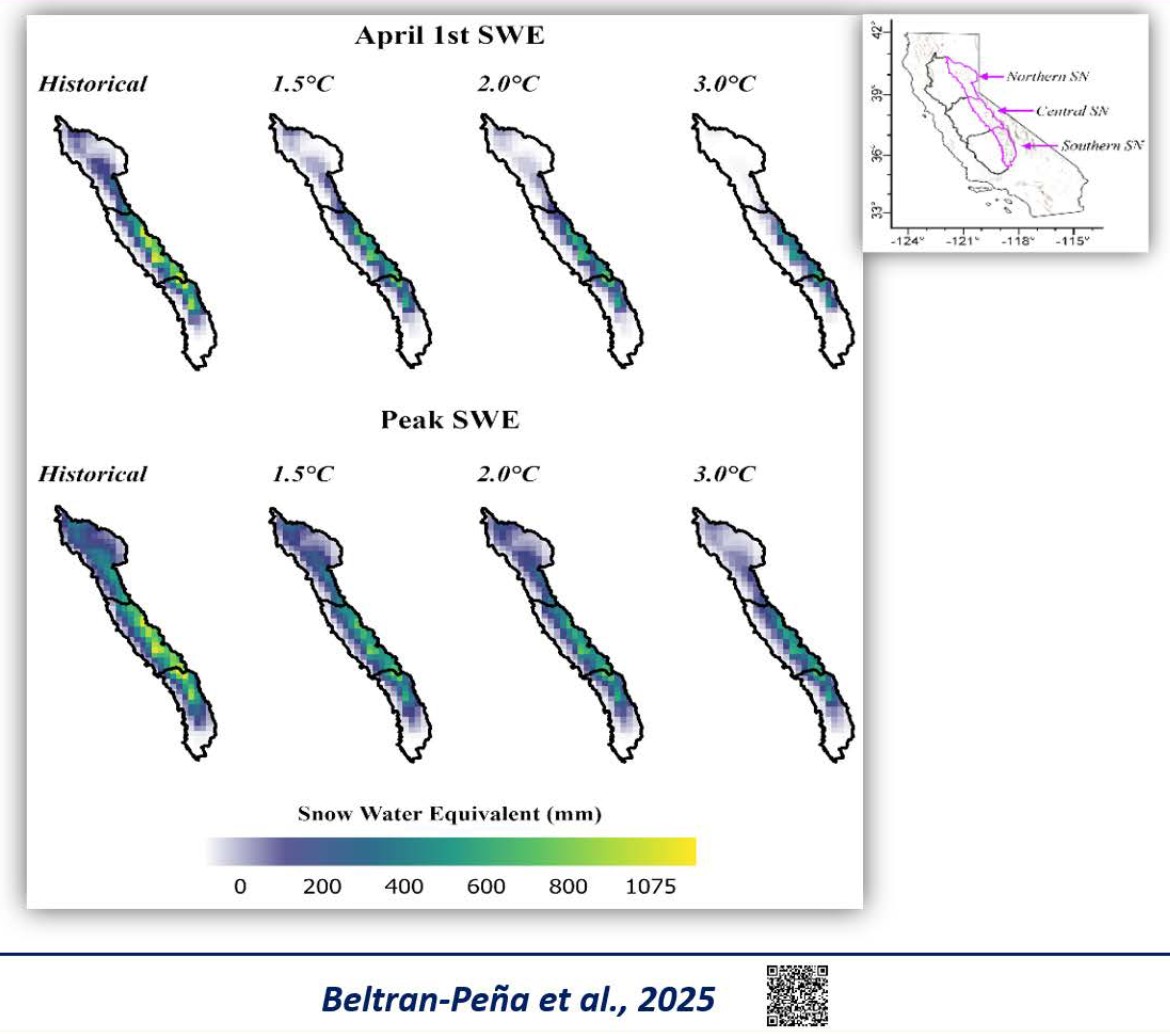
“Both April 1 and peak SWE volumes declined substantially, as well as the fraction of snow-covered area, said Dr. Areidy Beltran-Peña. “The higher elevations retain most of that snowpack, so although annual precipitation in the Sierra Nevada is projected to increase, the fraction of precipitation falling as snow decreases from the model’s historical 58% to 33% under three degree warmer climate. This represents a major shift from a snow-dominated to a rain-dominated hydroclimate in California.”
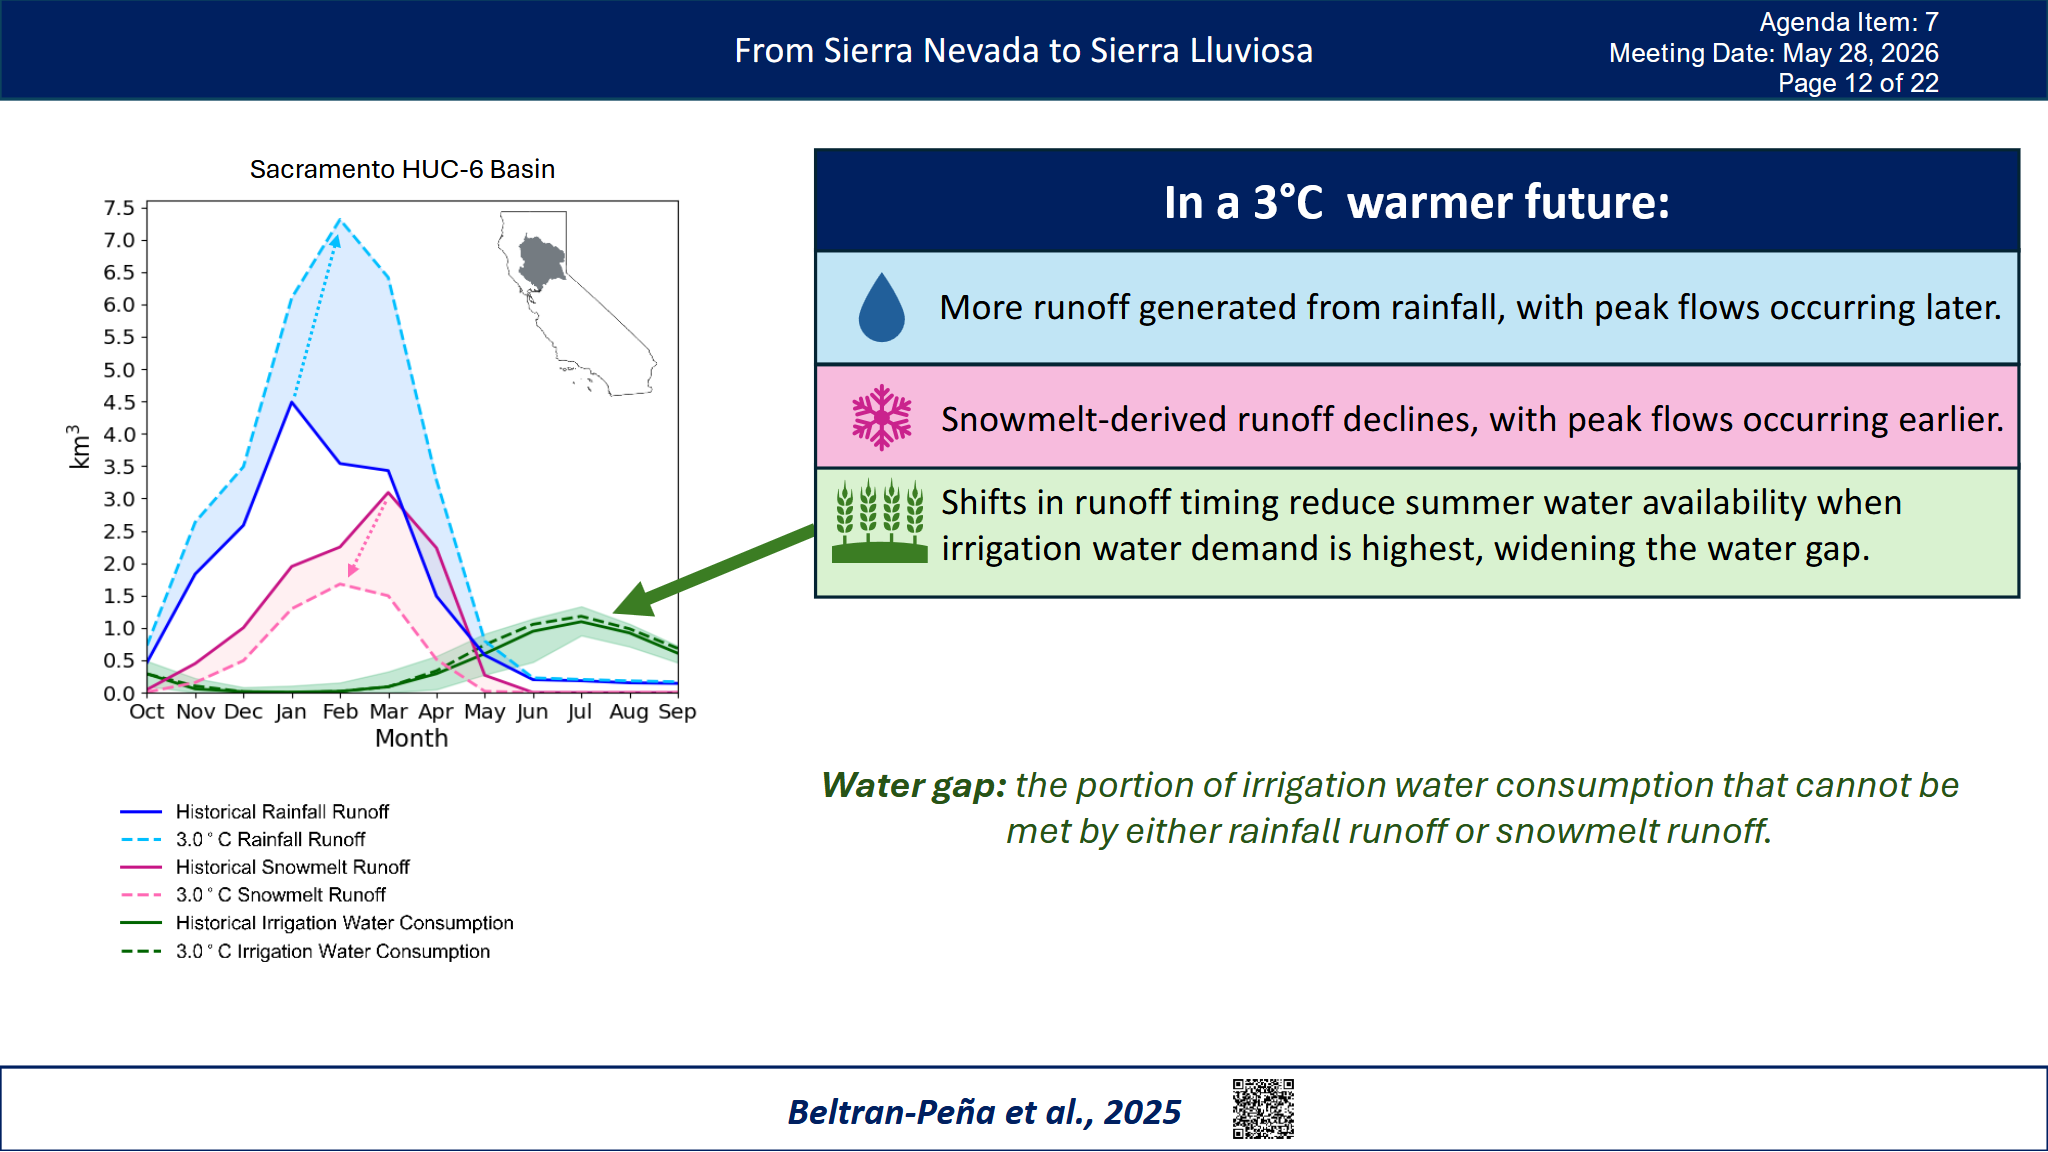
The researchers partitioned the snow melt and rainfall components of runoff from the basin-scale total runoff. The graphic shows the Sacramento Basin; the solid blue line represents historical runoff for the water year. It shows that under a 3-degree warmer scenario, rainfall runoff increases sharply, with peak flows shifting later in the water year before declining quickly.
The pink line is the historical snow melt runoff, with the dashed pink line representing the snowmelt runoff under a 3 degree warmer climate. Here, the snowmelt-derived runoff declines with peak flows occurring earlier, and the snowmelt contribution to runoff stops a month earlier, so it becomes a rainfall dominated system.
“This is important, because in a combined snow and a rain dominated system, only a portion of the water is delivered as immediate runoff, while snowfall accumulates as snow into snowpack, acting as a natural reservoir, and then eventually water is released as snow melts and also percolates into the subsurface, whereas in a rainfall dominated system, a lot of most of the water availability occurs within days,” said Dr. Areidy Beltran-Peña.
The green area represents water demand and shows that despite the increased rainfall runoff, shifts in runoff reduce summer water availability when irrigation demand is highest. After accounting for environmental flow requirements, the researchers assessed how much monthly irrigation demand could be met by snowmelt and rainfall runoff. They defined the water gap as the share of irrigation demand that neither source could meet.
The study found that agricultural water gaps persist across all three basins because runoff and irrigation demand are poorly aligned in time. The Tulare Basin, which has the highest irrigation demand and the lowest precipitation and runoff, faces the largest overall water gap and the greatest number of gap months under a three-degree warming scenario, followed by the San Joaquin Basin. The Sacramento Basin has the smallest water gap and is least affected during the summer.
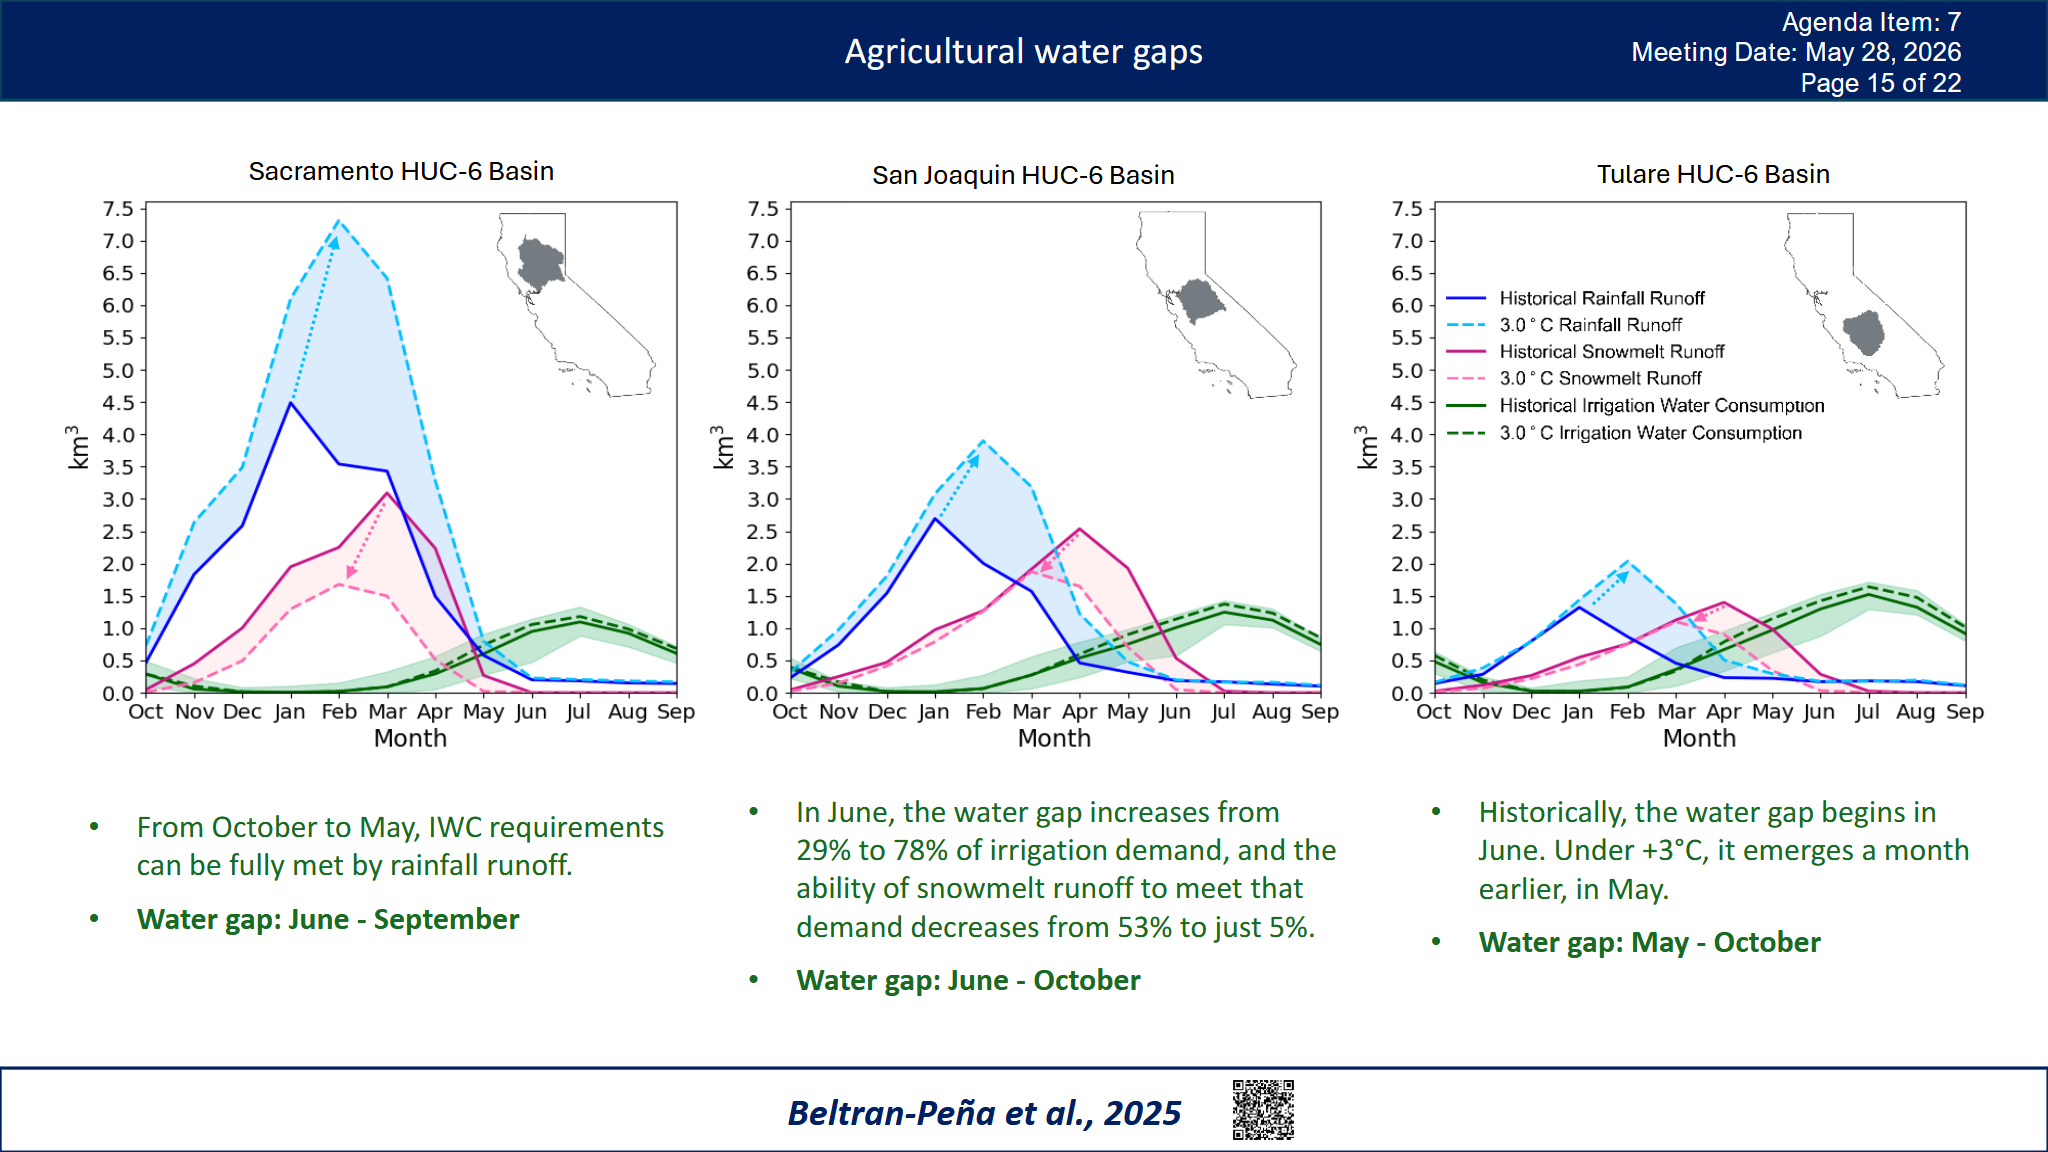
“In June, that water gap increases in the San Joaquin Basin from 29 to 78% of irrigation demand, and the ability of snow melt to meet that demand decreases from 53% to just 5% in the San Joaquin Basin,” she said. “In the Tulare Basin, historically, the water gap begins in June, and then under three degree warmer scenario, emerges a month earlier, in May.”
“So, overall, we assess the potential for rainfall, snowmelt runoff to meet irrigation water consumption in three critical agricultural basins in California under climate change, and our results show that surplus runoff from the wet season could help alleviate summer water shortages if stored effectively,” she said. “However, without enough water storage, a lot of that excess water will be lost as runoff and unable to compensate for snowmelt loss. So, meeting irrigation water demand, as well as demand for other uses, is the challenge of the state.”
The Growing Role of Extreme Snowmelt Events
California’s precipitation and snowpack vary sharply from year to year. In 2015, the state recorded its lowest snowpack in 500 years, with April 1 snow water equivalent at about 5% of normal. By contrast, 2023 brought one of the largest snowpacks on record. These wide swings between very low and very high snow years leave few truly average years, such as 2016.
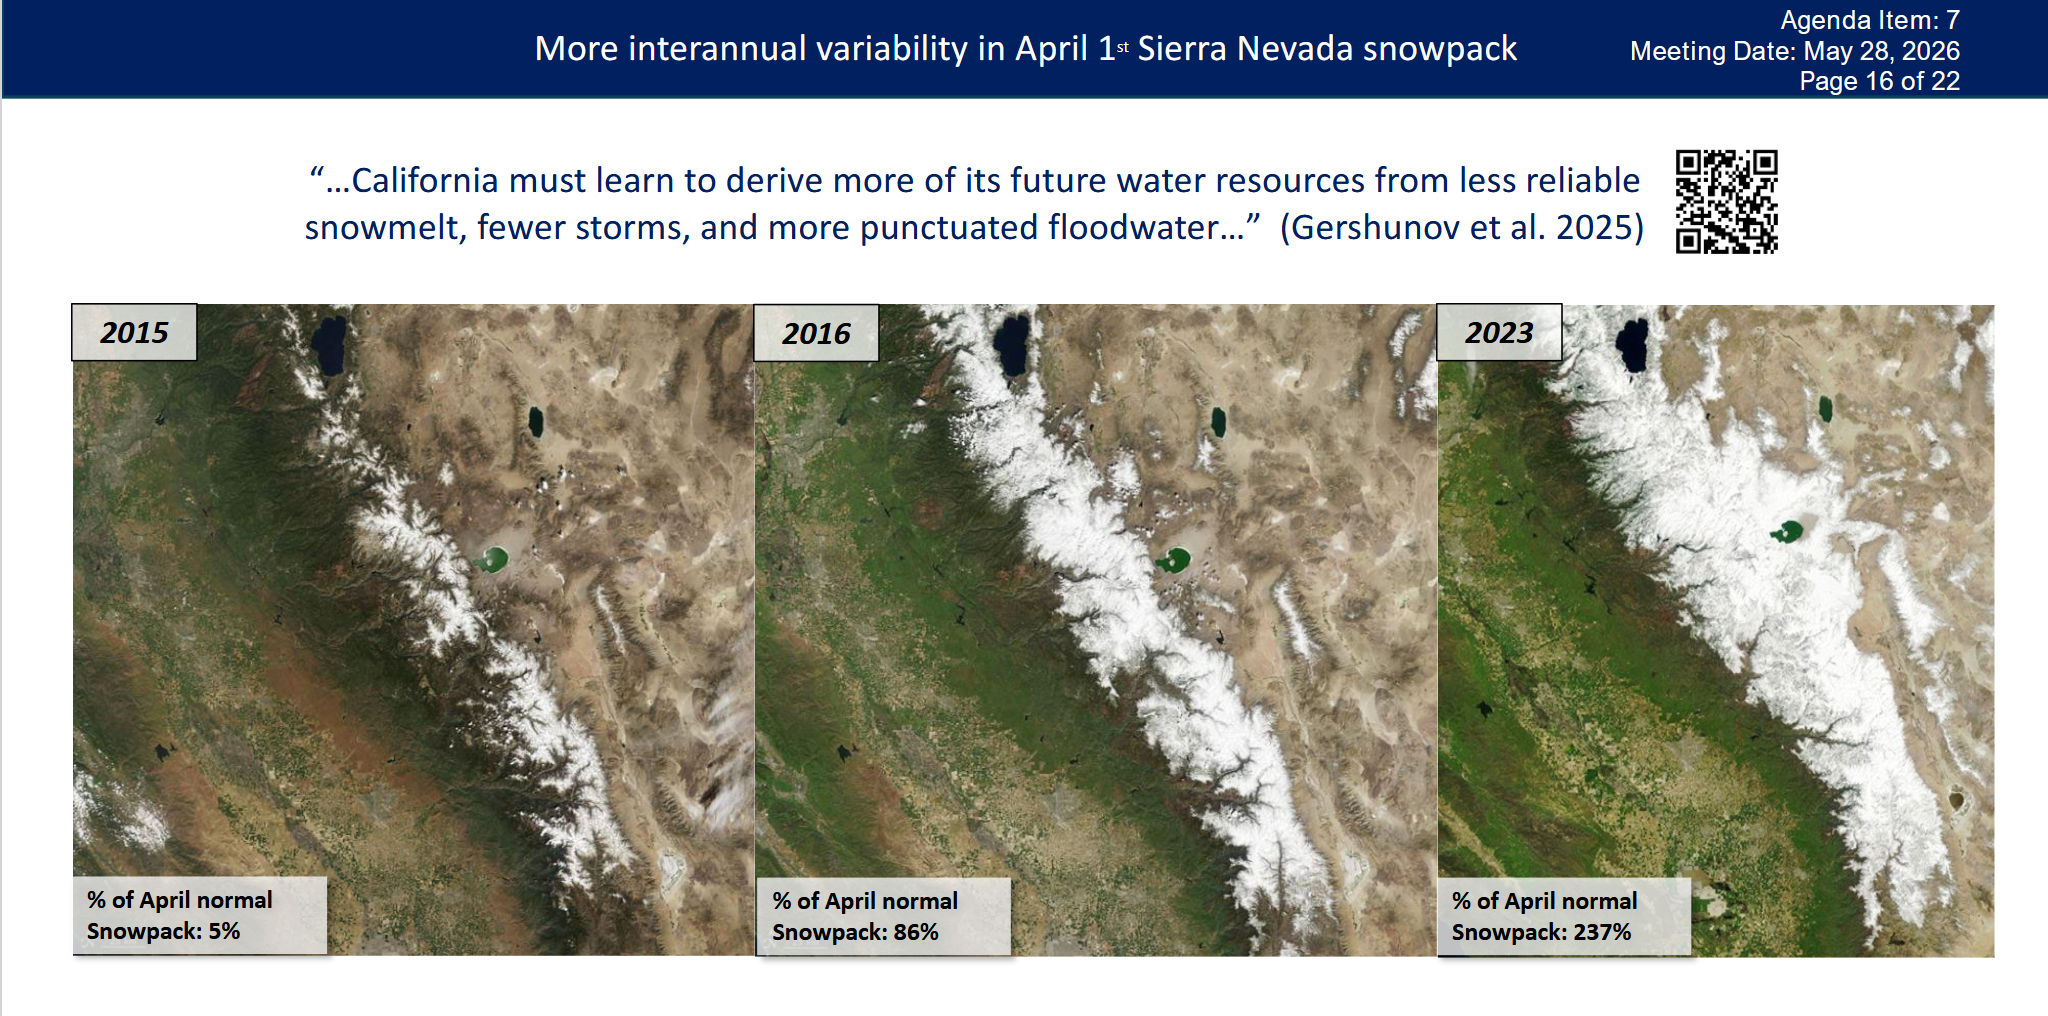
“In a warming world, we’ll rarely get that average year snow pack” said Dr. Rhoades. “It becomes more likely that we’ll get a low snow year like 2015 or 2026 than a high snow year, although they might still occur every so often. So, as described by Areidy in a recent Delta Stewardship Council funded study by Sasha Gershonoff and others, including myself, we should expect more inter annual variability and a less reliable snow pack in the coming decades represented by fewer storms and more punctuated flood water.’”
Extreme events, especially rain-on-snow events, are a major driver of California’s year-to-year snowpack variability. These events are often caused by atmospheric rivers, which account for 84% of insured flood losses in the western United States. Because atmospheric rivers are relatively warm storms, they can raise Sierra Nevada freezing levels unusually high, causing more precipitation to fall as rain instead of snow.
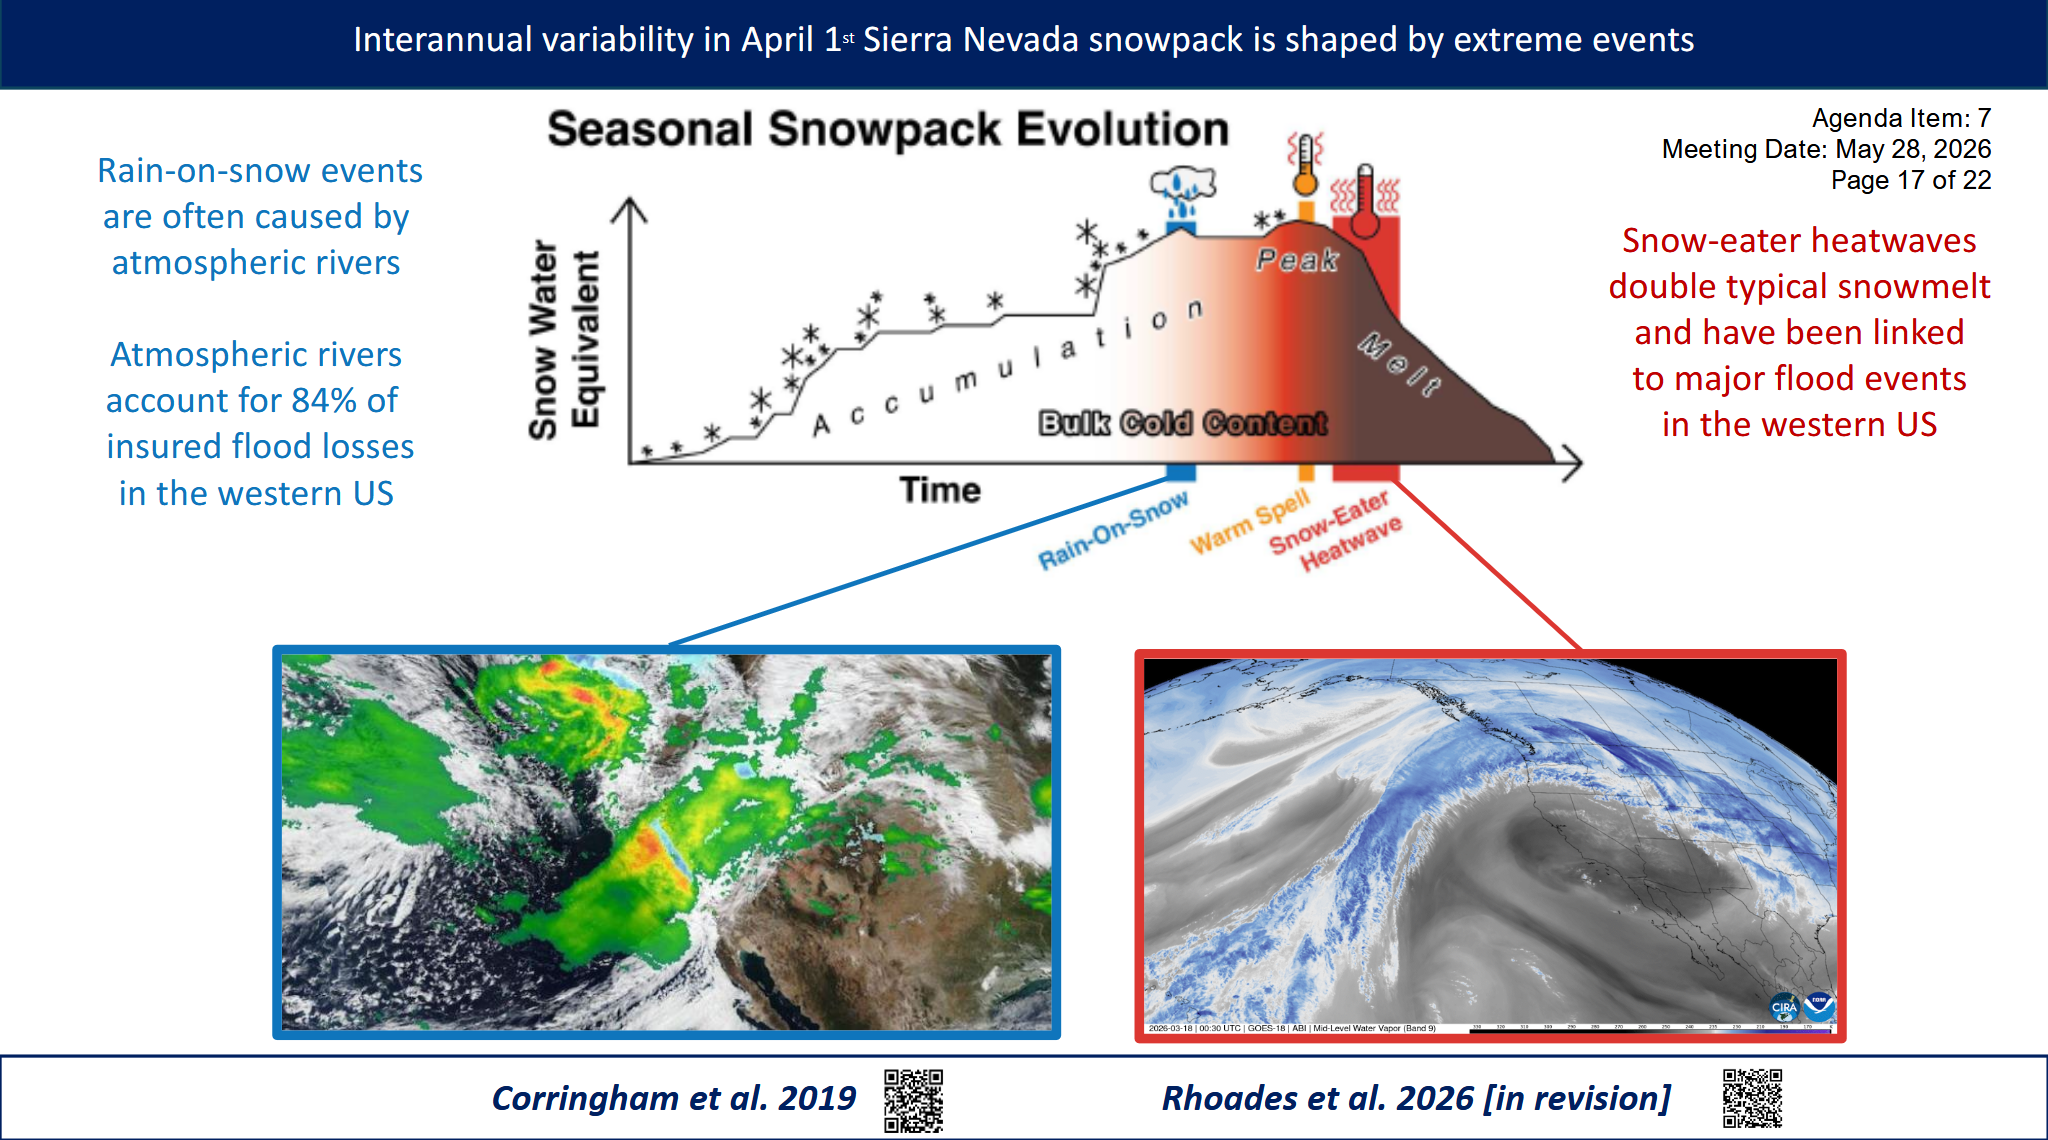
These storms also bring warm, windy conditions that erode snowpack cold content—the energy deficit that must be overcome before snow begins to melt. Although cold content is critical to understanding melt risk, it is not yet measured well. By stripping away that buffer, rain-on-snow events can trigger both heavy precipitation and rapid snowmelt.
“We do a lot of research on that at Lawrence Berkeley Lab, and one thing that’s notable is that already historically these events usually are already occurring at or near freezing when they’re producing their precipitation, so any increase by one degree, two degree, three degree above freezing will make that much more rain come out during these storms,” said Dr. Alan Rhoades.
Another type of extreme snowmelt event is the snow eater heatwave. Recent research shows that these events typically double average snowmelt rates across the western United States. Since the 1800s, they have become more common in early spring and summer and now affect a broader area. They can also occur alongside or in sequence with rain-on-snow events, compounding snowmelt impacts. A snow eater heatwave in March contributed to the roller-coaster conditions of water year 2026.
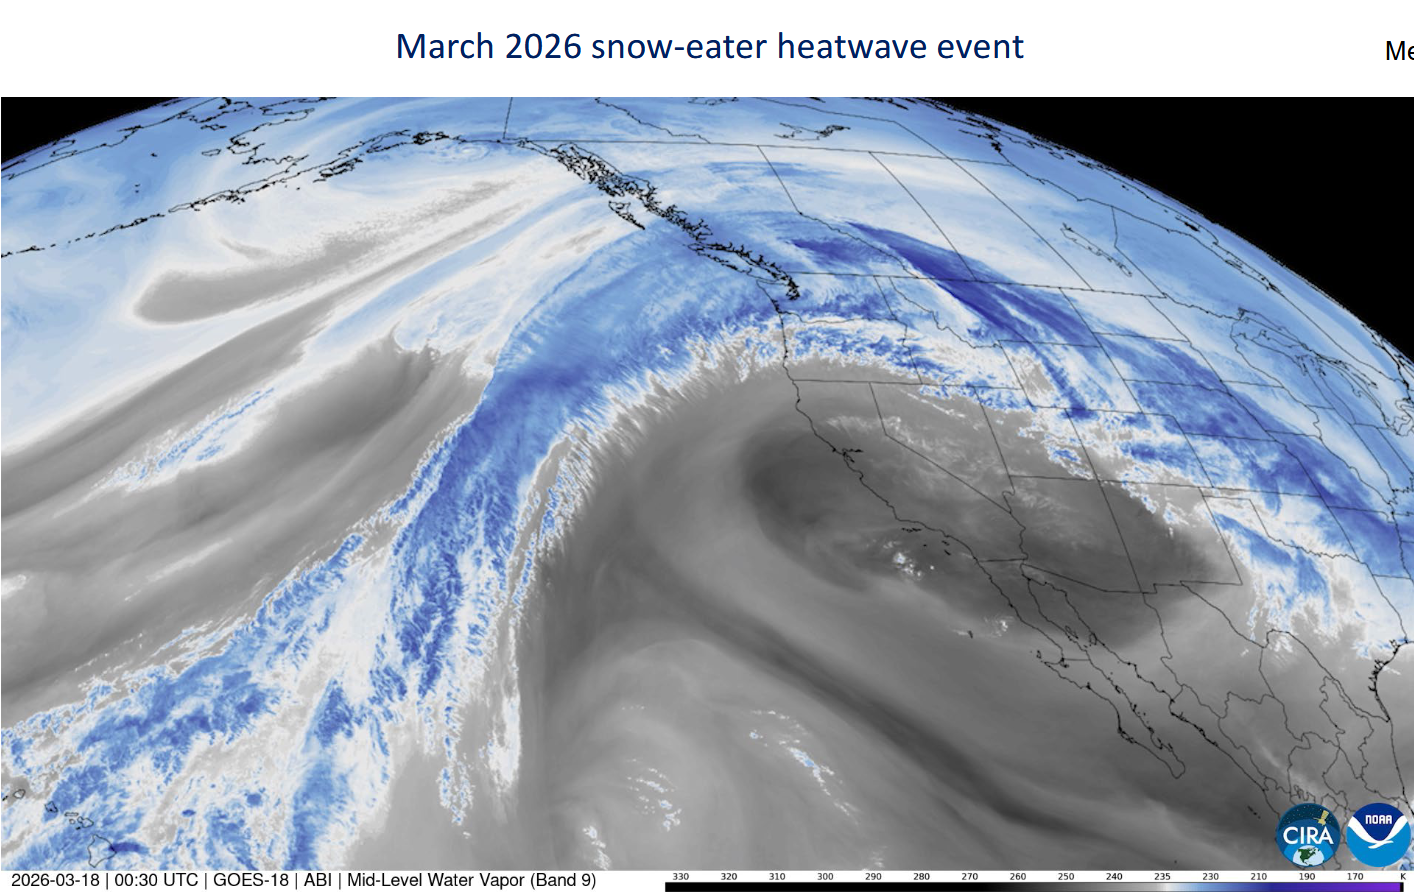 A NOAA satellite image from the Sierra in March 2026 shows a high-pressure ridge pushing moisture north into Canada. “The snow eater heatwave and the high pressure ridge diverted storm tracks northward at a time of year where we really need to start to continue to build snow pack,” said Dr. Rhoades. “These snow eater heatwaves create anomalously warm conditions that are above freezing, both in the day and the night, which is really important for the desiccation of cold content, so this undermines that cold content and can lead to rapid snowmelt or sublimation.”
Researchers are still studying where the water goes during these events—whether it becomes snowmelt or sublimates directly into the atmosphere and is effectively lost. If this happens near peak snowpack around April 1, it could weaken assumptions water managers use to allocate supplies to agricultural users later in the year.
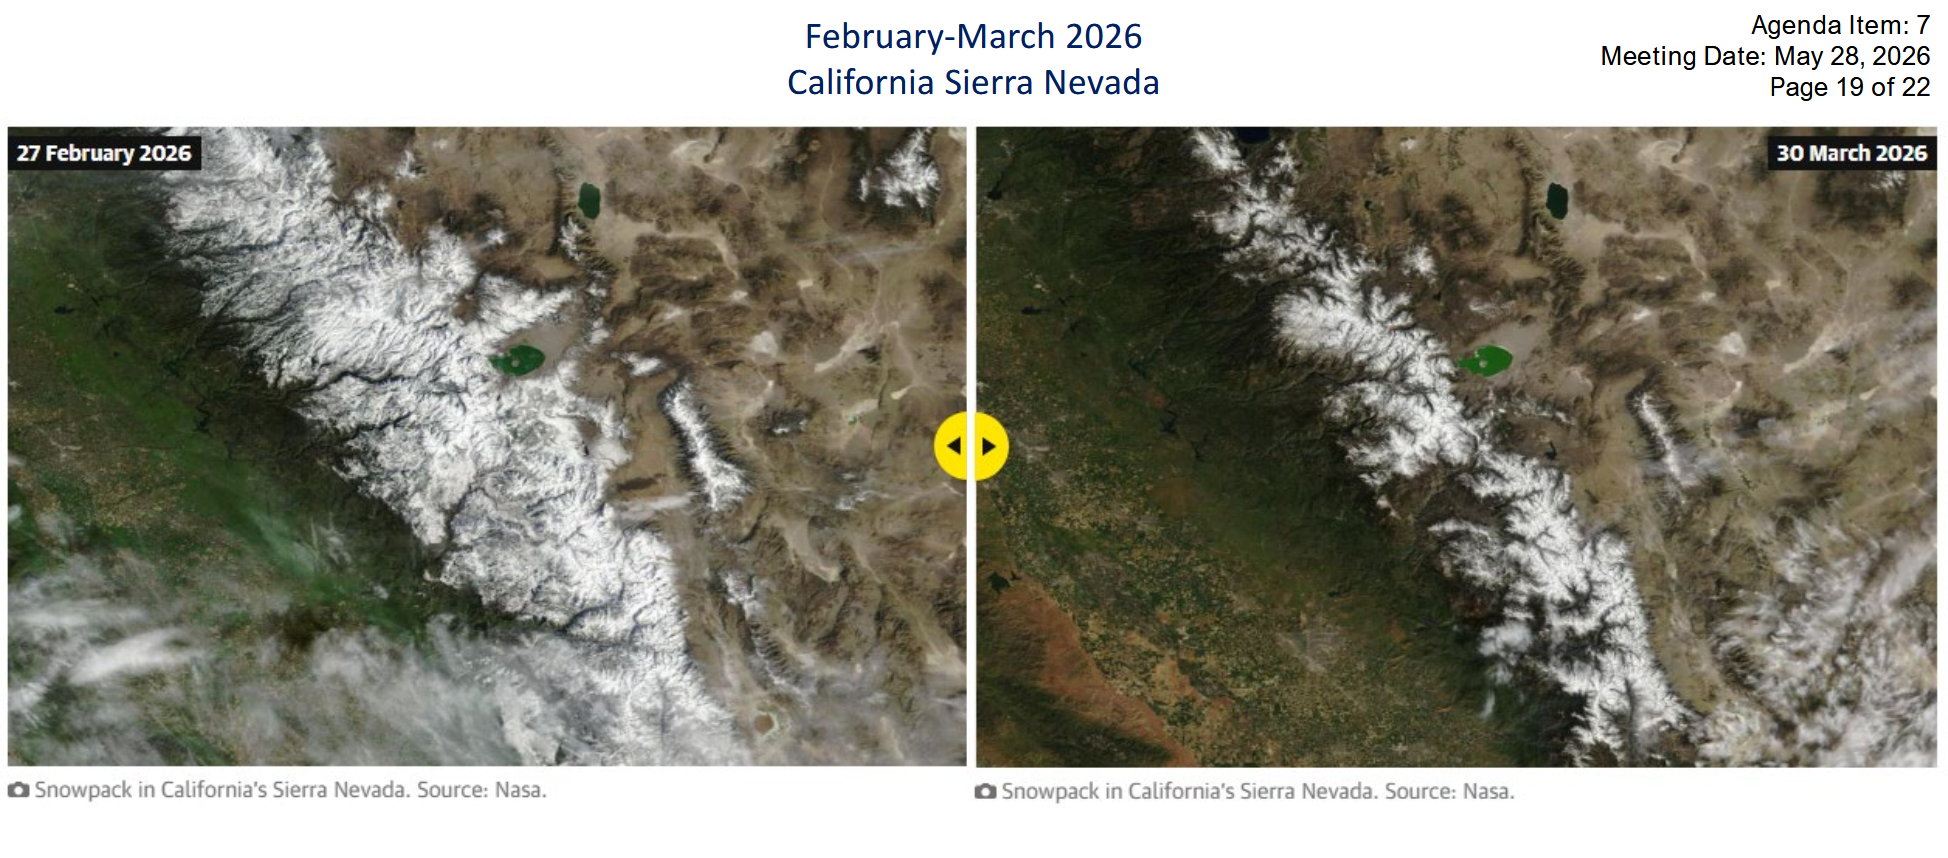
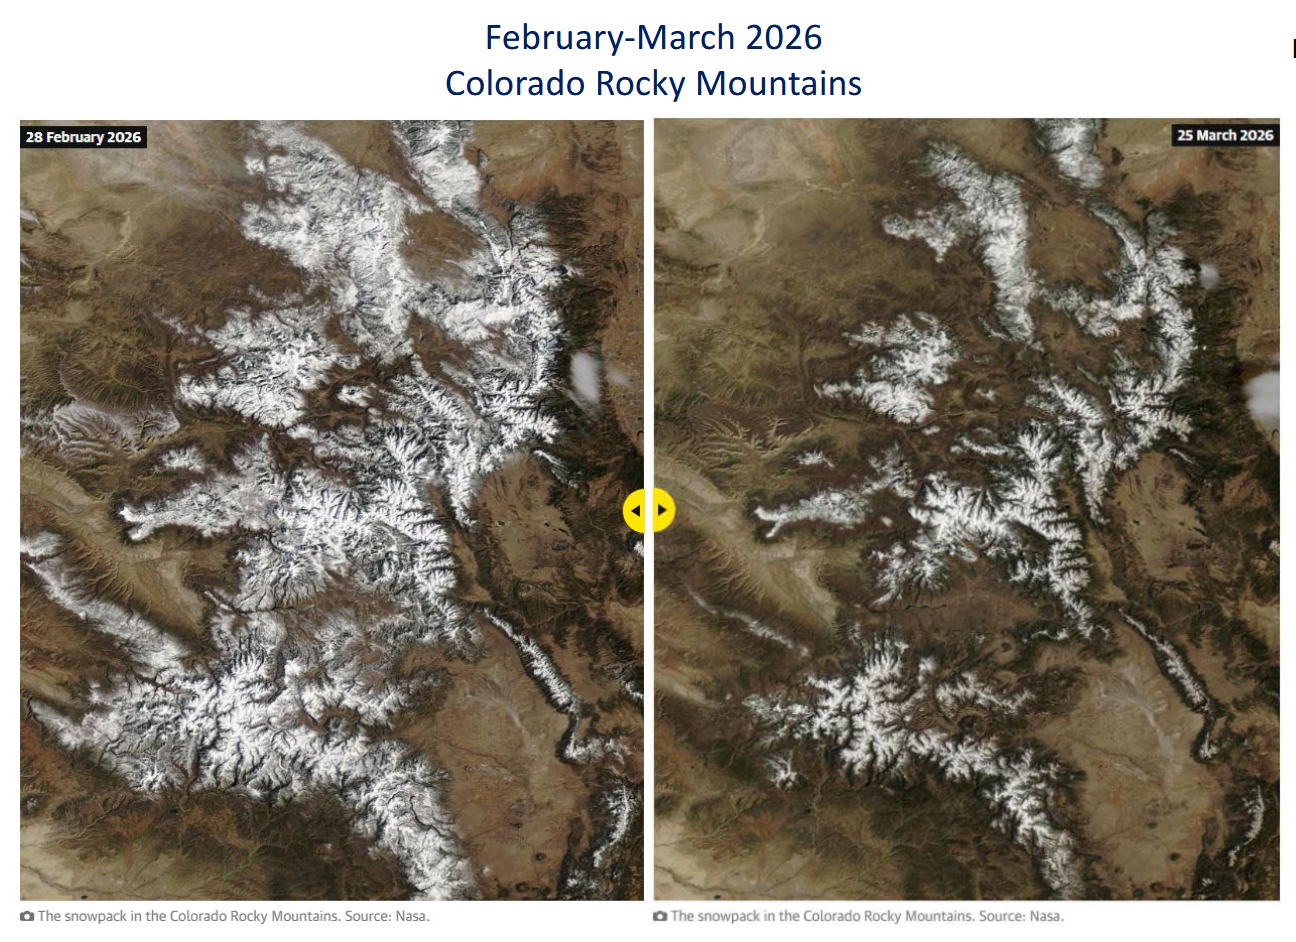
The slides below show the sharp March decline in Sierra snowpack. Snow water equivalent fell from about 66% of average on February 27 to just 18% of normal by March 30. In the Rocky Mountains, snowpack dropped to 24% of average—less than half the previous record low for that date—deepening concerns for the 40 million people who depend on Colorado River water.
“We really think that water year 2026 could be an object lesson for the next few decades, because we essentially had at or near normal precipitation, but we had extremely anomalously high temperatures, as shown in this plot provided by the California Water Watch,” said Dr. Rhoades.
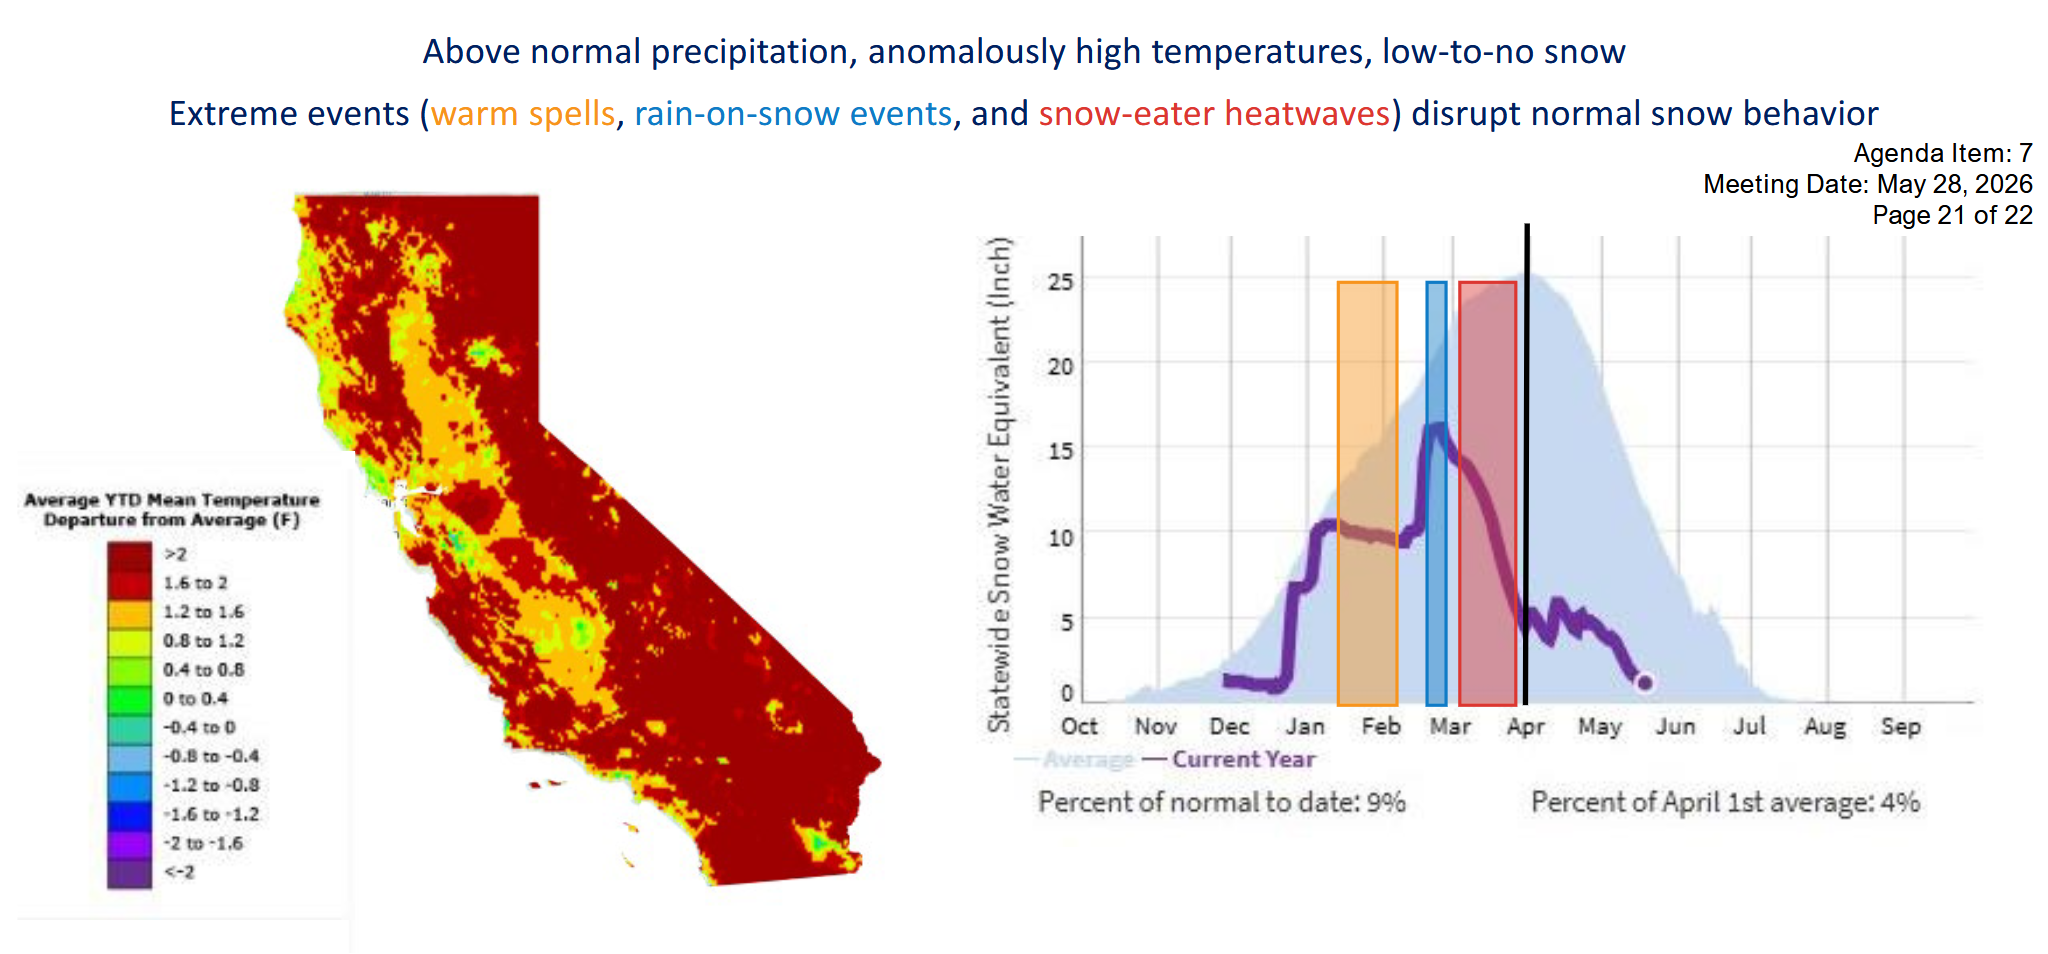
“Throughout much of this year in the Sierra Nevada, we were greater than two degrees Fahrenheit above normal, and as a result, we had lower snow than we had hoped. We had several of these extreme events in sequence of one another. We had a warm spell that prevented the buildup of snow between January and February, followed by a rain on snow event in late February, followed by the snow eater heatwave event that then quickly depleted the snowpack to about 18% of normal.”
Building Resilience to Snowmelt Extremes
California must shift from a 20th-century water management mindset to a 21st-century one by anticipating snowmelt extremes rather than reacting to them. Dr. Rhoades offered five recommendations:
- Maintain and expand monitoring networks and remote sensing: Strengthen current monitoring systems and expand efforts to measure cold content, including snowpack temperature and density, to better track how close snow is to melting. Additional investment in remote sensing and airborne LiDAR could also reduce uncertainty about snow water volume and likely reservoir inflows later in the year.
- More nimbly manage infrastructure: Use forecast-informed reservoir operations and improved weather forecasting to manage infrastructure more flexibly. In a warming climate, water allocation decisions may need to shift from seasonal or monthly planning to a week-by-week approach.
- Bank water more regularly in the ground: Expand groundwater storage through managed aquifer recharge, including AgMAR and FloodMAR.
- More efficiently utilize water and generate “new” water: Expand supplies and reduce pressure on snow-dependent sources through strategies such as direct potable reuse and desalination.
- Foster more partnerships between academia and management: Build closer collaboration to support tabletop exercises, improve planning, and strengthen resilience to future flood extremes.
Planning for the future under a new climate reality
The study findings point to a clear conclusion: California can no longer rely on historical snowpack patterns to manage water. As warming shrinks snowpack, shifts runoff earlier, and intensifies extreme melt events, the gap between water supply and peak irrigation demand is likely to grow. Dr. Lisamarie Windham-Myers said science is the best tool for anticipating these changes and guiding long-term investments. She highlighted two plans that aim to help the state prepare for a less predictable water future.
The 2028 update to the California Water Plan is exploring ways to secure an additional 9 million acre-feet of water to help close this projected gap. It is designed to test how the water system performs under multiple climate scenarios and to prepare for uncertainty through adaptive management, allowing actions to change as conditions and knowledge evolve. The plan reflects a growing recognition that average years are increasingly rare, making it less useful to rely on middle-of-the-road assumptions.
The updated 2026 community-developed Delta Science Plan is intended to catalyze collective action and strengthen the role of science in decision-making. Its water management focus includes improving modeling, monitoring, and decision-support tools. It also recommends horizon scanning to identify early signs of emerging threats, such as changing snow behavior, invasive species, or new contaminants. Better monitoring can detect those signals early, while modeling can help assess their potential impacts and identify opportunities to act before systems reach tipping points.
PAPER: Future implications of enhanced hydroclimate variability and reduced snowpack on California’s water resources
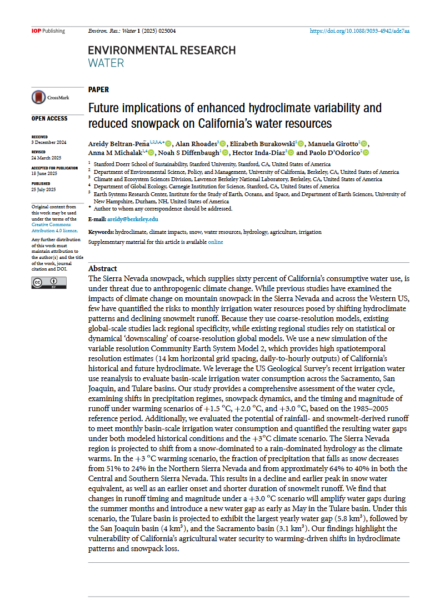 Abstract: The Sierra Nevada snowpack, which supplies sixty percent of California’s consumptive water use, is under threat due to anthropogenic climate change. While previous studies have examined the impacts of climate change on mountain snowpack in the Sierra Nevada and across the Western US, few have quantified the risks to monthly irrigation water resources posed by shifting hydroclimate patterns and declining snowmelt runoff. Because they use coarse-resolution models, existing global-scale studies lack regional specificity, while existing regional studies rely on statistical or dynamical ‘downscaling’ of coarse-resolution global models. We use a new simulation of the variable resolution Community Earth System Model 2, which provides high spatiotemporal resolution estimates (14 km horizontal grid spacing, daily-to-hourly outputs) of California’s historical and future hydroclimate. We leverage the US Geological Survey’s recent irrigation water use reanalysis to evaluate basin-scale irrigation water consumption across the Sacramento, San Joaquin, and Tulare basins. Our study provides a comprehensive assessment of the water cycle, examining shifts in precipitation regimes, snowpack dynamics, and the timing and magnitude of runoff under warming scenarios of +1.5 °C, +2.0 °C, and +3.0 °C, based on the 1985–2005 reference period. Additionally, we evaluated the potential of rainfall- and snowmelt-derived runoff to meet monthly basin-scale irrigation water consumption and quantified the resulting water gaps under both modeled historical conditions and the +3°C climate scenario. The Sierra Nevada region is projected to shift from a snow-dominated to a rain-dominated hydrology as the climate warms. In the +3 °C warming scenario, the fraction of precipitation that falls as snow decreases from 51% to 24% in the Northern Sierra Nevada and from approximately 64% to 40% in both the Central and Southern Sierra Nevada. This results in a decline and earlier peak in snow water equivalent, as well as an earlier onset and shorter duration of snowmelt runoff. We find that changes in runoff timing and magnitude under a +3.0 °C scenario will amplify water gaps during the summer months and introduce a new water gap as early as May in the Tulare basin. Under this scenario, the Tulare basin is projected to exhibit the largest yearly water gap (5.8 km3), followed by the San Joaquin basin (4 km3), and the Sacramento basin (3.1 km3). Our findings highlight the vulnerability of California’s agricultural water security to warming-driven shifts in hydroclimate patterns and snowpack loss.
READ THE PAPER: Future implications of enhanced hydroclimate variability and reduced snowpack on California’s water resources

