
At its May 20 meeting, the California Water Commission received an update on implementation of the Sustainable Groundwater Management Act, with DWR officials outlining new groundwater reporting, emerging work on groundwater trading and a renewed push to address land subsidence. The presentation was given by DWR Technical Assistance Section Lead Stephen Springhorn, Senior Engineering Geologist Andrew Morgan and Shane Edmunds, lead of the Groundwater Sustainability Plan Review Section. The briefing covered the 2025 update to California’s Groundwater Bulletin 118, the spring semi-annual groundwater conditions report, groundwater trading and the department’s new subsidence best management practice.
“It can’t be overstated, groundwater’s importance to California’s water portfolio and to the communities, ecosystems, industries, and agriculture that rely on groundwater, so we’re trying to meet that importance with more timely, accessible, and relevant information on groundwater, so it can be fed into water planning in the state,” said Mr. Springhorn.
DWR shares groundwater information through three main channels: California’s Groundwater Bulletin 118, a comprehensive report on the state’s groundwater basins; a semi-annual conditions update issued each spring and fall; and the California’s Groundwater Live website, which is updated daily.
Bulletin 118
 California’s groundwater basins, formed over geologic time, have changed little physically, but the state’s understanding of them has evolved significantly as groundwater use has expanded and more data has become available. That evolving understanding is reflected in the latest update to Bulletin 118, the Department’s long-running inventory of the state’s groundwater basins. Published at varying intervals over the past 70 years, the report defines basin boundaries and compiles groundwater information for each of California’s 10 hydrologic regions. It serves as a statewide assessment of groundwater occurrence and conditions, and helps guide decisions on protection, use, monitoring and management.
The latest edition, released in spring 2025, brings together a broad range of groundwater topics and examines how groundwater fits into California’s overall water system. The report includes chapters on progress toward sustainable groundwater management, the state’s natural and built groundwater infrastructure, water use and extraction, groundwater budgets, monitoring, statewide and regional conditions, and an extensive appendix focused on land subsidence.
DWR also released a highlights document summarizing the report’s key findings and recommendations, alongside the full seven-chapter report and its appendices.
Semi-Annual Groundwater Conditions Report
 DWR recently released the spring semi-annual groundwater conditions report, drawing on annual reporting from more than 250 groundwater sustainability agencies, along with information from adjudicated areas and alternative groundwater sustainability plan entities. Together, the data cover about 130 basins statewide, representing roughly 95% of groundwater pumping in California’s basins.
The Spring 2026 report covers SGMA implementation and projects and management actions, groundwater levels, extraction and changes in storage, managed recharge, subsidence, well infrastructure — including new domestic and agricultural wells and dry wells — and groundwater monitoring efforts.
“The top line message is that the near-term conditions are positive to stable, but long-term deficits persist,” said Mr. Springhorn.
Groundwater’s Interconnection to California’s Water System
California’s water system relies on three linked storage sources—snowpack, reservoirs, and groundwater—that respond to precipitation on different timelines. Snowpack stores water first and releases it through spring and early summer, reservoirs capture and manage that runoff during dry months, and groundwater recharges more slowly over longer periods as the largest long-term reserve.
“It’s really one system that we need to be more effective in dynamically managing that,” Mr. Springhorn said.
The graphic below illustrates that relationship, showing the relative storage capacity of snowpack, reservoirs and groundwater. California, he said, receives an average of about 15 million acre-feet of runoff from melting snowpack each spring, while reservoirs hold about 40 million acre-feet of storage. Groundwater basins, he noted, offer far greater potential storage capacity.
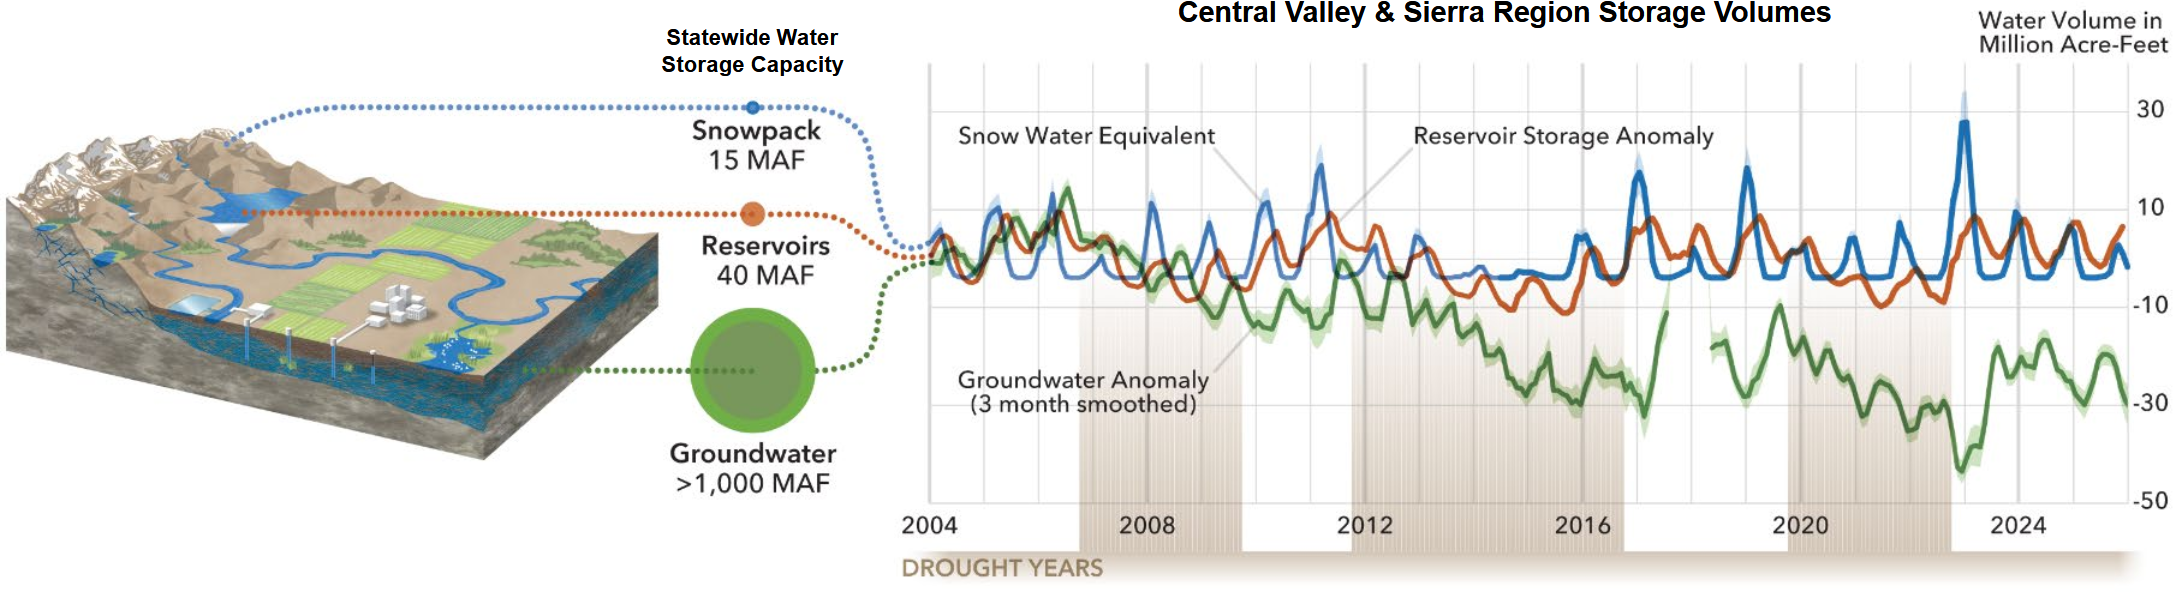
The graphic illustrates that snowpack typically peaks before reservoirs, which in turn peak before groundwater. “That’s showing the connectedness of water moving through the watershed above and below ground, but you can also see the critical, important nature of groundwater, that when we don’t have water on the surface, groundwater basins are our drought buffer,” he said.
Mr. Springhorn also pointed to sharp increases in groundwater pumping during the 2012–2016 and 2020–2022 droughts, followed by some rebound in the wetter years of 2017 and 2023, and noted those recoveries have not fully erased long-term losses. “What we have seen is that with each depletion of groundwater over the drought periods, there’s a persistent deficit, so we haven’t come all the way back,” he said. “So that’s really where we’re trying to work with locals to see what is that sustainable mix of projects and actions, recharge everything else to really have sustainability going forward.”
Mr. Springhorn noted that GSAs have nearly 2,000 projects and management actions listed in their adopted groundwater sustainability plans. “About 1000 of those projects are water supply or recharge focused,” he said. “If you add all those up, it’s over 4 million acre feet of potential, so we’re trying to support our local agencies in turning that potential and those possible projects into implemented projects.”
Report Highlights
Mr. Springhorn then highlighted several findings from the report. The latest data from groundwater sustainability agencies for Water Year 2025 shows groundwater pumping at just under 13 million acre-feet. That was slightly higher than the previous water year and well above 2023, which was exceptionally wet. GSAs also reported 1.1 million acre-feet of managed aquifer recharge. While that was below the wetter years of 2024 and 2023, Mr. Springhorn said it still reflects a broader trend of local agencies working to put water back into the ground.
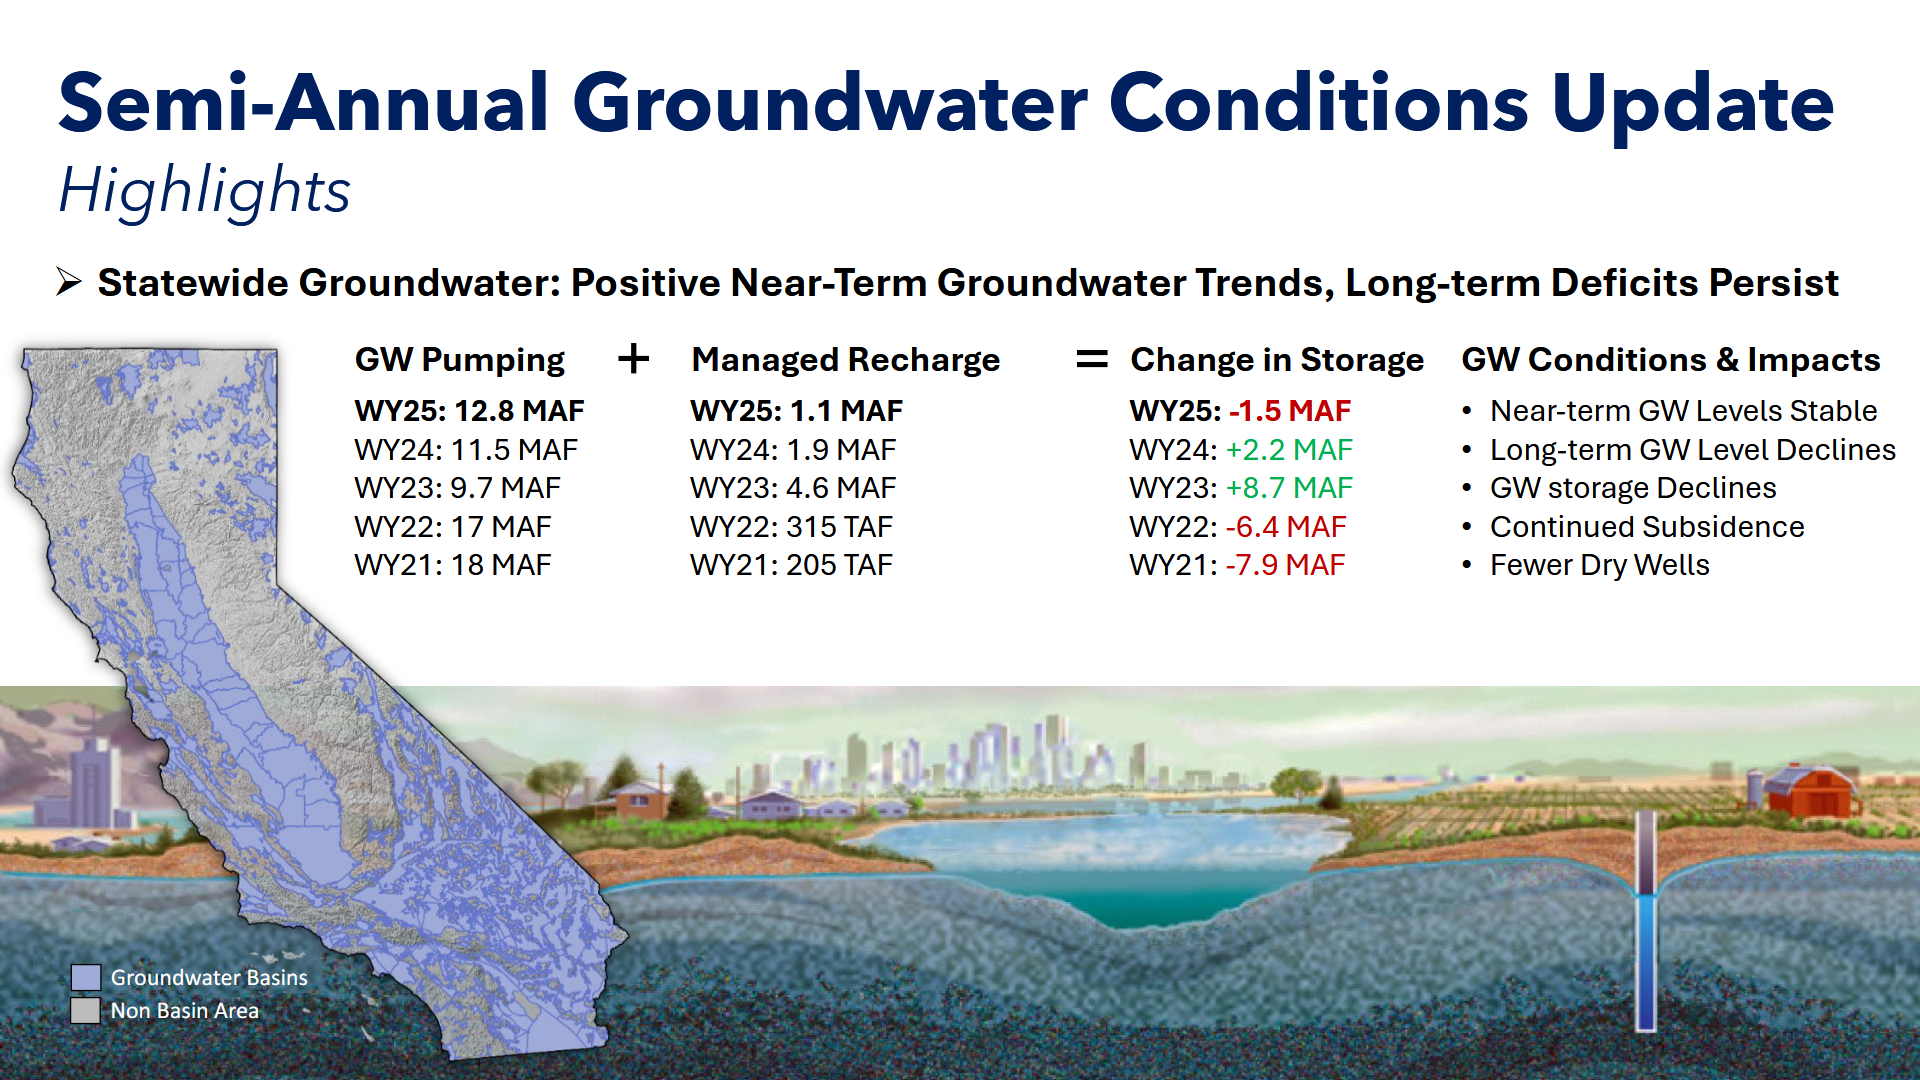
The report also showed a negative change in storage of about 1.5 million acre-feet — the first such decline in three years. “Near term groundwater levels in the last year are pretty stable,” Mr. Springhorn said. “Long term, we still see some groundwater level declines over longer periods of time. Groundwater storage declines, as you can see, we’ve had them in the past, and we had them again over the past water year. That has led to some continued subsidence, but there still are fewer dry wells than the highs of the last drought.”
Extractions are shown on the lower left. Most groundwater pumping occurs in the Central Valley, with about 83% of statewide groundwater extractions concentrated in the San Joaquin Valley.
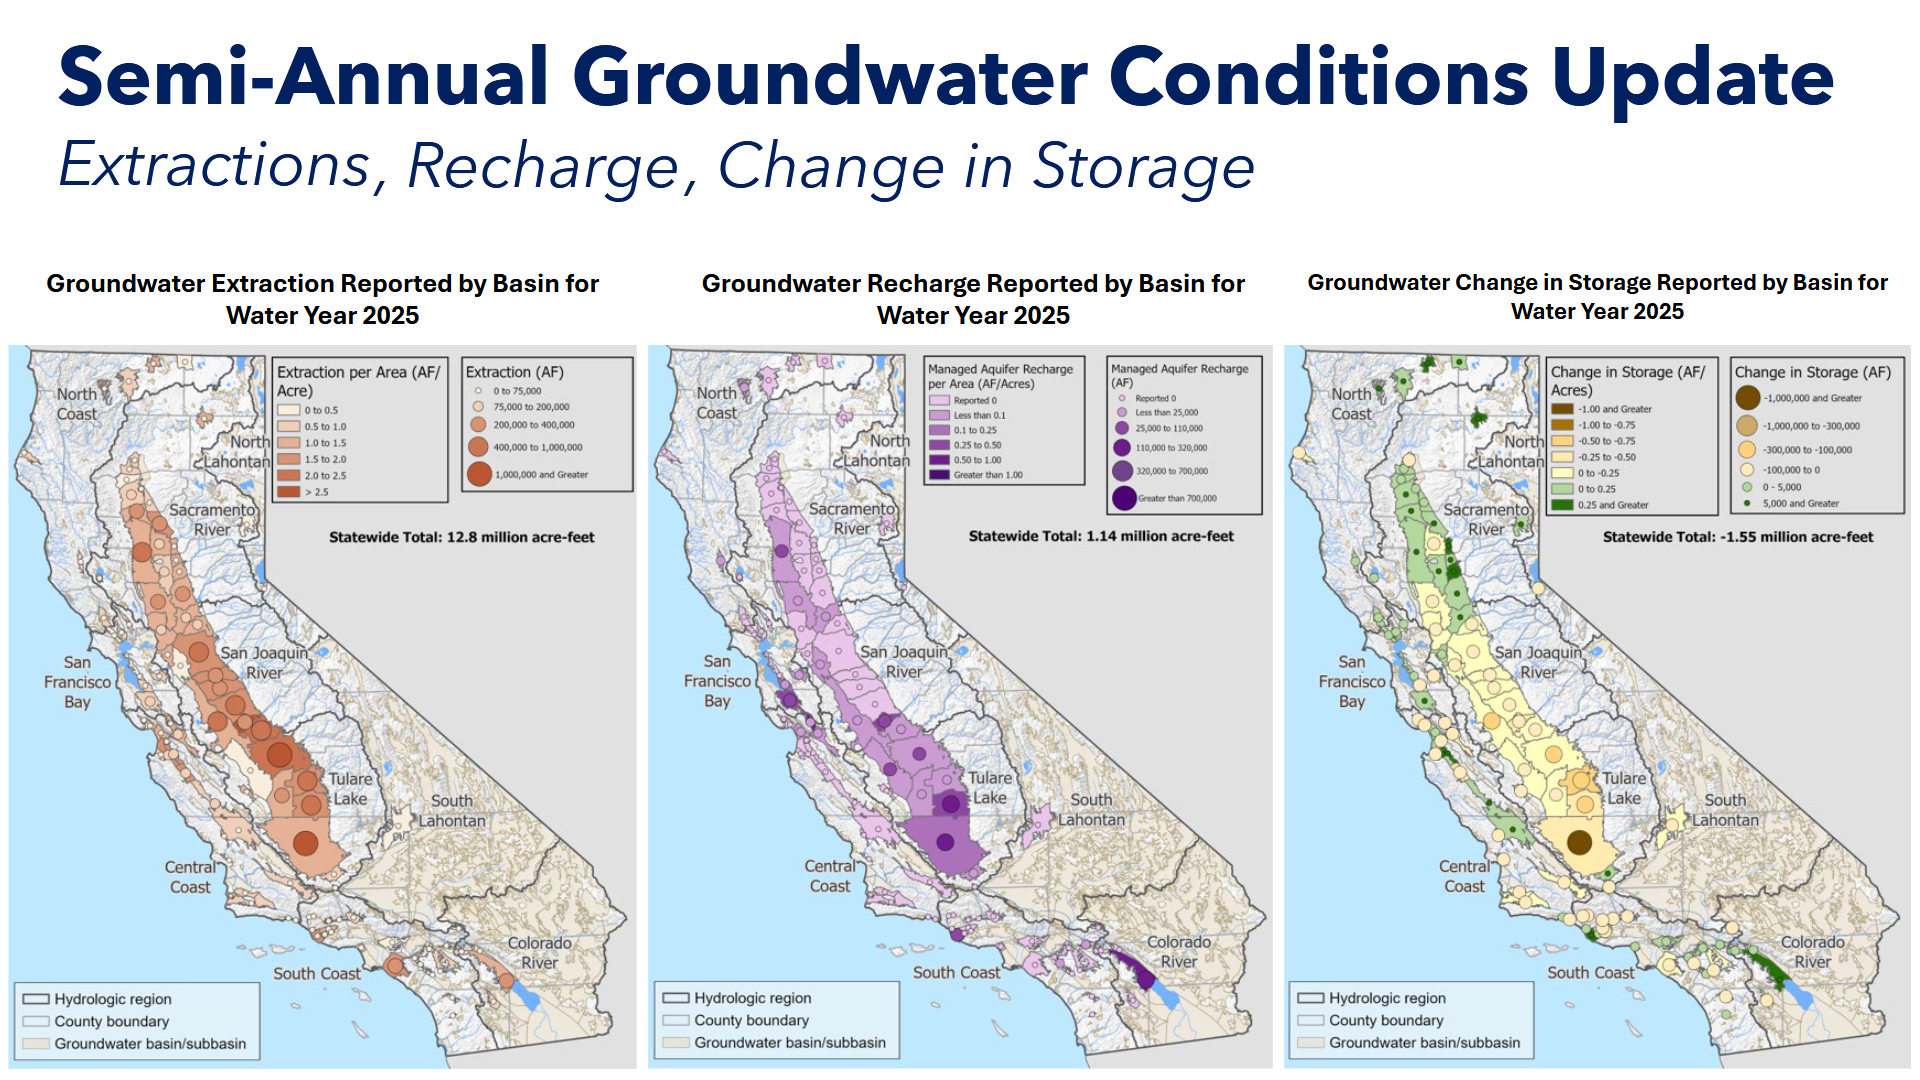
The middle graphic above shows the distribution of recharge across the state. Mr. Springhorn identified four main recharge areas this year: Santa Clara-Silicon Valley, the San Joaquin Valley, the Oxnard Plain-Ventura area and the Coachella Valley. He also said recharge efforts are increasing in the Sacramento Valley. The third graphic above shows changes in storage. Groundwater storage increased north of the Delta, but storage declined in the San Joaquin Valley, a shift Mr. Springhorn said was closely tied to water allocations.
The next set of graphics shows groundwater levels over one year, 10 years and 20 years. Mr. Springhorn said the data comes from about 9,000 wells monitored by DWR, groundwater sustainability agencies and the U.S. Geological Survey. In the graphics, green dots indicate groundwater-level increases of five to 25 feet or more, yellow indicates stable conditions, and orange and red show areas where groundwater levels are still declining. The graphic on the lower left shows changes from fall 2024 to fall 2025 and indicates that about 71% of wells were in stable condition in the near term.
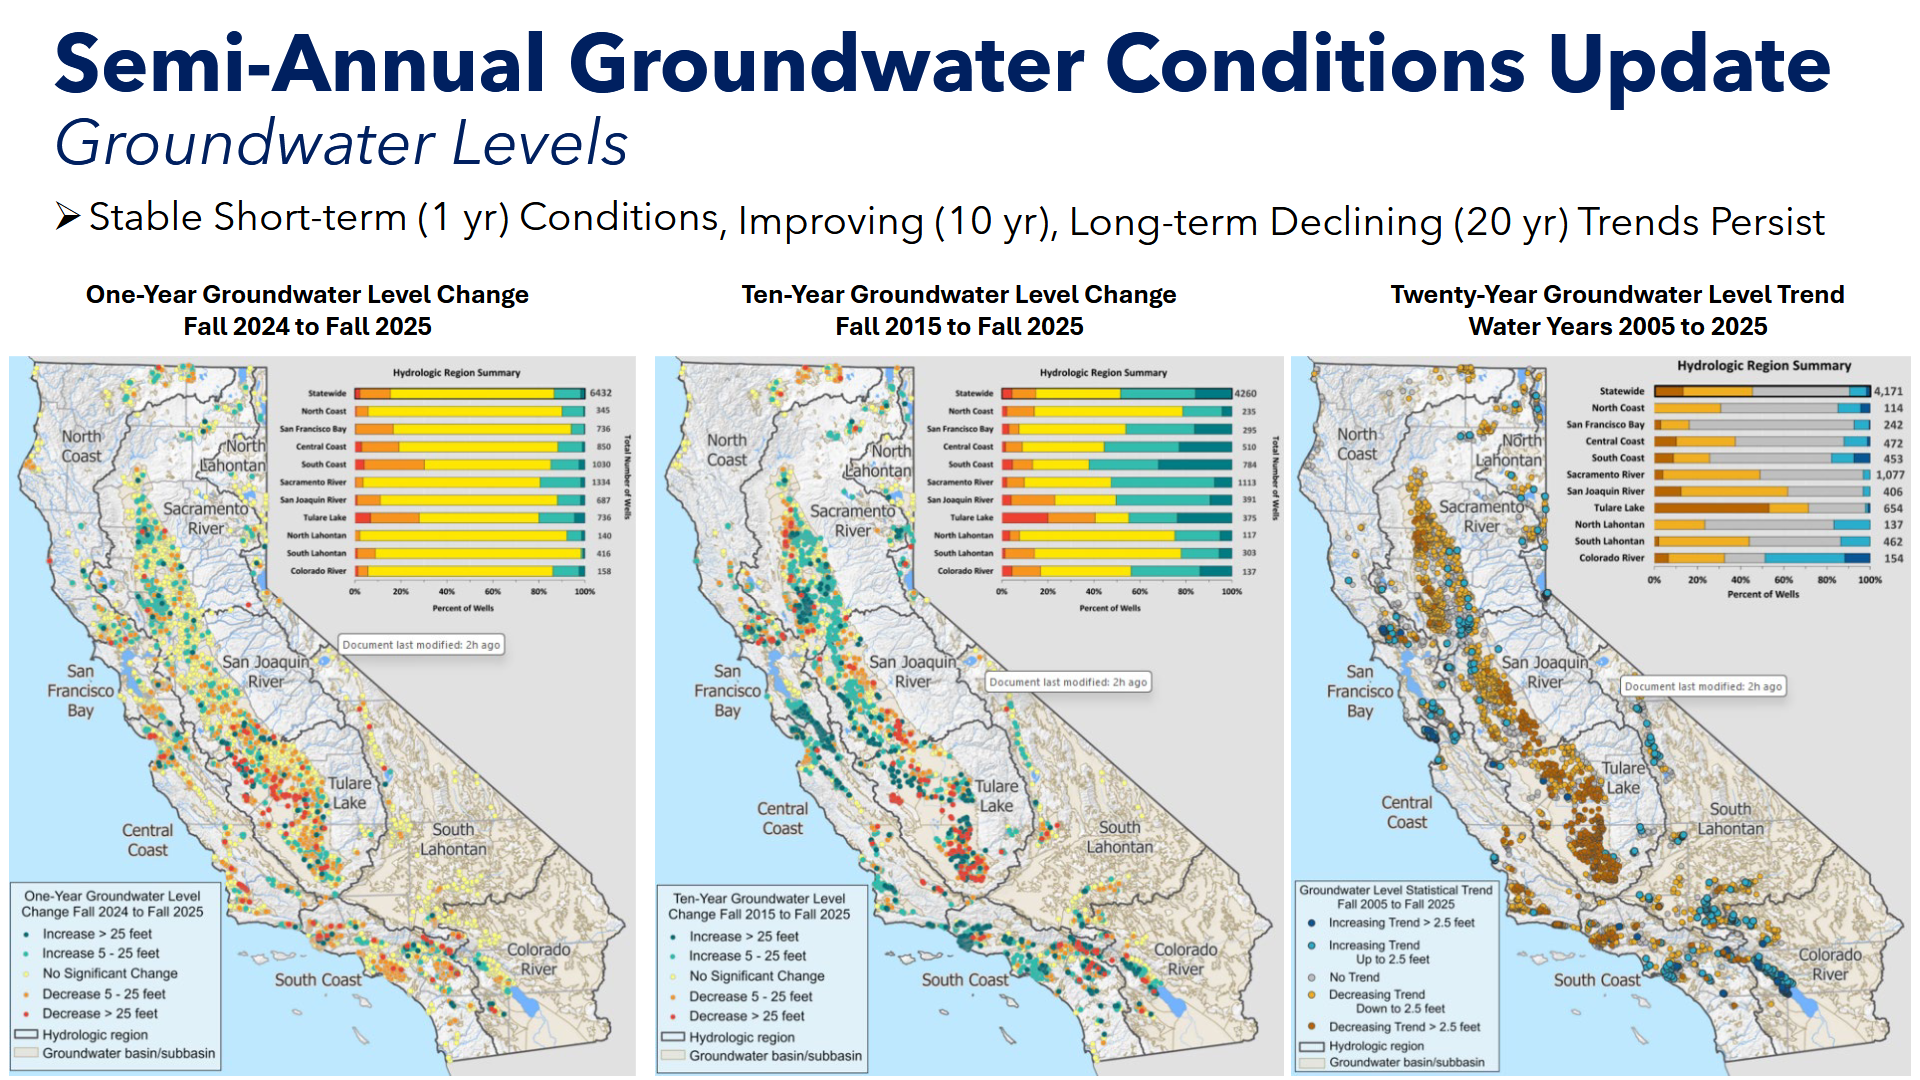
The middle graphic above compares conditions from fall 2015 to fall 2025 and shows more wells with gains than declines. “That’s an important timeline, because the fall of 2015 was when we were in the depths of that severe drought, that’s when SGMA came along, and so we have a decade of SGMA implementation, as well as Mother Nature providing quite a few wet years in that time frame, so it’s a combination of both.” Over the past 20 years, however, Mr. Springhorn said the data still shows a persistent long-term decline. In that graphic on the upper right, the orange and red areas represent groundwater declines of about 2.5 feet per year.
The slide shows a series of maps tracking subsidence conditions over the past 10 years, with two of the most prominent areas centered near Corcoran and El Nido in the San Joaquin Valley. Warmer colors indicate higher rates of subsidence over time. Blue shows limited uplift in wet years, while green, yellow and red indicate subsidence, with some areas reaching rates of up to one foot per year during severe droughts. The map on the left shows subsidence rates from October 2024 to October 2025.
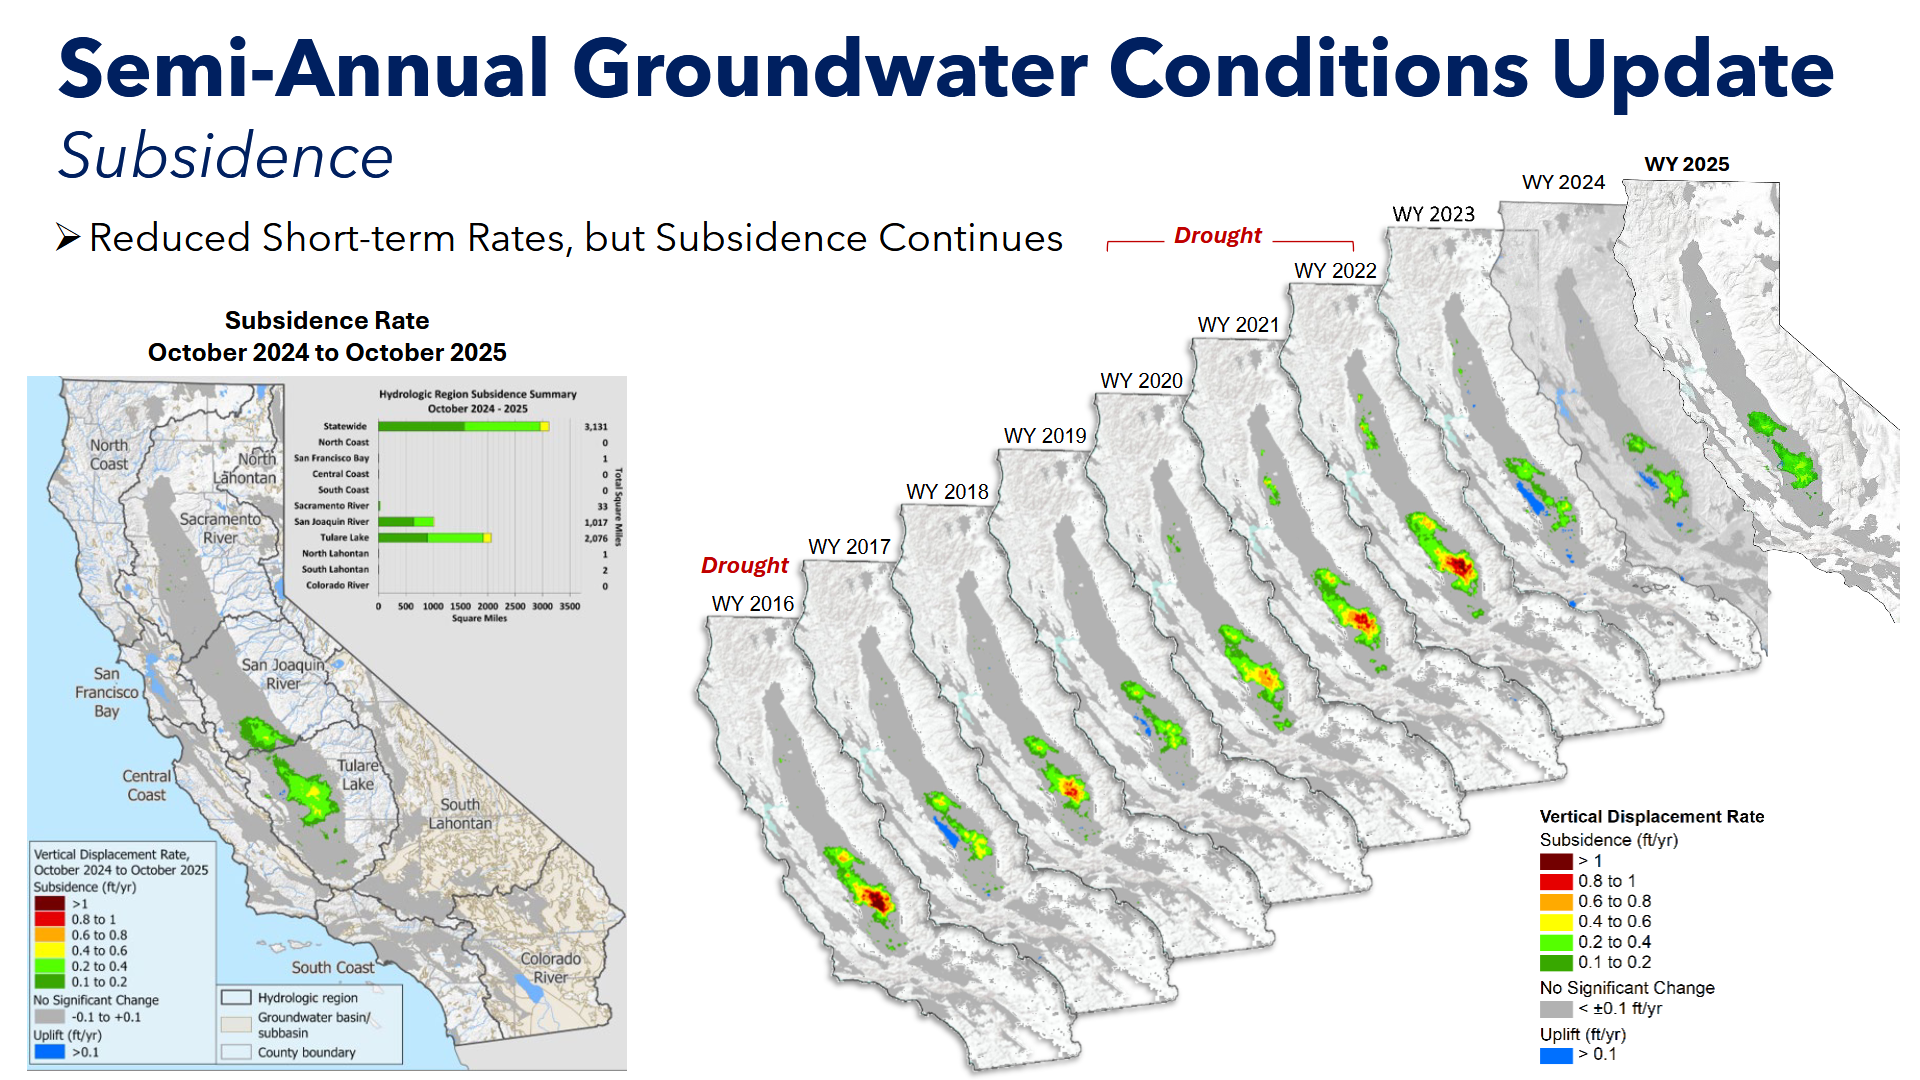
“You can see there’s less blue on the map, so less rebound, a little bit more subsidence occurring because it was a bit drier year, lower allocations south of Delta,” said Mr. Springhorn.
The state expanded dry-well monitoring, outreach and response efforts during the last two droughts, and the current report shows relatively few reported dry wells compared with the peaks seen during those drought periods. That, he said, also reflects a growing role for local agencies and groundwater sustainability agencies in addressing dry wells as part of groundwater sustainability plan implementation.
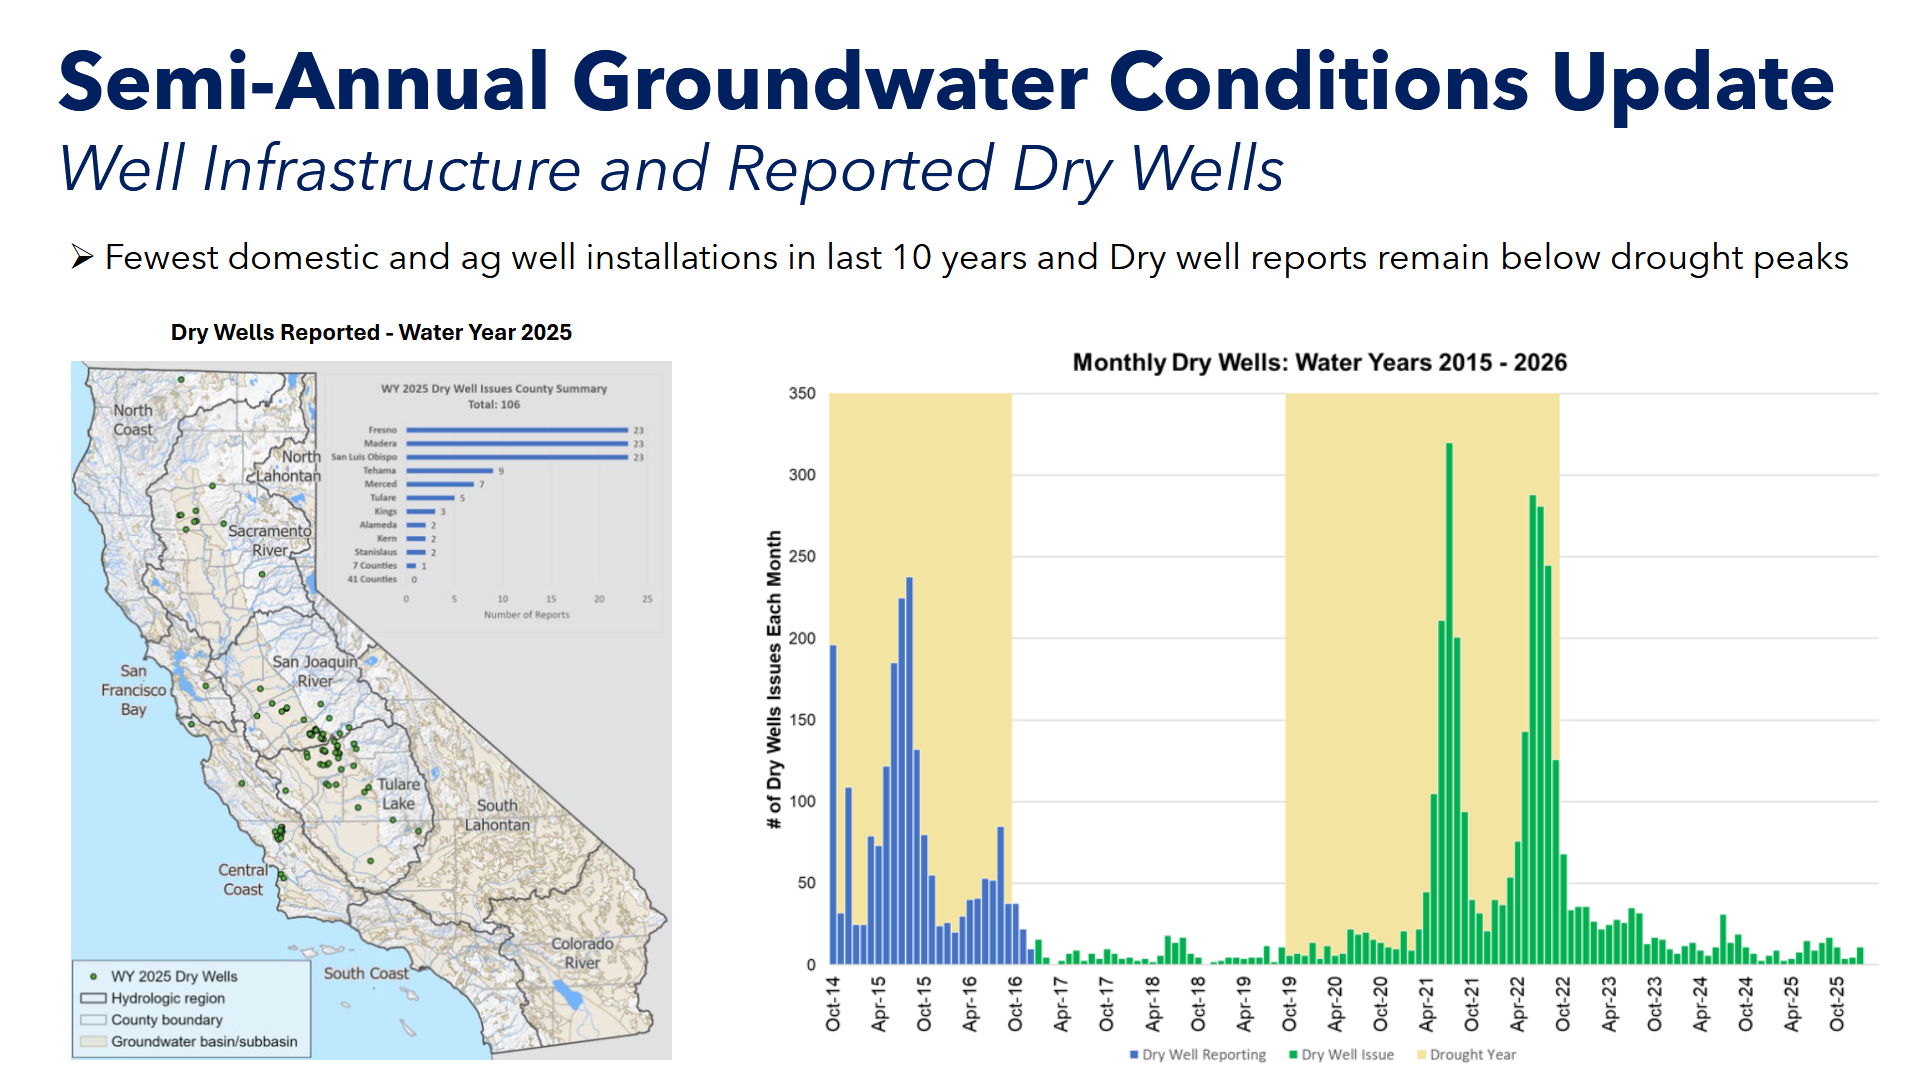
“During the last two droughts, there was a large emphasis on state support for dry wells, and now we’re seeing more groundwater sustainability agencies and their community members working together to address these local impacts as they happen,” said Mr. Springhorn.
Groundwater Trading Workplan
 Senior Engineering Geologist Andrew Morgan then briefed the commission on the groundwater trading workplan which was developed jointly by DWR, the State Water Resources Control Board, the California Department of Fish and Wildlife and the California Department of Food and Agriculture in response to Action 3.6 of the Water Resilience Portfolio. That directive called on the four agencies to support local groundwater trading efforts while protecting vulnerable users.
The workplan was also shaped by the commission’s 2022 white paper, A State Role in Supporting Groundwater Trading with Safeguards for Vulnerable Users: Findings and Next Steps. It outlines an initial framework and possible state actions to support well-managed groundwater trading, with an emphasis on transparency and safeguards for vulnerable parties in early-stage markets.
Mr. Morgan said SGMA and its regulations do not explicitly address groundwater trading, but the practice generally falls under projects and management actions, or PMAs. Groundwater sustainability agencies are required to describe in their plans the PMAs they intend to use to reach sustainability goals. Groundwater trading, he said, is one optional tool — and not one every GSA will pursue. He said the workplan also addresses additional regulatory implications of groundwater trading under SGMA.
As an early step, the state is tracking emerging markets through the new PMA module on the SGMA data portal, which provides a centralized database of projects and management actions statewide. Mr. Morgan said the system currently lists nearly 2,000 PMAs. Mr. Morgan said groundwater sustainability agencies were required this April to include status updates on projects and management actions in their annual reports. Using that latest data, he said, the figure identifies areas where groundwater trading could emerge in the future.
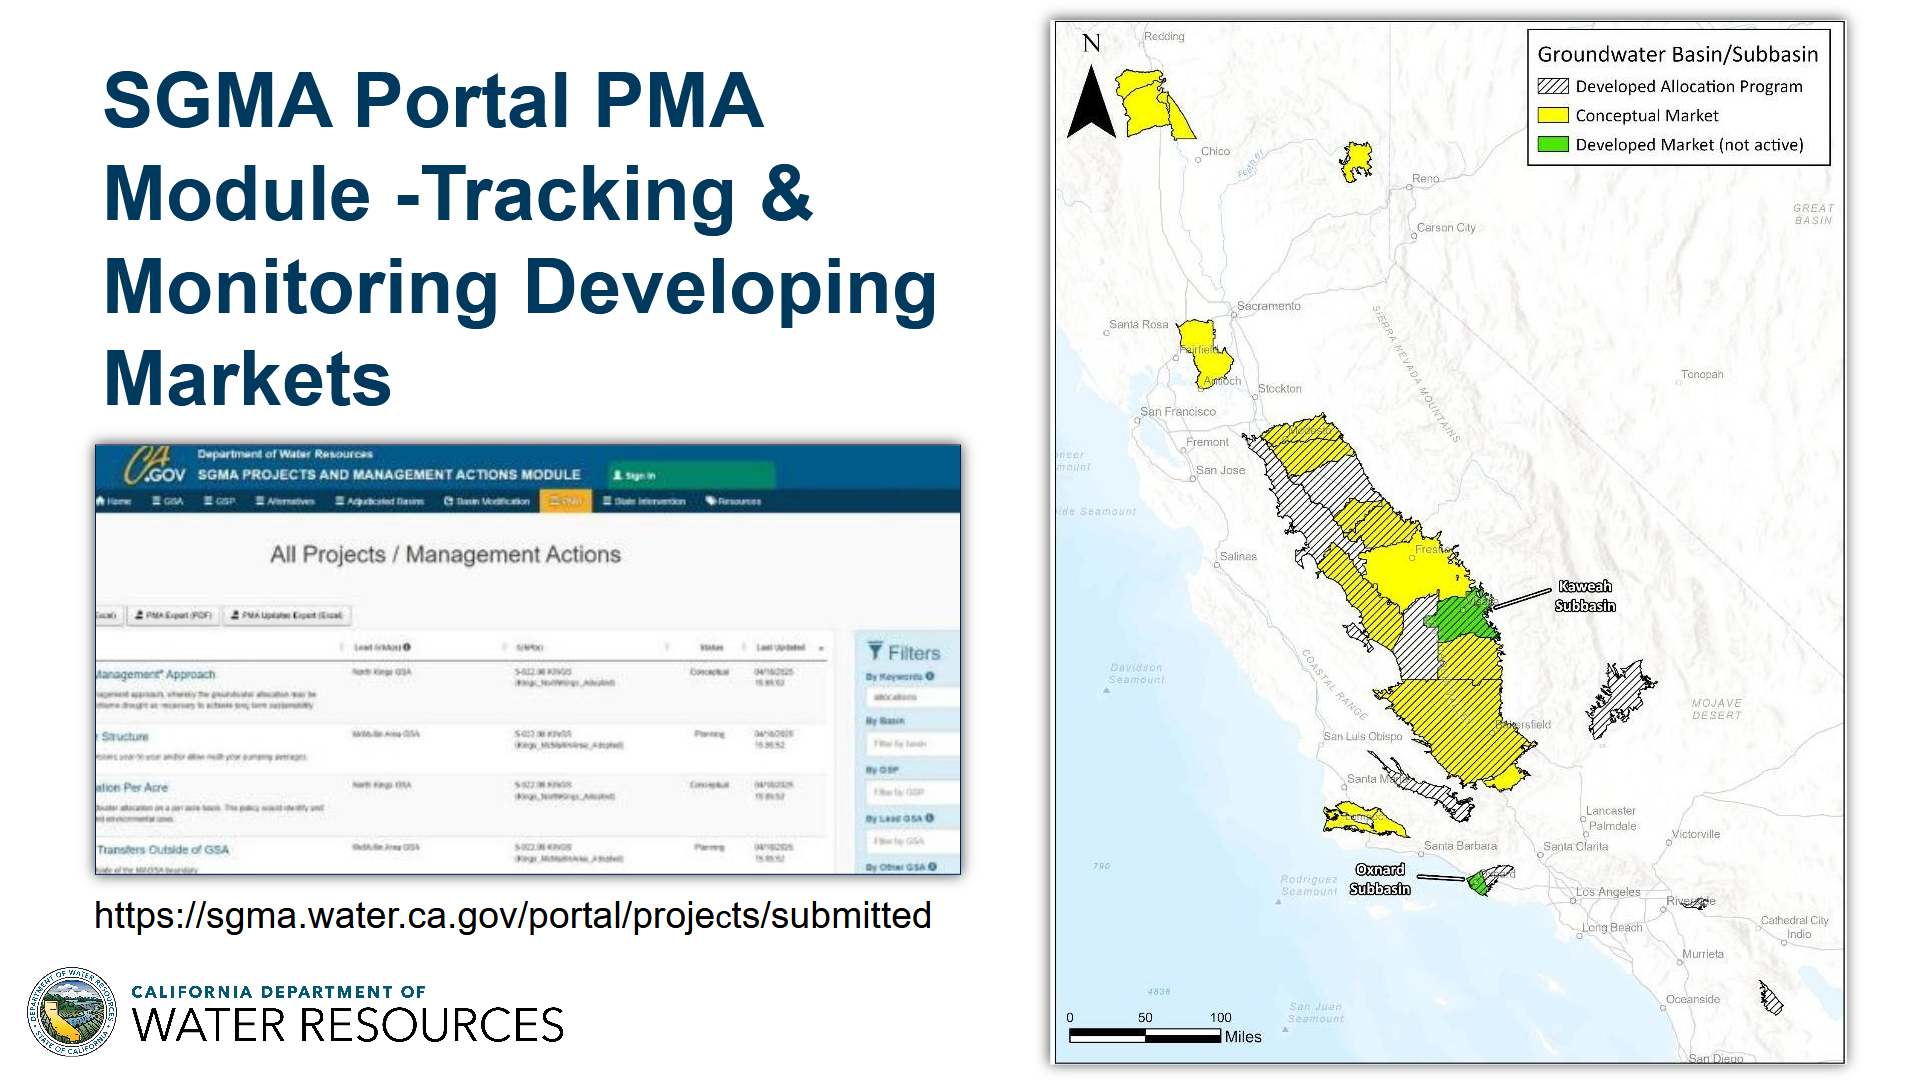
Basins shown with hatch marks indicate that at least one GSA has developed an allocation program. Basins shown in yellow are those where a market was proposed in the initial groundwater sustainability plan, suggesting allocation programs may still be under development and that trading could occur in the future. Mr. Morgan said two groundwater markets have been developed under SGMA — in the Kaweah Subbasin and at Fox Canyon GSA — but neither was active as of Water Year 2025.
The Groundwater Trading Accounting Platform was developed by the Environmental Defense Fund, the California Water Data Consortium and other third-party partners. DWR renewed funding in 2025 to support platform enhancements for another four years. Mr. Morgan said the tool is now being used in pilot studies across multiple basins. While it can be scaled for trading programs, he said accurate tracking of groundwater supply and use will be essential for any conjunctive use demand-management or groundwater trading program, which he described as an advanced form of groundwater demand management.
The interagency work team has also participated in several groundwater trading work groups and will continue engaging interested parties to better understand the status of local trading efforts and assess whether additional state action is needed. The team will also continue coordinating with partner agencies to advance the objectives of Action 3.6.
“However, at the same time, we have been prioritizing some broader issues, like subsidence, and soon interconnected surface water, and with like subsidence in particular, this may mean that some GSAs will need to reassess minimum thresholds and potentially their sustainable yields for the basin.,” he said. “I highlight this because the sustainable yield really is the basis for groundwater trading, so we can’t get necessarily too far ahead on that, but that being said, you know, our next steps will be guided primarily by feedback from the SGMA community, what those needs are, and balancing those other broader priorities of our program.”.
Subsidence BMP
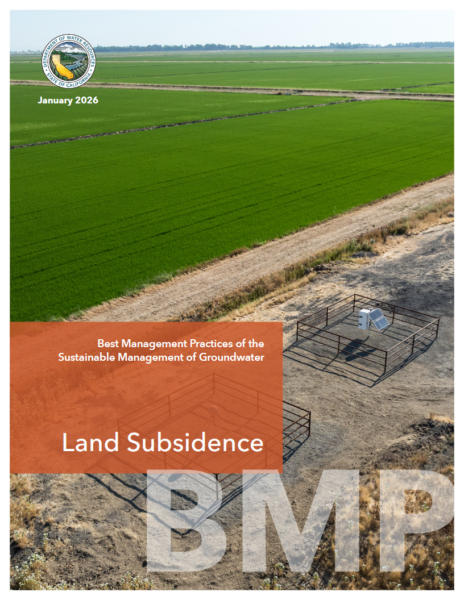 Shane Edmunds, a supervising engineering geologist in DWR’s SGMA program, then briefed the commission on the subsidence BMP.
BMPs, or best management practices, are developed under the Sustainable Groundwater Management Act to support SGMA implementation. The department is authorized under the California Water Code to produce BMPs for that purpose. The subsidence BMP is the eighth DWR has developed under SGMA. With more than six feet of subsidence having occurred since SGMA was enacted in 2015, the BMP is intended to renew focus on subsidence management.
The first draft of the subsidence BMP was released in July 2025. After public comments were reviewed and incorporated, the final version was released in January 2026.
BMP Highlights
Critical head is a central concept in the subsidence BMP; it refers to the estimated groundwater level below which inelastic, or irreversible, subsidence can occur. The threshold is used to help determine how subsidence can be avoided or minimized.
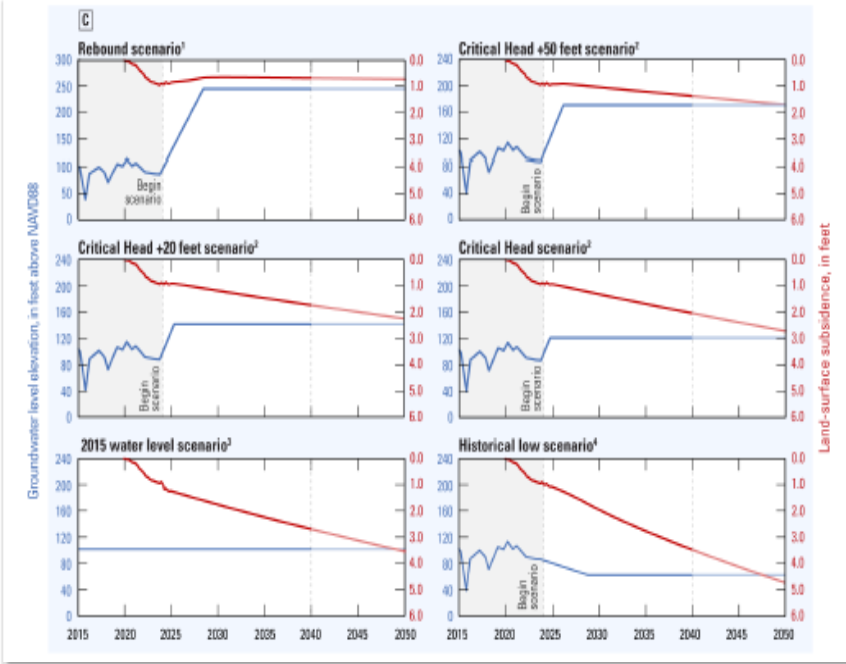
The BMP outlines three methods GSAs can use to estimate critical head for subsidence management: trend-based, empirical and modeling approaches. “The BMP itself recommends that if you want to avoid or minimize subsidence, which is one of the intents of the Sustainable Groundwater Management Act, you really need to raise your groundwater levels as rapidly as possible at or above that critical head level,” said Mr. Edmunds.
Mr. Edmunds said the BMP shows that groundwater-level management directly affects how much subsidence may occur in the future. The slide presents multiple groundwater management scenarios and the resulting levels of subsidence that could occur in a basin.
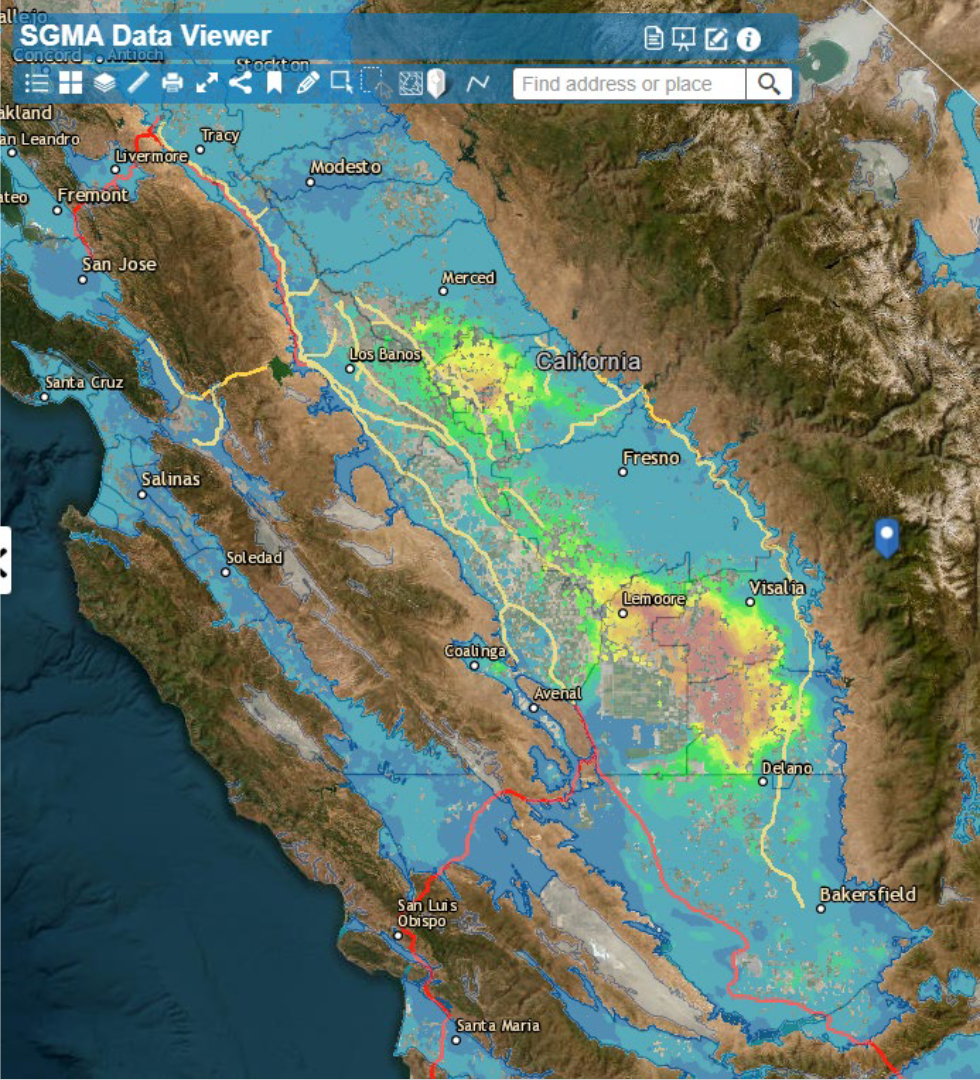 The BMP also addresses infrastructure risks associated with subsidence. The map on the slide shows subsidence data across the state, with hotter colors indicating higher levels of subsidence. Yellow and red lines mark federal and state water conveyance facilities. In areas where subsidence overlaps with infrastructure, the BMP identifies categories of infrastructure and recommends that GSAs coordinate with the entities responsible for operating and maintaining those systems.
“When they’re thinking about subsidence targets, GSAs need to be thinking about what are the impacts on that infrastructure that they should be managing the basin to avoid, and also be trying to estimate future subsidence near infrastructure, and then in those areas, GSAs are recommended in the BMP that they consider managing water levels at or above that critical head level,” said Mr. Edmunds.
DWR Actions Supporting BMP Implementation
On March 10, DWR began implementing the subsidence BMP by meeting with groundwater sustainability agencies in areas experiencing subsidence to discuss how the guidance is affecting basin management. Mr. Edmunds said the outreach is being carried out in coordination with the State Water Resources Control Board because groundwater sustainability plans across the state remain in different stages, with some approved, some incomplete and some deemed inadequate. “We are working with the board on this because SGMA is a law that requires each of our agencies to have our role under SGMA, so we are working with the board on implementation of the subsidence BMP,” said Mr. Edmunds.
Mr. Edmunds said the department recognizes that subsidence management is challenging and has been expanding support to help local agencies better understand basin conditions. DWR has been holding in-person meetings with individual basins to review existing subsidence conditions, discuss actions already underway and identify additional steps to minimize or avoid further subsidence.
Those basin-specific meetings are also intended to strengthen coordination between adjacent subbasins. Mr. Edmunds said DWR plans to hold regional meetings in the fall because subsidence often extends beyond basin boundaries, making cross-basin coordination critical.

DWR is also developing additional tools to support implementation.
- The department has been working to improve InSAR data, the remote sensing information used to measure subsidence and changes in land-surface elevation. Mr. Edmunds said earlier versions contained significant coverage gaps, shown as white areas on the map, which limited their usefulness for GSAs. He said DWR has been working with a vendor to improve the dataset and has filled in many of those gaps, expanding statewide coverage for both agencies and the public.
- DWR is also installing new monitoring stations to measure subsidence. The stations use continuous GPS technology to provide real-time subsidence monitoring. The department now has 32 sites statewide to help fill data gaps and support comparison with InSAR results, and is working with GSAs and local agencies to identify locations for 12 more sites expected to be installed this year.
- Lithology data is also included in the SGMA Data Viewer where available. The lithologic logs, drawn from well completion reports, show subsurface layers such as clay, sand and gravel, helping users better understand groundwater levels, subsidence and subsurface conditions at a given location.
- The Bulletin 118 2025 update also includes an appendix on land subsidence. Mr. Edmunds said DWR has released models for 50 locations statewide that the public can use to project future subsidence at those sites.
- DWR’s Sustainable Groundwater Management Office also continues supporting GSAs through financial assistance and facilitation services, including written translation, verbal interpretation, meeting facilitation and technical support.

