

A look at Australia’s strategies and programs that cut urban water use in half
Australia and California, despite being on opposite sides of the planet, actually have a lot in common. Australia, like California, is one of only a handful of regions in the world that have a Mediterranean climate, characterized by relatively warm wet winters and hot, dry summers. Australia is also accustomed to droughts; in their period of record, a ‘severe’ drought has occurred in Australia on average once every 18 years.
 Australia endured a severe drought from 1997 to 2012, and by the end of the drought, Australia’s cities and farms had cut their water use dramatically. As California endures its fifth year of severe drought, the strategies developed and mistakes made during Australia’s decade-long millennium drought can provide useful lessons for water managers.
Earlier this year, researchers at ISF, the Pacific Institute and the Alliance for Water Efficiency released the report, “Managing Drought: Learning from Australia.” The report provides an overview of the key initiatives implemented by Australia’s four largest cities during an extended period of extreme drought, and outlines how those measures could help California through its current water crisis.
In this webinar presented by the Alliance for Water Efficiency, Dr. Stuart White, Director of the Institute for Sustainable Futures, and Heather Cooley, Water Program Director of the Pacific Institute present on the findings of the report. The webinar was moderated by AWE President and CEO Mary Ann Dickinson.
DR. STUART WHITE, the Director of the Institute for Sustainable Futures at the University of Technology in Sydney, Australia.
Dr. Stuart White said that in his presentation, he would be discussing his experience in Australia and other places, and that there is much more information in the full report, which is available here: Managing Drought: Lessons from Australia
 The situation in Australia, as in many countries in the world, is one of extremes. The millennium drought which lasted 10 years ending in 2009 was the worst drought on record in many of Australia’s cities, and it ended with one of the worst floods on record in Brisbane. “Just in that one event, we’re able to see the extremes that we’re dealing with, and of course, we recognize that the uncertainty and the extremes will only get worse with climate change,” Dr. Stuart said.
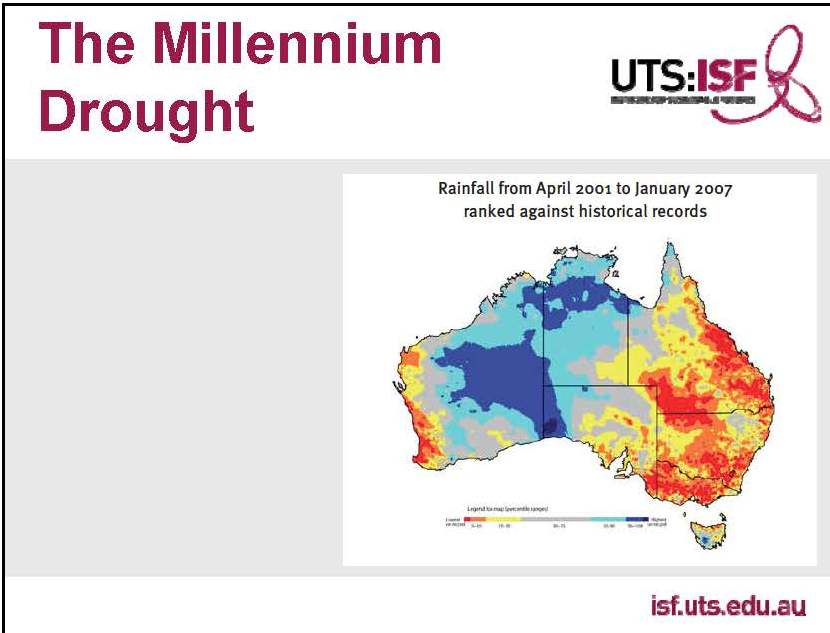 He presented a slide showing the extent of the drought and in particular, the impact on the eastern seaboard which is where the majority of Australians live in the cities along the coast. “We’re actually quite an urbanized country, all clinging to the coastline in major cities which were affected significantly by the drought,” he said. “Of course, the drought had a major impact on the agricultural sector and irrigated agriculture as it has in California. Our focus in this report was on the urban water aspect. In Australia, hydrologically the cities and the irrigated agriculture are relatively separate and for these purposes can be dealt with separately.”
“One of the key lessons was that those cities which had put the effort and time into long term water supply demand planning were those that were best placed during the drought,” Dr. Stuart pointed out. “Some cities which had not done this were able to move very rapidly into almost wartime footing to reduce demand and to increase supply during the drought, but in some cities and particularly Sydney, where long term supply and demand planning was already in place, this made the drought response planning so much easier. Therefore the lesson is that we need to integrate these things during peace time; we need to make sure that when there is not the pressure of drought, we need to bring those two together.”
Another important lesson was the importance of the demand side. In Australia, approximately $20-25 billion was spent on supply side options, so it is important to recognize the importance and significance of the demand side opportunities, he said.
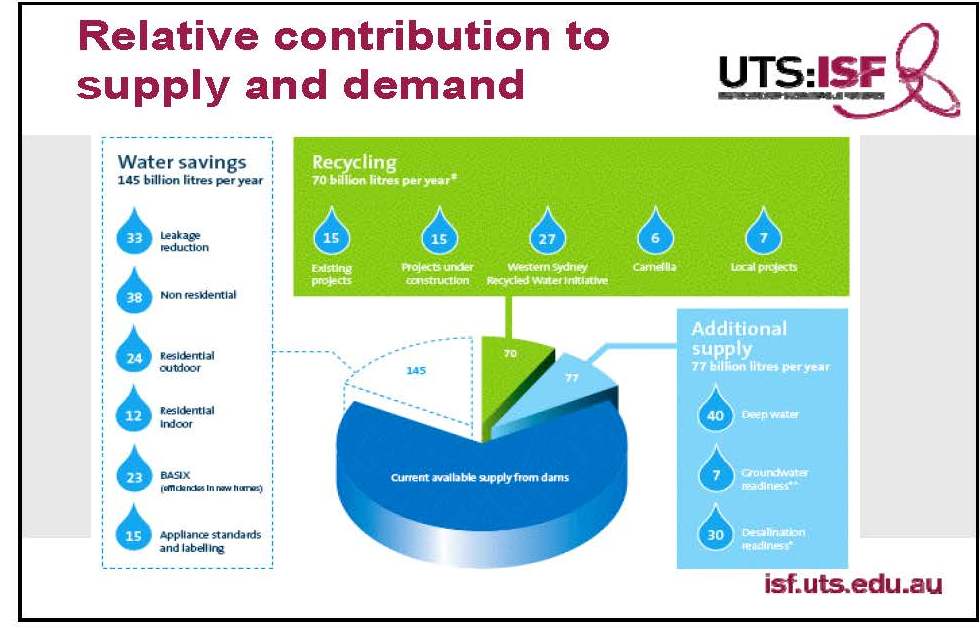 He presented a chart for Sydney showing the relative contribution to supply and demand, noting that the water savings is the largest contributor to future water supply. The efficiency measures ranging from leakage reduction through to regulatory measures, applying standards and labeling, and BASIX – the buildings sustainability index which is a requirement for all new homes to have 40% lower water use than the average which applied in 2004. “You can see from this diagram, it is a significant contribution, the major contribution, in fact, to the water supply/demand balance,” Dr. Stuart said.
 Dr. Stuart presented a graph of water demand for Sydney, noting that the numbers on the graphic are for the total production of water, not just residential, but also losses and industry. Demand increased during the 1960s as people were putting in place appliances, washing machines and so on, then decreased just as sharply after 1992, the result of pricing reforms and land use changes, but in particular, the most significant factor being the improvement of efficiency of water-using equipment, he said.
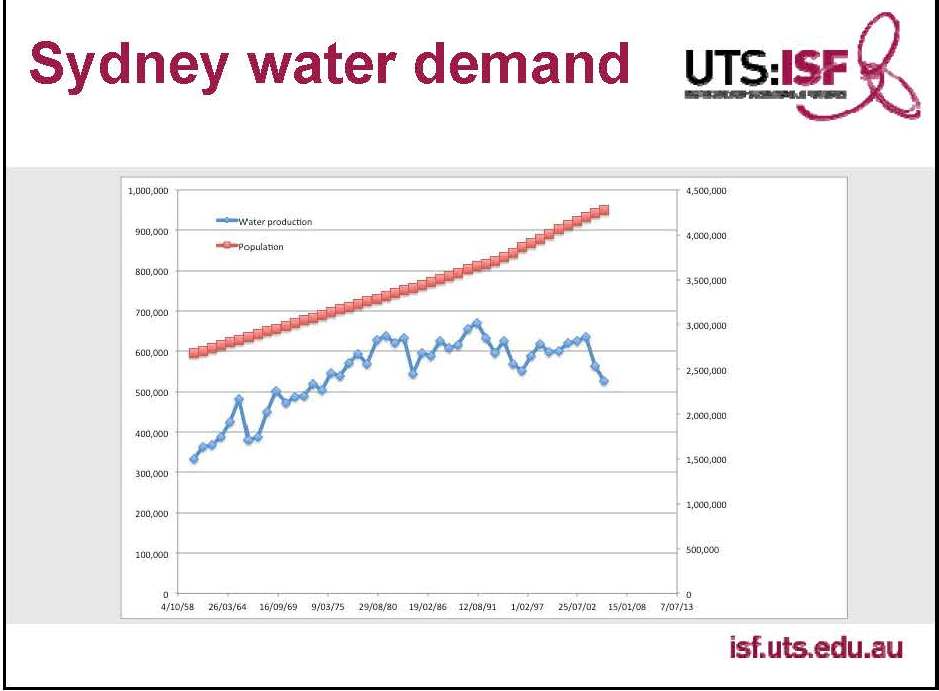 He pointed out that over a million people have been added to the city of Sydney, but the absolute demand in terms of total demand from storages has not increased over that period. “Indeed, it significantly increased after the drought started because of the restrictions.”
Dr. Stuart presented a graph showing the detail on toilets, noting that the graph starts with the single flush toilet, which used about 12 liters per flush. He noted that the use of single flush toilets decreased with the invention and the development of the dual flush toilet, an Australian invention. “With the release over successive years of more efficient dual flush toilets, we see the change in the stock of toilets each year,” he noted.


He then presented a graph showing the decrease in water used for toilet flushing, noting that the most efficient dual flush toilets currently have on the market use approximately 80% less water than the single flush toilets that preceded them. “It means we will never as much water flushing toilets as we did in 1990,” he said. “We actually reached peak flushing. You can imagine by extrapolating that graph upwards the water that’s being saved as the result of just that one end use. If you apply the same principle to showers, washing machines, cooling towers, urinals and so on, then you can see the pattern repeated across the different end use sectors.”
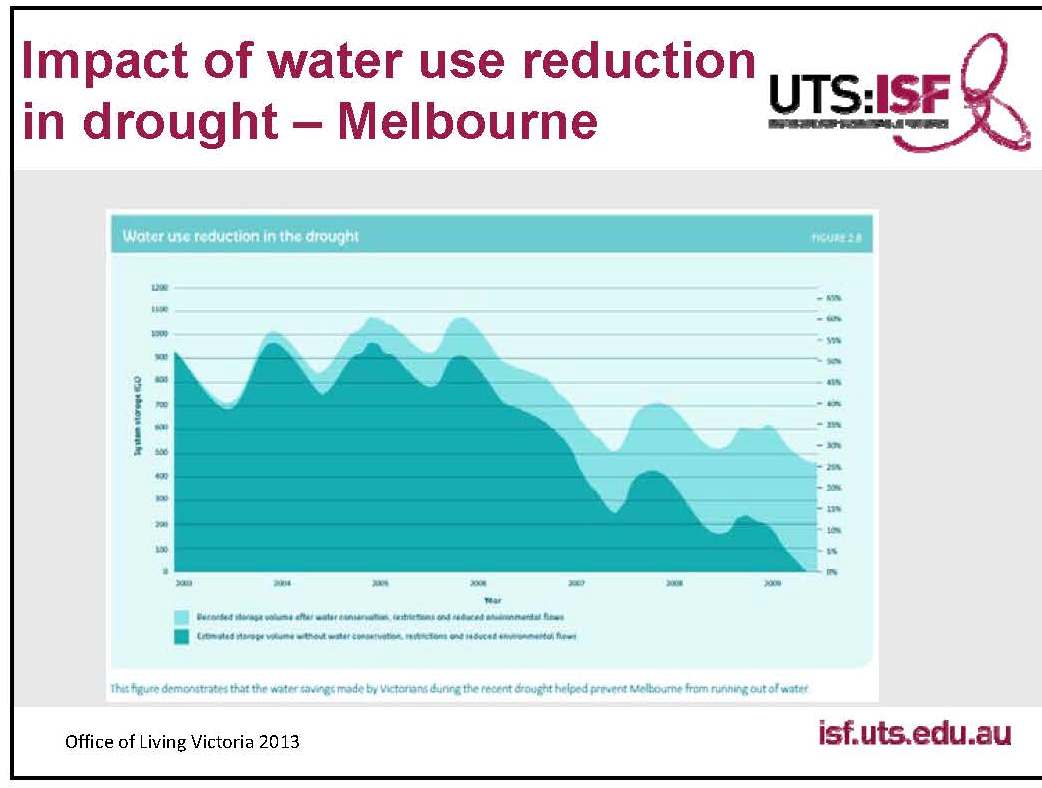 “What this means is that in a number of our cities in Australia, we would have reached dead storage had it not been for the impact of the demand side,” he said. “The importance of planning for the demand side of integrating the drought response and the long term supply/demand planning becomes evident from this graph which shows in Melbourne what would have been the case had it not been for the range of savings measures that had been put in place.”
 “We recognize that these demand side measures are the largest, single contribution; they’re also the cheapest,” Dr. Stuart said, presenting a graph for the Australian capital of Canberra. “There are a lot of different options showing on this graph, but it does indicate that the demand side options, the water efficiency options are a significantly lower cost than new supply options.”
“When it’s combined with communication engagement, they are also some of the quickest that we can implement,” he said. “One of the success stories in terms of the lessons learned from the millennium drought was the integration of communication engagement. It was a massive community response.”
 “We had situations where the major daily newspapers would be reporting on dam levels as would the nightly television news, but also it was integrated across the different programs so that when there were programs offering rebate on shower heads or other household appliances, it was integrated with the communication education campaign.”
In the case of Southeast Queensland, there was a major integrated program which included water use restrictions. “Target 140 was an effort to try and reduce the average household water use down below 140 liters per person per day,” said Dr. Stuart. “It actually exceeded that target and reached 125 liters per day or 33 U.S. gallons per person per day.”
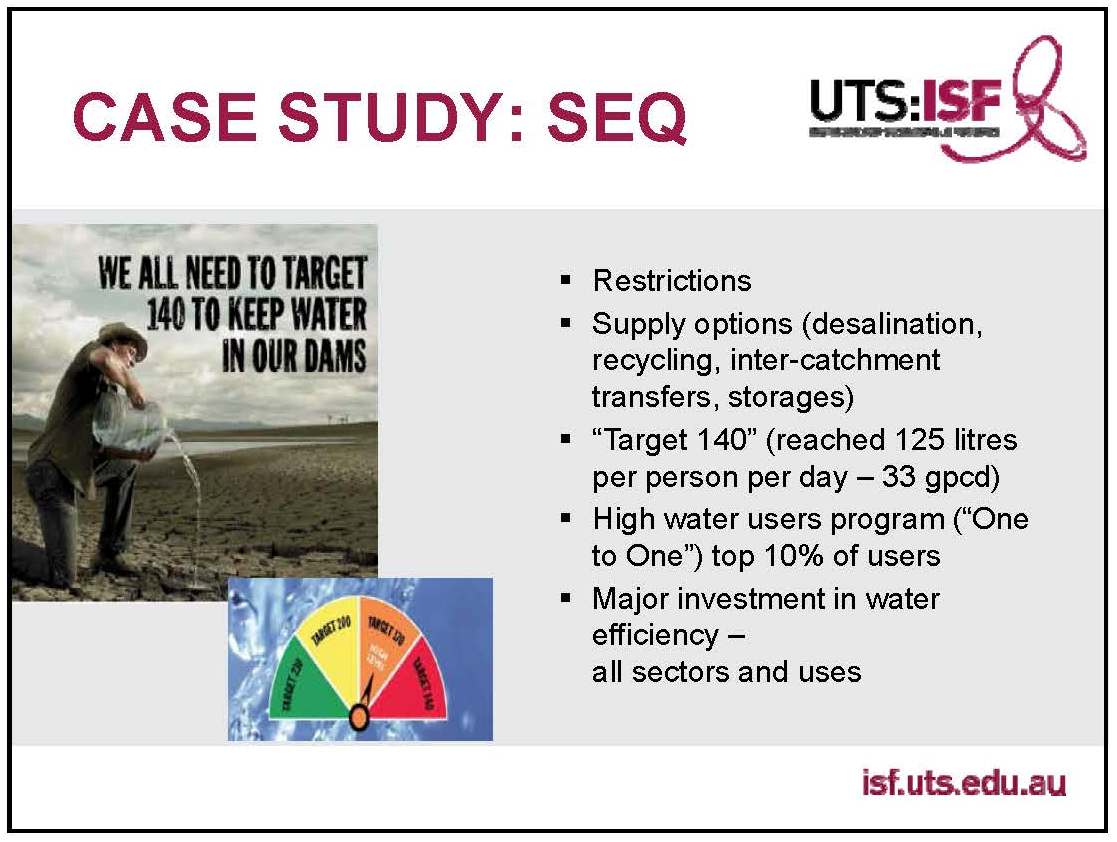 Part of the success of this program was a high water usage program, he said. “The government wrote to the top 10% of users, so approximately 100,000 users and pointed out that they were in the top 10, many didn’t realize this, and asked them to participate in this program. It was a mandatory requirement to participate in a survey at risk of being fined. There was over 90% response rate. This then resulted in people signing up to some of the different programs that were offered and in many cases, having household assessments done.”
“Targeting the high water users was extraordinarily effective,” he pointed out. “Obviously, just the mathematics of that alone, but also because it means that you’re really looking at, often, slightly wealthier people. It’s quite a progressive program from that point of view. There was a major investment in water efficiency as there was in supply options. It was a rapid movement to increase supply options.”
 He presented a graph of the incidence curve showing the consumption by the different consumption bands and how significantly that was reduced. “From a relatively high level, Brisbane had some of the highest water consumption in Australia prior to this time because they came relatively late to water use reform, so you can see the massive change that occurred,” he said.
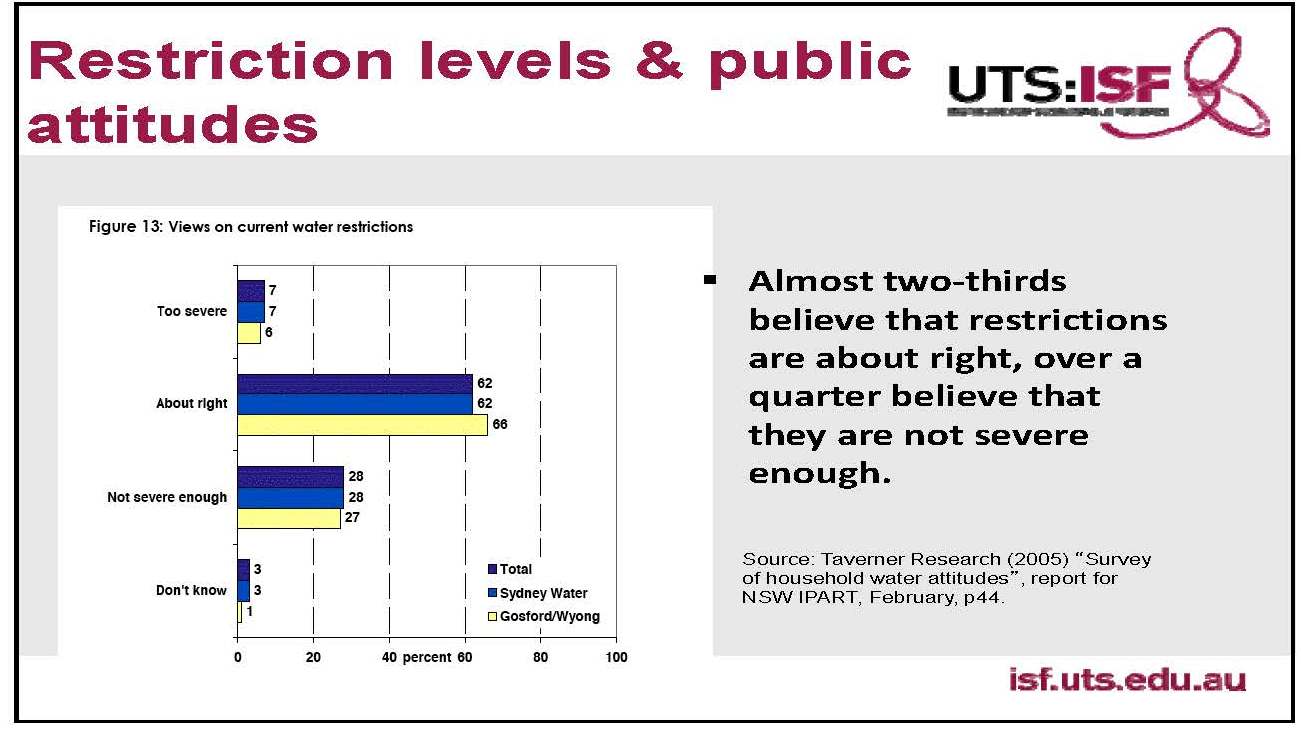 Dr. Stuart pointed out that the water use restrictions and the requirements to curtail water use outdoors on lawns and gardens were quite well accepted across the country, although not everywhere. “In some cases, particularly in Melbourne, they’re probably pushed to the edge and probably started to impact on the community rather more, but certainly some of these surveys showed that there was very strong public support for the water use restrictions,” he said.
 “One thing that I think we did not do as well is that we didn’t ask the community about some of the large decisions that were being made on their behalf in relation to water supply/ demand planning,” Dr. Stuart acknowledged. “While we’re very good across the country at the one-to-many communication, or in other words, communicating to users about what they needed to do and what help they could get, what we did not do was to use good, highly, readily available community engagement tools to ask them how much of their significant money should be spent on different options and what are the levels of service that are expected from utility – the basic questions that really should be answered by citizens.”
Implementation of demand side programs enabled them to differ the point at which dead storage would be reached. “One aspect, which was a missed opportunity, in fact, was that we could’ve implemented more opportunities for localized reuse of wastewater and storm water,” he said. “While there were some examples in some states, this was an opportunity. There were some opportunities that were not wasted, but there were many opportunities missed to put in place a system.”
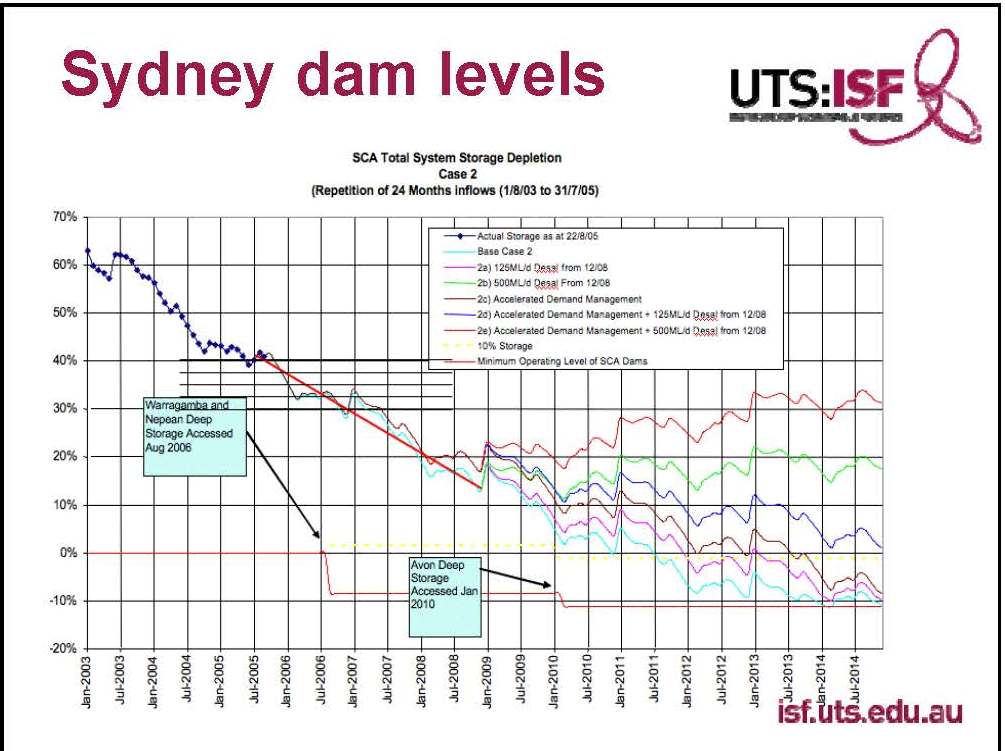 He then presented a graph Sydney dam levels. “A lot of work was done looking at the depletion curves and projecting forward what was the likely depletion from dam levels around the country, then to say, ‘If we were to reduce demand rapidly through contingency options, through accelerated demand management, what would that mean for these depletion curves?,’” he said.
“Generally, it flattens the depletion curve out, extends the time at which we’re likely to reach dead storage which actually enables some of the larger, higher capital supply works to come on stream,” he said. “This was an extremely point, and it informed the foundation after some of the work that we did in Sydney with the Metropolitan Water Plan to make sure that we planned for the contingency options.”
“In this case, we realized that we didn’t need to build a desalination plant in advance in order to have the benefit of being able to build it in time, so the planning took place to determine at what trigger level would be necessarily planned such that a new supply side option would be in place before dead storage was reached; 30% was the answer. Therefore, the demand side options became extremely important to slow the depletion curve itself.”
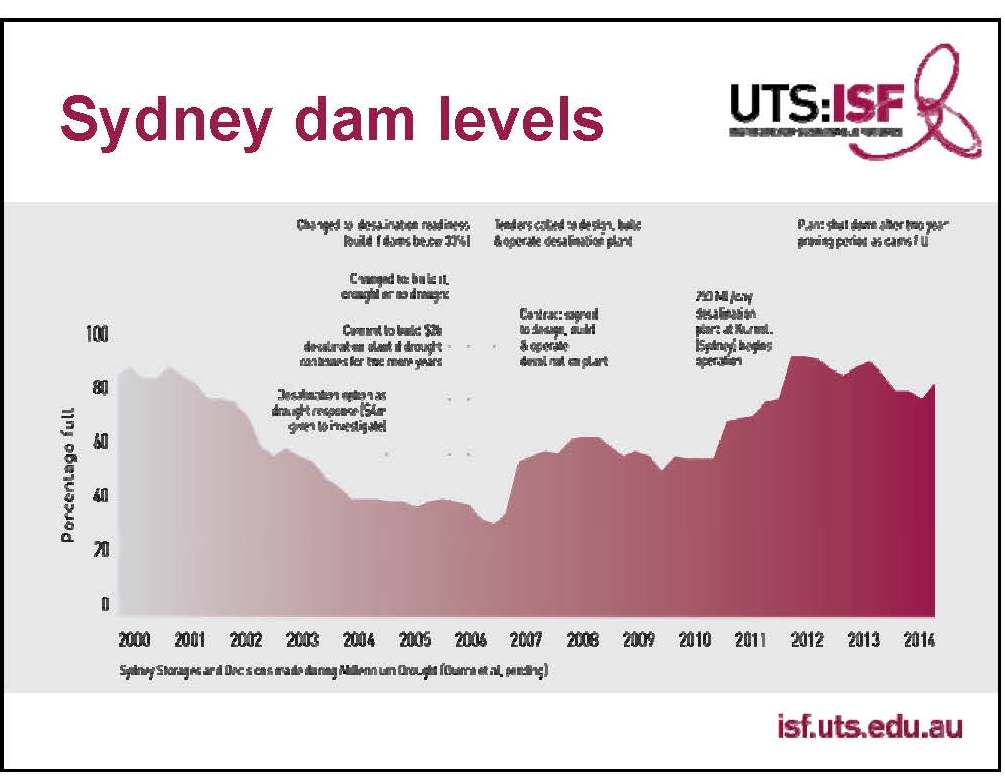 He presented a graph of the depletion of dam levels in Sydney. “In fact, the trigger level was almost reached, but the difficulty and the problem was that the contracts for the construction of the desalination plant was signed when the dam levels were 55% and rising.”
Dr. Stuart noted that in Sydney, the desalination plant is now switched off. “It’s been a significant capital cost at $1.9 billion,” he said. “The lesson is about the importance of flexibility, adaptability and to ensure that the options that are put in place are sufficiently modular and scalable, rather than a very large lump of capital.”
“Another opportunity that we missed was the possibility of putting in place some more future proofed options which represent the new generation of water infrastructure – small scale, modular, localized wastewater treatment and the storm water treatment capacity which is now becoming a part of our infrastructure, but at that time, there were opportunities which were bypassed for that,” he said.


“We’re starting to see from some of our research that it’s quite possible that the cost of that 4th generation of water infrastructure – the localized, high efficiency systems – may actually be lower than the current generation of water infrastructure,” Dr. Stuart pointed out.
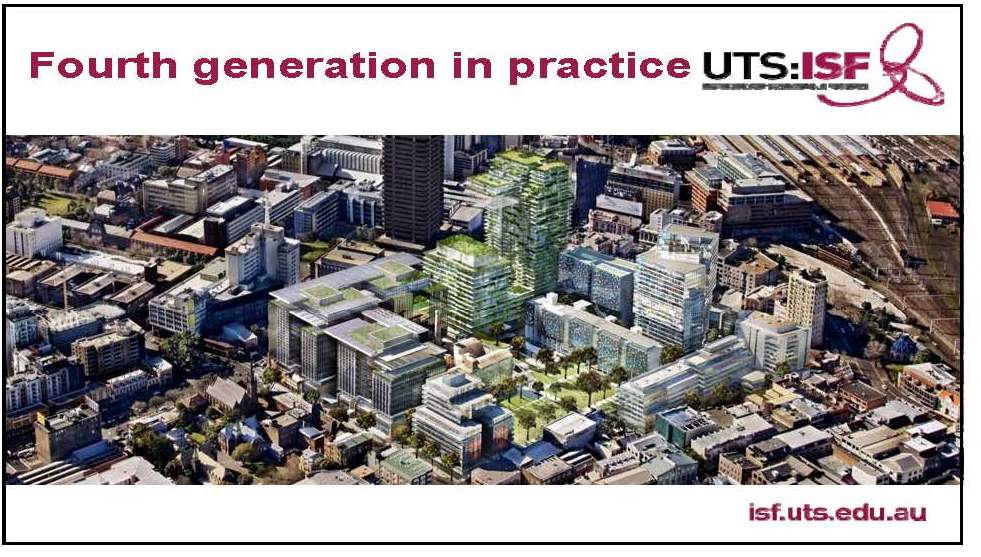 “This is right in the center of Sydney; it’s a large new development which has 1 million liter per day wastewater treatment plant underneath which captures the wastewater and recycles to high level for cooling towers, for irrigation and for toilet use,” he said. “Certainly not a unique situation, but one which represents potentially the future and an opportunity lost during our drought to implement more systems like this.”


“The last point I’d like to make is about the importance during the drought of data monitoring and measurement to actually understand what was happening in terms of the water supply and demand situation, recognizing that, of course, in many cases, we’re moving into a new era which was worse than the previous worst drought on record,” he said. “We’ve actually had to reset the hydrology on a number of our systems, but it’s important to have monitoring and measurement on the demand side to understand the demand in order to then put in place rapid response measures in terms of accelerated demand management.”
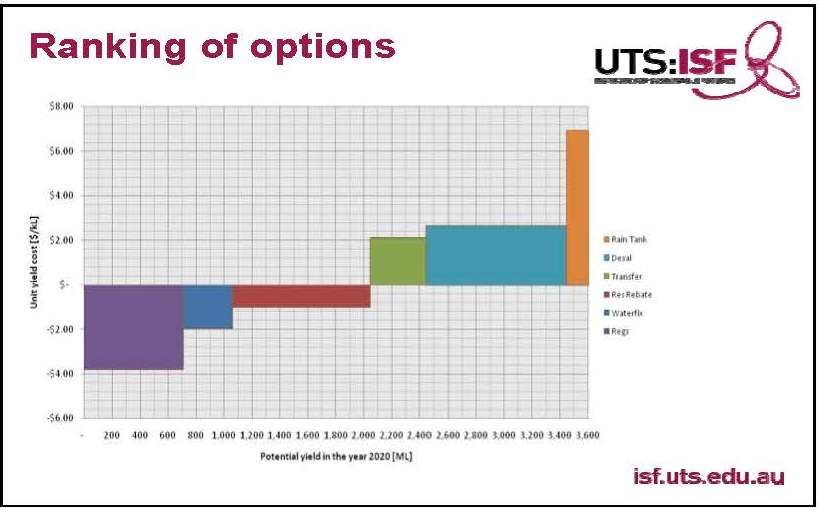 He then presented an analysis of the relative cost of reducing demand through water efficiency and supply side options. “Of course, the ranking of options will change when we’re in a situation of drought response because there’s another dimension which is the time it takes to develop and implement options which is often not there when you have a long term supply/demand planning, so we need to take that into account in the planning process.”
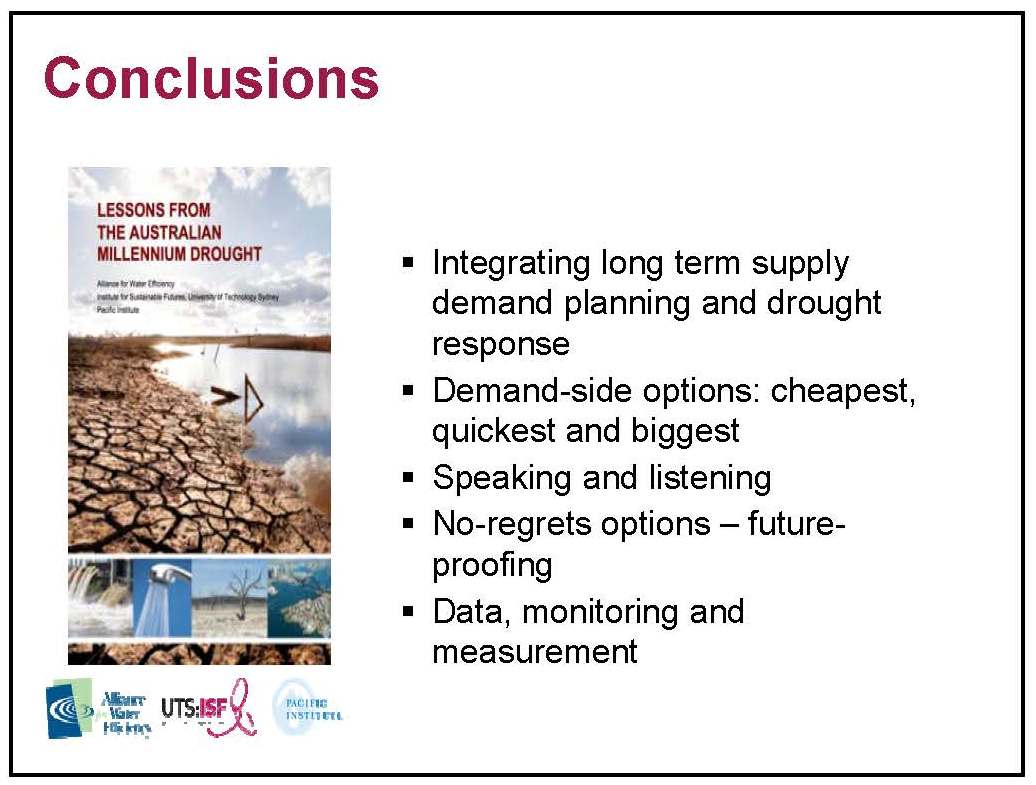 “Just to conclude, the most important thing with the integration of the supply demand and the drought response was that the demand side options were not just the biggest, but they’re also the cheapest and the quickest options that were implemented in a number of cities, particularly singling out Queensland, Sydney and Melbourne,” Dr. Stuart said. “Speaking is important, but listening is also important and that putting in place no regrets options or future-proofing the system was crucial and that we couldn’t have done any of this unless we’d had in place measurements and monitoring systems.”
Moderator Mary Anne Dickinson then turned it over to Heather Cooley, the Water Program Director for the Pacific Institute.
HEATHER COOLEY, Water Program Director at the Pacific Institute
Heather Cooley began by saying her role today was to translate some of these lessons from Australia for California, although much what has been learned there can be applied in other parts of the United States and other parts of the world.
Currently in California, drought conditions have improved for Northern California in particular; the state’s two largest reservoirs were above average by late spring, but other reservoirs, particularly those that are more southerly, like San Luis, were well below average.
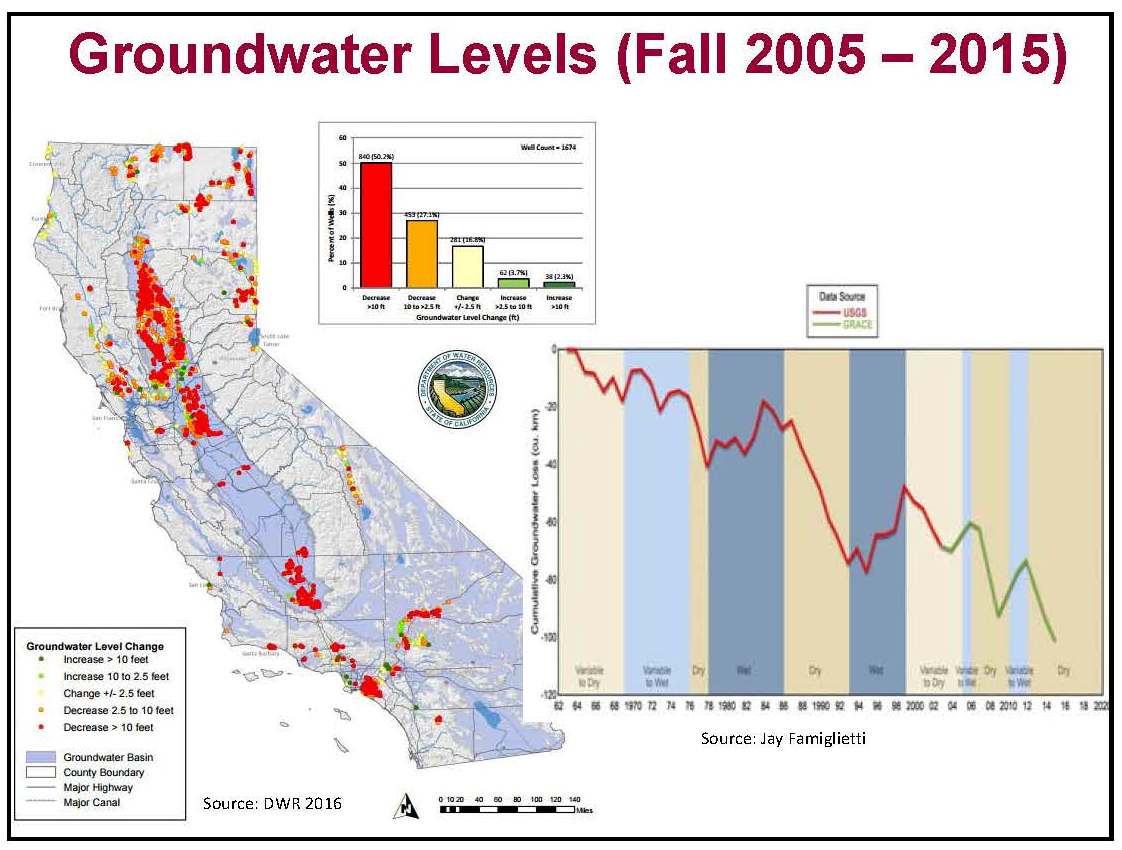 She presented a slide showing groundwater levels from fall of 2005 through fall of 2015. “What we can see is that across the state, more than half of the monitoring wells have dropped by 10 feet or more during this period,” she noted. “These wells are not all concentrated in the San Joaquin Valley which is where we often think of the most severe ground water overdraft, but in fact, they can be found throughout the state and in the northern parts of the state.”
The graph on the right shows ground water conditions in the Central Valley going back to 1962. “What we can see is that it’s not unusual for ground water level to decline during droughts,” she said. “Ground water is an important stop gap measure. It’s not as sensitive to what’s going on above ground and to any changes in precipitation, so it is something that we can rely on.”
The challenge is that the ground water levels recover somewhat during the wet years, but never fully recover that’s led to the long term ground water overdraft that we’re seeing, said Ms. Cooley. “Cumulative ground water loss in the Central Valley is about 100 cubic kilometers since 1952. That’s equivalent to about 80 million acre feet. Even as we’re seeing some recovery and some surface reservoirs in some regions, ground water conditions will still require some recovery and that’ll take a much longer timeline to do.”
 “We’ve seen conditions improve this year, but it’s not enough to raise the 4 year deficit and moreover future conditions are uncertain,” she said. “We need to be thinking about this drought in a much longer time frame.”
Ms. Cooley noted that California is prone to multiyear droughts and that a number of actions have been taken over the last several decades at the national, state, and local levels.
National: The federal government adopted standards in 1992 for toilets, shower heads, and faucets that really set the framework for future efficiency improvements. In addition, the federal government launched Water Sense in 2006, a labeling program to help consumers make more informed decisions about the types of appliances and fixtures that they will be installing in both homes and businesses. Both of these things have helped California, she said.
State: California was the first state to adopt water efficiency standards in codes. “In fact, many of our standards and codes that we adopted at the state level were then eventually rolled into the National Standards that were later adopted in 1992,” Ms. Cooley said. “In 2009, we established a policy of a 20 percent reduction in urban per capita use by 2020. Many utilities have been working to achieve that goal. We’ve also seen at the state level, investment to diversify water supply, then interconnect systems. Much of that is being done through for example, proposition 50, proposition 84 and more recently through proposition 1.”
Local: Many utilities draw up contingency plans as part of their urban water management plans. They’ve been implementing programs and investing in water conservation and efficiency, since the early 90’s and in some cases even earlier, and they’ve also been investing in local storage and in-use supply, she said.
“All of these actions have really provided a good foundation for responding to the drought,” said Ms. Cooley.
As an example, Ms. Cooley discussed toilet water use in California households. “Back in 1980, toilets in California were 6 gallons per flush that was the standard flushing volume; at that time, given that population, about 750,000 acre-feet of water was being used just to flush toilets. If we had not passed the toilet standard and we were still using these 6 gallons per flush toilet, our current household water use, again just for flushing toilets would be about 1.2 million acre feet. A series of toilet standards both at the state level and at the federal level have fortunately have saved us about 640,000 acre feet.”
“If we look at current toilet water usage, it’s actually less today than it was in 1980, despite adding about 15 million people to California,” said Ms. Cooley. “If we had been using at the higher level at the 1.2 million acre feet level, certainly responding to this drought would have been much more difficult. We would have had to take much more severe actions and measures in order to respond.”
But Ms. Cooley pointed out that more could be done. “If everyone in the state were using the high efficiency toilets which are now the standard going forward, we could save an additional nearly 300,000 acre feet which will help us in the future not only respond to drought but also to continued population and economic growth.”
California has a good, strong foundation and has made a lot of improvement but there’s still a lot we can learn not only from Australia but from others, she said. She then listed the lessons for California from the Australian experience:
1. Expand the breadth and scale of efficiency programs.
“In California, currently much of the focus has been around responding to the state mandates by implementing short term conservation measures, such as restrictions on the number of days of watering, or calling for shorter shower or fewer toilets flushes.”
Ms. Cooley acknowledged that there’s been a lot of investment, in particularly in Southern California, on long rebate programs which will be important in the long term for improving and transforming the market. “But if we look to Australia, Australia implemented a broad suite of efficiency programs to reduce water use in household and businesses and these efforts have continued to provide significant water savings.”
For example, in Sydney launched a ‘water fix program’ that reached nearly a third of homes in the Greater Sydney area. Under this program, licensed plumbers would perform a household water audit, check for and repair leaks and install efficient devices such as dual flush toilets or faucet aerators. Within this program, customers paid about $16 for the audit, plus an additional amount for any of the services rendered; they could then repay the water utility for these services over a 4 month period. “As I mentioned, this was a very successful program. They were able to get into an upgrade about a third of the homes in the Greater Sydney area. It was an important component of responding to the drought,” she said.
In Queensland, a number of nonresidential programs were implemented. Businesses that used less than 8 acre feet of water were required to install water efficient devices such as high efficiency toilets; businesses using more than 8 acre-feet were required to develop water efficiency management plans that accounted for their water use and that identified measures to reduce water use by 25 percent; they then had a plan to implement these measures. As part of this program, fines of up to $90,000 were levied for noncompliance. However to assist with compliance, rebates and incentives totaling 2.2 million dollars were provided to more than 2000 customers.
“It wasn’t simply about creating a mandate that provided the framework,” she said. “It was the combinations of that with the rebates and incentives and the education programs which is really what enabled them to get the significant savings that they saw.”
2. Balance supply and demand management using a least cost planning approach.
There is renewed interest in developing new supplies in California to respond to the drought and here again Australia can provide lessons, said Ms. Cooley. “During the drought, Australia built 6 major sea water desalination plants as well as large recycled water plants. Today in many cities, these plants have been shut down which highlights the risk of building large expensive new supplies to meet drought related needs.”
A least cost planning approach could help to avoid some of those mistakes. “Least cost planning requires consideration of the full range of supply and demand management measures and then pursuing the least expensive measures first,” she said. “Adopting this approach, would help to ensure, we avoid some of the more expensive measures that eventually are not used once the drought ends in favor of the less expensive measures.”
3. Use a readiness approach.
“With this approach, there is specific water supply or demand measures that are only pursued when certain criteria are met,” Ms. Cooley said. “The appropriate approval and the permits are all put in place and then once you reach a certain trigger, say a water supply level, that then turns on the contract or the very steps that are then needed to bring that project to fruition. This again is another way of being prepared for the situation but not creating infrastructure and investment that becomes stranded after just once the drought ends.”
4. Improve integration.
California water systems are highly fragmented, making it difficult to coordinate an effective drought response; Australia generally has far fewer water utilities. However in some regions, they did have a number of utilities that were responsible for providing water, such as in South East Queensland where there were more than 20 councils that provided water service. The Queensland government established the Queensland Water Commission to try to provide overarching policy planning and regulatory functions, which then allowed for better coordination.
In California, many regions are already moving in this direction and in fact have made investments in this over the past several decades. Much of this is being done through the integrated regional water management other planning efforts at that scale, she said. “I think though there could be a renewed effort in trying to improve integration within the context of drought planning and preparedness and response within that more integrated approach.”
5. Address pricing and short-term revenue losses.
This is an issue that’s coming up increasingly in California as utilities are struggling with meeting with the law or meeting their revenue requirements given the large reduction that they’ve seen in demands, she said. “Australia did not use pricing as a mechanism to incentivize conservation, due in part to concerns about impacts on low income households and on renters who often don’t have the authority to make any real changes within the house,” Ms. Cooley said. “After the drought ended however, water bills did go up, mostly to pay for the large scale supply in infrastructure.”
“I think we can look at Australia and build upon this,” she said. “This presents a real key opportunity for California to carefully investigate whether the short term drought surcharges or other measures could be designed to address the equity concerns, to incentivize water savings during the drought and potentially to avoid some of the longer term costs for customers.”
6. Improve data monitoring and measurement.
“This was a real key area for Australia,” Ms. Cooley said. “It helped them to plan for various measures, when to implement that, how much they would cost, and how they compared with one another.”
Ms. Cooley acknowledged that California has made some real improvements. “The state now requires utilities to report water use on a monthly basis, and that’s forcing us to have some important conversations around how much water people are using and how much they could be using. But we could still be doing more in this area. For example, statewide and regional data on the market saturation of various efficiency devices could provide important information about which measures to really focus on within the drought or how to move forward. Information on the cost of these measures, on their benefit, could also be critical for helping us prioritize among them.”
QUESTION AND ANSWERS
Question: When Dr. Stuart was speaking to supply and demand, someone had a question on, what exactly is deep water?
“The deep water access means constructing capital works to reach deeper into reservoirs and storages, in order to get more water out of those storages,” Dr. Stuart answered. “This is used in number of parts of the world and particularly, most recently and extremely in Sao Paulo in Brazil. In Sydney, it was 90 million dollars’ worth of construction, to get a significant increase in yield.”
Question: In Australia, is water conservation effort combined with land use management efforts? What was the procedure related to giving a permit for water use for new urban development?
“If a developer is building a 100 houses, then before they can allow them to be occupied, they would have to satisfy the requirements and the BASIX (the government program to address household water efficiency). The BASIX is unusual in that it’s performance based rather than prescriptive,” Dr. Stuart said. “Most states have a prescriptive framework which says you shall have this kind of shower head or you shall have this kind of rain water tank … Whereas BASIX says that you have to do such measures that will reduce the demand by 40 percent. It could be recycling, it could be rain water and obviously efficiency goes without saying. In that sense, it’s a superior approach and it does have the force of law.”
Question: In Australia, how did the drought impact the relative water allocation to public supply, urban versus agricultural uses?
In Australia, the cities hug the coast so hydrologically, they’re not so connected; however, there were a few, Dr. Stuart explained. Adelaide is a city that takes water from the Murray Darling basin, which is where Australia’s largest irrigated agriculture region is. “There was some competition, between irrigated and urban use. Similarly in Melbourne, one of the responses to the drought was both a desalination plant and what was called north south pipeline, which was to save water in agricultural areas for transfers. Well that idea has some merit and certainly agricultural savings could be much lower costs than urban savings in some cases, but there are also social factors that need to be taken into account and also in this case a very high capital cost associated with the transfer pipelines. It wasn’t a straight forward low cost implementation in that case. There are not many examples around Australia where there is such a conflict but there are some and of course, they have to be handled sensitively.”
Question: How was fee structure used, if at all to reduce demand?
“Not as much it could have been used in Australia,” Dr. Stuart acknowledged. “In fact, I think the United States has better examples of drought surcharging and drought pricing and I know that Heather and Mary Ann, could speak to that also. They were some instances where effectively fines were introduced for people who exceeded a certain allocation, which is essentially the same structure as drought pricing but perhaps implemented in a way that is not necessarily the best way to do it.”
“I personally think that the idea of a drought surcharge is a very good one,” Dr. Stuart continued. “It’s economically sound. It certainly has been proven in some jurisdictions to have the impact but it does need to be implemented, in combination with the other instruments. In other words, if you have a stick you need a carrot. You need to have regulation, incentives through pricing and communication, and education. All three of those instruments are operating together and you certainly need to pay attention to the socio-economic impacts – impacts on equity and impacts on low income and it is very possible to do that through schemes where rebates, water efficient equipment and the like.”
“The Alliance for Water Efficiency is very interested and concerned about the issue of revenue reductions coming from reduced water sales when efficiency programs are successful,” added Ms. Dickinson. “Also in developing proper rate signals during a drought to not only encourage reduced water use as a drought response but also to use the drought surcharge as a tool to make up the difference in that needed revenue. We have created a handbook and a model specifically for this purpose which you can download for free from the website, FinancingSustainableWater.org; you can download the rate model which is a very easy to use excel file and the handbook and the user guide that accompanies the rate model.”
Question: Could you explain why 4th generation infrastructure would be less costly than first generation?
“At first glance it may appear not to be the case, but one of the key issues with 4th generation infrastructure is where you can include the impact of the avoided costs,” answered Dr. Stuart. “What we’re starting to realize is that the cost of the treatment is only part of the cost of the water supply system and the water and sanitation and storm water system. In fact, the cost of transport is also significant. If you take that into account, over the long term then it appears that in some circumstances, it may be better to treat close to the source rather than have more extensive networks with larger parts and transport systems.”
“I think you’re referring to about cost broadly so there can be a lot of externalities associated with some of those first generation that were costs that were borne by others,” added Ms. Cooley. “I think when you’re thinking about that 4th generation, you’re thinking more broadly about not only the external cost but also the potential for multiple benefits with some of these alternative approaches.”
“Absolutely,” responded Dr. Stuart. “I didn’t spend much time discussing that but on the slide you can see some of the characteristics. It includes efficiency, it includes the capture of nutrients, and a large amount of the energy content of water and waste water. The carbon content itself – we’re starting to recognize that the externality associated with our current systems, if we can reduce some of those, then we may have a more cost effective solution. This is very much in flux of the moment. It also depends on what value and what cost we put on our existing centralized systems and the transition for those. But we see that the water sector is going in some ways the same direction as the electricity sector with the rise of decentralized energy, energy efficiency and so on, with a probably 10 to 20 year delay.”
Question: Was there any work undertaken to minimize, unaccounted for water leakage by the water providers?
“In Australia a lot of that work had been done prior to the drought thankfully; if it hadn’t been, then we would have been in difficulty,” said Dr. Stuart. “Having said that, there were some accelerated programs. Sydney, for example, had put in a system to inspect 21,000 Kilometers of pipeline every 3 years. Part of the analysis and work that was done was to look at whether that could be increased to be every year, so quite a significant program.”
“Now it wasn’t carried to that full extent but it was increased as part of the drought program,” he continued. “In other places, pressure management and leakage management go together and there were some areas and particularly in Queensland, that led the way, probably from being a bit further behind and probably moved up to the front of pressure management and leakage management during the drought as a result of the drought.”
Question: Were there water quality challenges and if so, could you discuss how you may be addressed them?
“They were and often this is the case with the storages getting closed to dead storage and this imposes additional costs on water treatment infrastructure,” Dr. Stuart said. “All of the cities in Australia have different ideological considerations. Melbourne for example has large protected catchments and very high water quality, whereas in South East Queensland, there were issues with water quality and that didn’t result in an increase in water treatment requirements.”
Question: What is the current post drought per capita water use?
“While the level of demand has gone up slightly, it has not bounced up to anywhere near what it was before,” said Dr. Stuart. “For example, in South East Queensland, the target 140 was overshot to be 125 liters per capita … I think it’s gone up to around a 170 liters per person per day whereas previously it was 300. While it’s gone up slightly, it’s nowhere near what it is was before. There has been a irreversible one time structural shift in water use as a result of the measures that were implemented.
Question: What is the status of the 6 desal plants that were constructed?
“With the exception of Perth, most of the desalt plants are offline because the high operating costs means that they’re not needed,” said Dr. Stuart. “In Perth, it’s a very different situation. They actually provide to some extent base load water supply for the city of Perth. We have a very different hydrological situation over there.”
Question: Regarding those desal plants, what impact on water bills for customers has there been with the building of those desalt plants and also on the continued implementation of conservation, since the big capital costs need to be paid off by increased revenues?
“Yes, it’s been problematic,” said Dr. Stuart. “In the case of the Sydney context, it was $100 per household per year was the direct cost. It also significantly increased the energy intensity along with the other measures that were put in place during the drought, in transfers and so on which required extra pumping. It had increased the energy intensity, at least while they are operating. The ending of the drought and the major capital expenditure has resulted in a reduction in attention being paid to water efficiency by most water utilities around Australia – almost all water utilities. I think this is quite problematic because it means that there’s a significant loss of intellectual capital and corporate knowledge, which when the next drought comes, it will cost a lot and be quite difficult to recreate that corporate knowledge. One of the benefits of this project is that we have been able to document some of the lessons from the drought for Australian consumption during the next drought. That’s a silver living from this particular project.”
Question: In Australia, do conservation efforts work in conjunction with storm water agencies to capture and reuse water?
“Yes, there have been number of quite innovative and exciting examples that are around the country,” said Dr. Stuart. “There have been some aquifer recharge examples in Adelaide. There was some investment including during the drought by the then National Water Commission. This is a body that unfortunately has now been disbanded, but they invested in storm water installations around Australia. There was a major roll out, if we include rain water tanks as a means of capturing roof water at least; there was a major roll out of rebates for rain water tanks. In a retro fit situation, the economics are more difficult, but we have done some analysis of the savings from installation of rain water tanks and found something like a 20 cubic meter per year for even relatively small tanks across the Eastern seaboard in the subtropical regions where you have more reliable rainfall. It’s more difficult to make them work in areas that are more arid, obviously or more Mediterranean.”
Question: Were all the water savings based on mandates or were there voluntary reduction successes?
“The major restrictions were mandatory and people could be fined if they don’t meet them,” said Dr. Stuart. “Of course this, only applies to those things which can be observed such as outdoor water use and in some cases, some businesses such as car washes and swimming pools and municipal use. However a lot of the savings ended up being beyond what could be policed. There was a surprising amount of indoor water use reduction during the last period of drought so clearly there was something more going on than just the power of restrictions. The additional factor is the major programs of investment by utilities and governments in water efficiency through retro fits and those programs – all of those were essentially voluntary. There were some where there was requirements on businesses to participate in programs and to put in place certain things, particularly in South East Queensland. But most of them were people voluntarily taking up a generous offer; in fact getting with the spirit of those offers.”
“I’d come back to the idea that if you use communication, education in combination with regulation and in combination with incentives, those 3 together in balance, then you had a much more effective program than if you rely solely on regulation or solely on communication and education,” said Dr. Stuart.
For more information …
- Click here to watch the webinar.
- Click here to read the report, Managing Drought: Lessons from Australia
 Sign up for daily email service and you’ll never miss a post!
Sign up for daily emails and get all the Notebook’s aggregated and original water news content delivered to your email box by 9AM. Breaking news alerts, too. Sign me up!
