
From the State Water Resources Control Board:
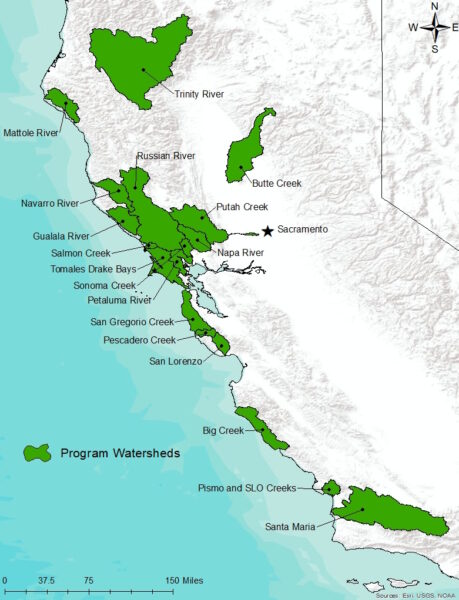 The State Water Board’s Supply and Demand Assessment Program has published several additional interactive surface water demand visualization dashboards for watersheds across California. This release follows an initial set of dashboards published for nine watersheds in 2025. These dashboards provide insights into reported surface water demands and are part of our ongoing effort to improve data transparency and support informed water management. New dashboards are now available for the following watersheds:
- Big Creek
- Pescadero Creek
- Petaluma River
- Pismo and San Luis Obispo Creeks
- San Gregario Creek
- San Lorenzo River
- Sonoma Creek
- Tomales-Drakes Bay
- Trinity River
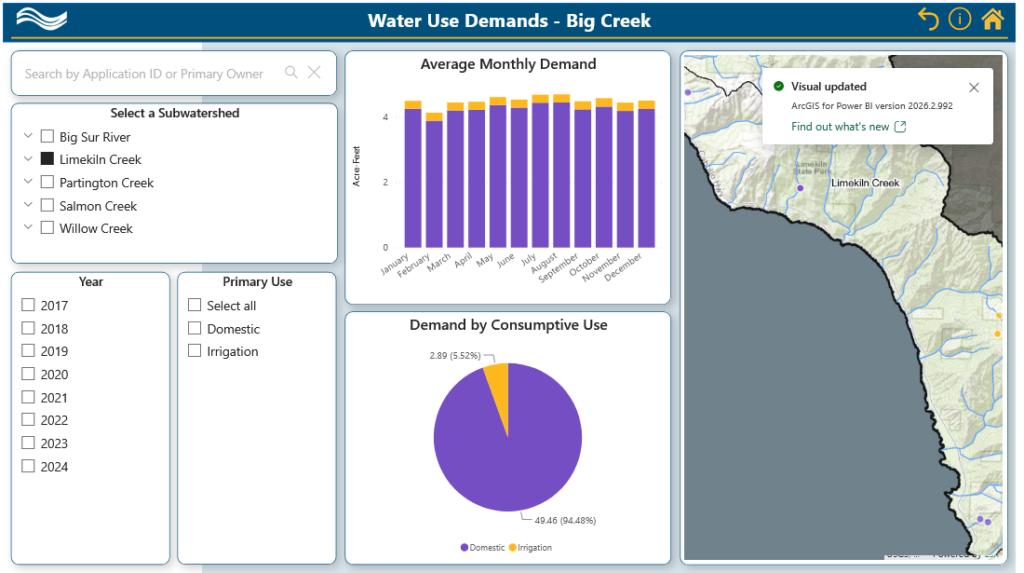
These tools are designed to complement our watershed-specific water supply models being developed and to serve as a resource for local water users, managers, and interested parties. Users can explore the spatial distribution of reported diversions and, as supply models are completed, track evolving supply and demand metrics within each watershed. The dashboard is demonstrated in a short video.
The new dashboards join the 2025 surface water demand visualization dashboards already completed:
- Butte Creek
- Gualala River
- Mattole River
- Napa River
- Navarro River
- Putah Creek
- Russian River
- Salmon Creek
- Santa Maria River

