
New research shows how La Niña and El Niño influence U.S. wildfires
By NOAA Research
The Pacific Ocean’s El Niño-Southern Oscillation (ENSO) is arguably the most influential climate driver on Earth. Its cycles of warm and cool waters in the central and eastern equatorial Pacific alter where ocean heat is released into the atmosphere, affecting atmospheric circulation, temperatures, and precipitation around the globe.
New research by NOAA’s Physical Sciences Laboratory (PSL) has analyzed in detail how the state of ENSO in autumn, either the warm El Niño or cool La Niña phase, influences where wildfire activity will occur across specific regions of the United States during the following year.
In particular, the analysis found that La Niña in autumn often leads to low precipitation and high evaporative demand across the southern United States, which primes vegetative fuels to burn during the coming year.
The research was published in the Journal of Geophysical Research: Atmospheres.
“The El Niño-Southern Oscillation, through its La Niña and El Niño phases, offers a powerful tool for predicting the likelihood of extensive wildfire activity in several U.S. regions up to a year out, information that is crucial for wildfire managers as they prepare for wildfire activity,” said lead author Andrew Hoell, a PSL research meteorologist.

Hoell noted that the La Niña which emerged during autumn 2025 was followed by the historic western snow drought and an extraordinary early spring heat wave, which has led to drier, more flammable fuels.
“Unfortunately this year in the West and southern tier, it has been very dry and very warm,” Hoell said. “We’re talking about some historically warm conditions and at the same time below average precipitation.That sets up the land surface to be able to burn.”
The National Interagency Fire Center’s Predictive Services April 1 outlook anticipates above- normal significant wildland fire potential for the southern U.S. this spring and summer.
What are the phases of ENSO?
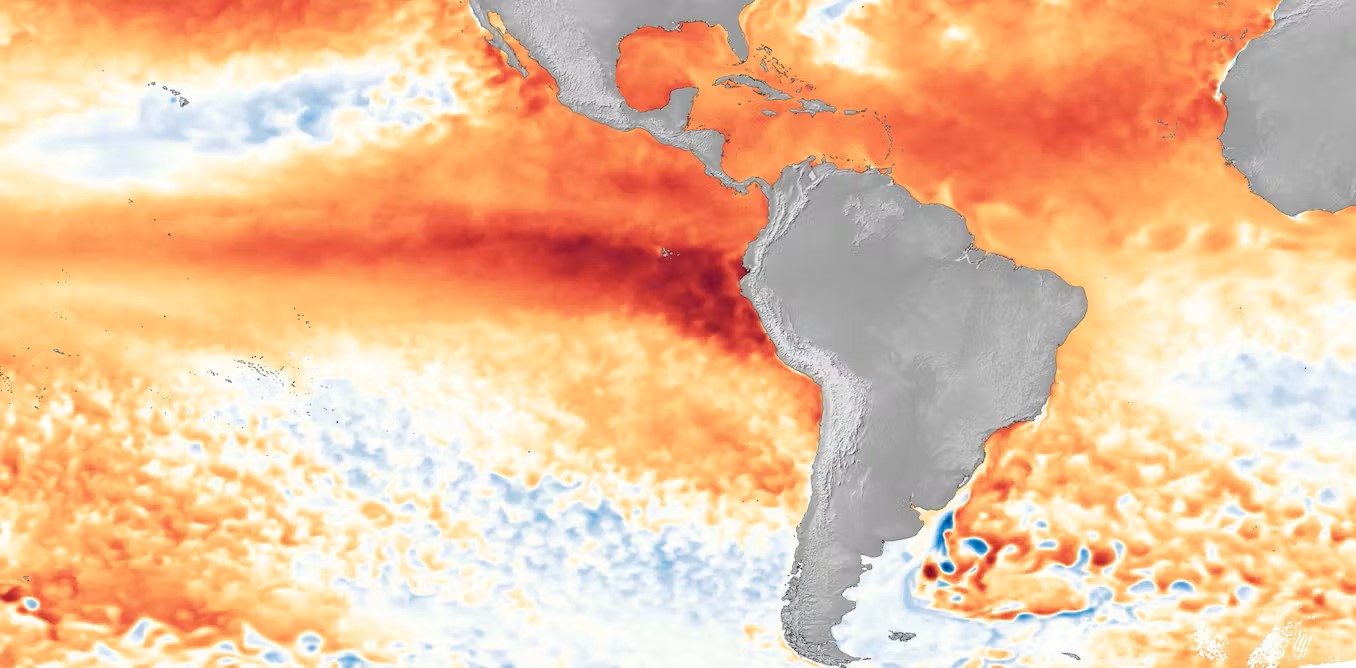
During ENSO’s warm El Niño phase, the east-to-west Pacific trade winds weaken and a giant pool of warm surface water moves east, occupying the surface from the central Pacific to the coast of South America. During the cool La Niña phase, the Pacific trade winds strengthen and push warm surface water toward the west Pacific, cooling the eastern and central Pacific.
Changing the geographic region where these warm pools release heat into the atmosphere alters the jet stream—the high-altitude river of air that steers weather systems. This influence on atmospheric circulation controls regional precipitation and evaporative demand, key factors for fuel drying and fire potential.

Finding the link between ENSO and regional fire activity
To conduct their analysis, the research team focused on regions within nine Geographic Area Coordination Centers, interagency groups which facilitate resource sharing and manage the logistics, mobilization, crews, aircraft, and equipment for wildland fires. They estimated the extent of large fires in each region from satellite imagery, and compiled data about precipitation and evaporative demand, or the thirst of the atmosphere, for overlapping three-month periods from 1984-2022 following El Niño and La Niña events. They also considered atmospheric pressure and sea surface temperatures to establish the physical links between ENSO and conditions in each geographic area.
La Niña associated with drought and fire
The analysis found that autumn La Niña events were associated with a greater than two-fold increase in the relative risk of extensive burns in the Southern, Southwest, and Rocky Mountain regions in the following spring. The analysis also found that the influence of La Niña lingered over the Great Basin and Northern California regions, increasing fire activity during the following summer.
By contrast, following an autumn El Niño, the likelihood of extensive burns was consistently halved in the Southern, Southwest, and Rocky Mountain during the following spring and summer due to higher precipitation and lower evaporative demand. At the same time, this large‐scale circulation promotes unusually high pressure over the northern tier, leading to an increased chance of large fires in the Eastern and Northern Rockies regions during the spring.
While the analysis provides a systematic diagnosis of how La Niña and El Niño influence the chances of extensive wildfire area will be burned across the contiguous U.S., the authors said additional research on wind speed, fuel moisture, and vegetation, as well as improved predictability of evaporative demand, will be needed to improve the skill of localized fire risk models.

For more information, contact the OAR Public Affairs Team at oar.pa@noaa.gov.

