
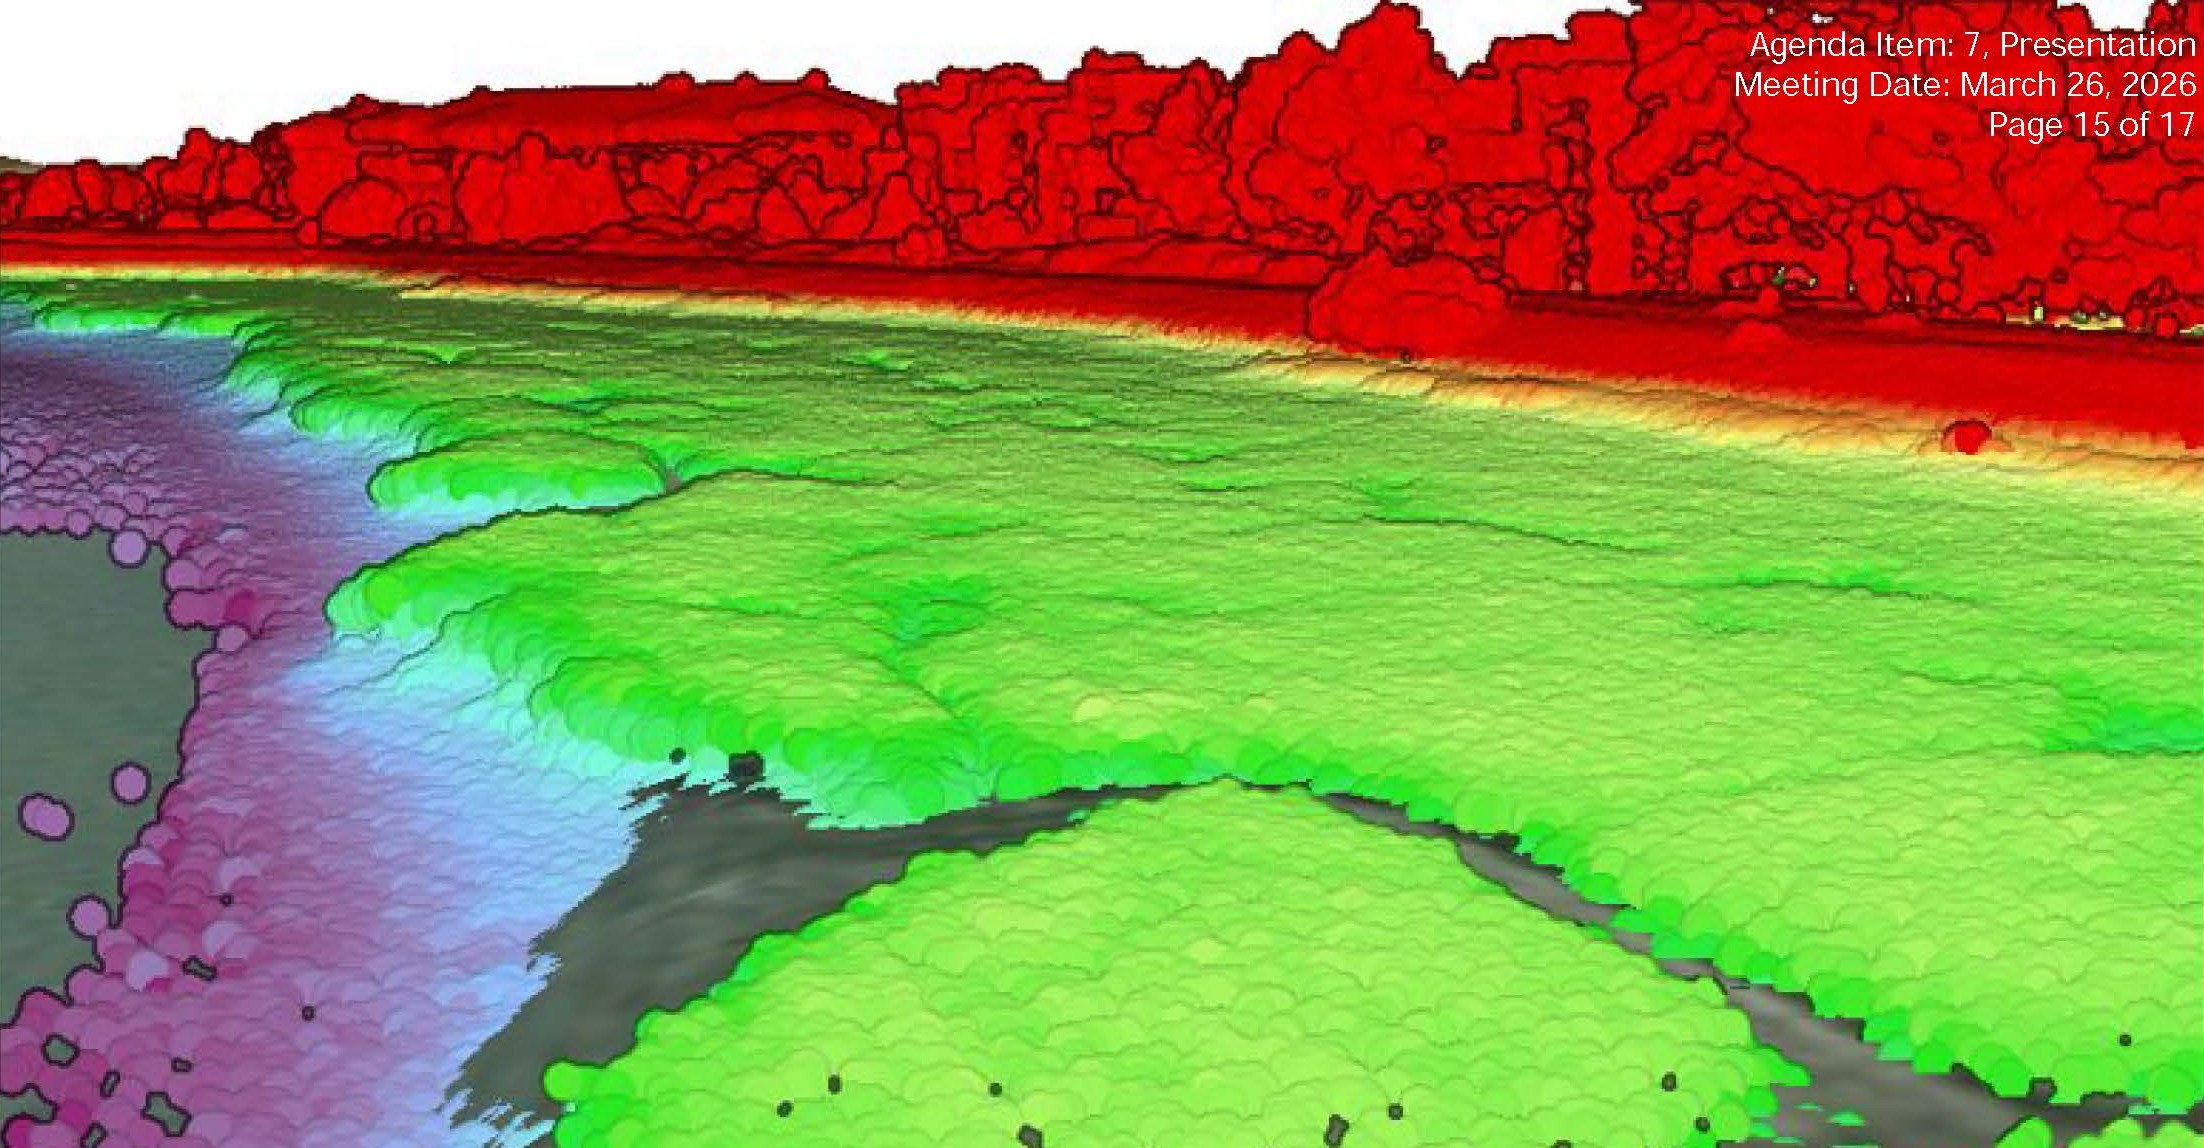
At the March Delta Stewardship Council meeting, the Delta Lead Scientist’s Report showcased a complete, high-quality elevation map of the entire Bay-Delta estuary—from the Golden Gate to the upper estuary. This marks the first time such a seamless dataset has been created, addressing long-standing challenges in regional mapping.
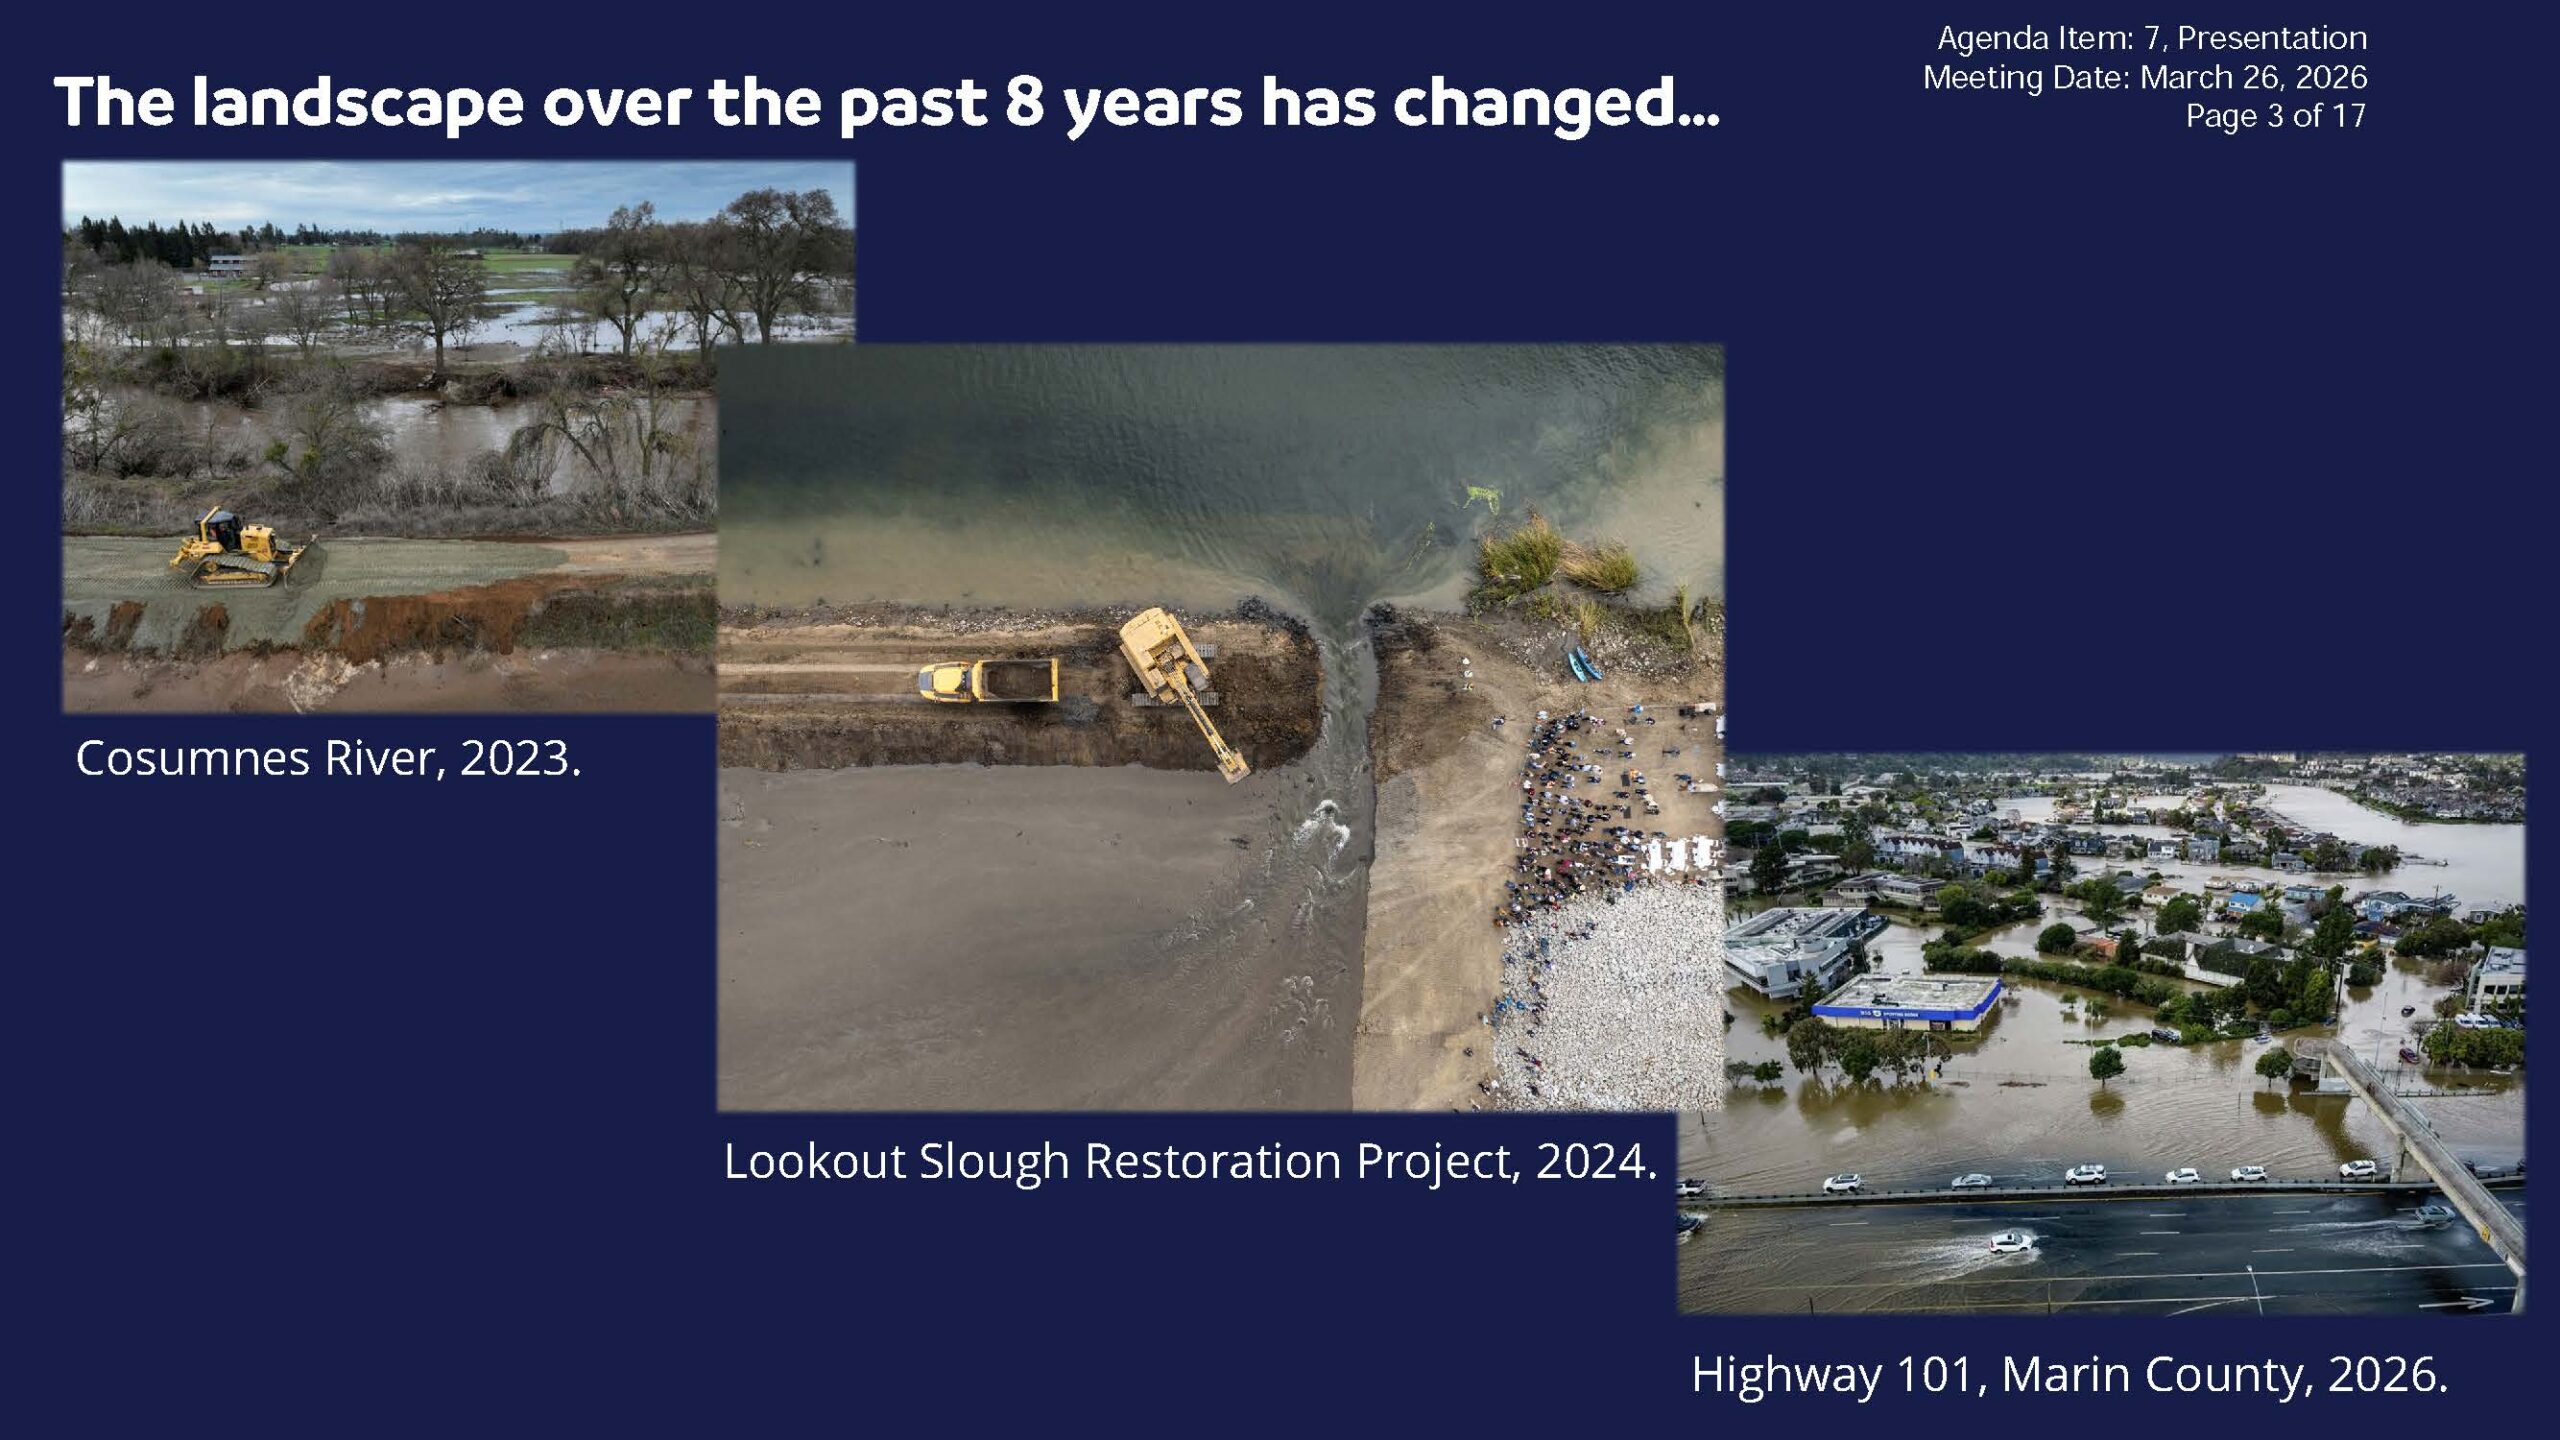 The Bay-Delta is a dynamic landscape, constantly reshaped by natural forces and human interventions. Recent events, such as levee breaches during 2023 storms on the Cosumnes River and intentional restoration projects like Lookout Slough, along with rising sea levels and flooding, such as the Highway 101 inundation in Marin County, further underscore the importance of precise mapping for flood risk assessment, restoration planning, and infrastructure protection.
Accurate, consistent elevation data enables better decisions. However, Bay-Delta mapping was previously patchy—collected for varying purposes, with different equipment and standards, across separate areas and years. As a result, agencies stitched datasets and filled gaps with estimates, adding uncertainty to flood protection, habitat restoration, and water management.
“It was like a quilt made from different scraps,” said Megan Nguyen, Science Program Analyst for the Delta Stewardship Council . “It covered the bed, but you couldn’t see the full picture. If you only cared about one site, it was fine. But to understand the whole system—how water moves between the bay and the Delta, where flood risk concentrates, and how restoration decisions ripple across the estuary—we need one consistent, high-quality map, not a patchwork. Everyone was collecting pieces, but nobody had the whole picture.”
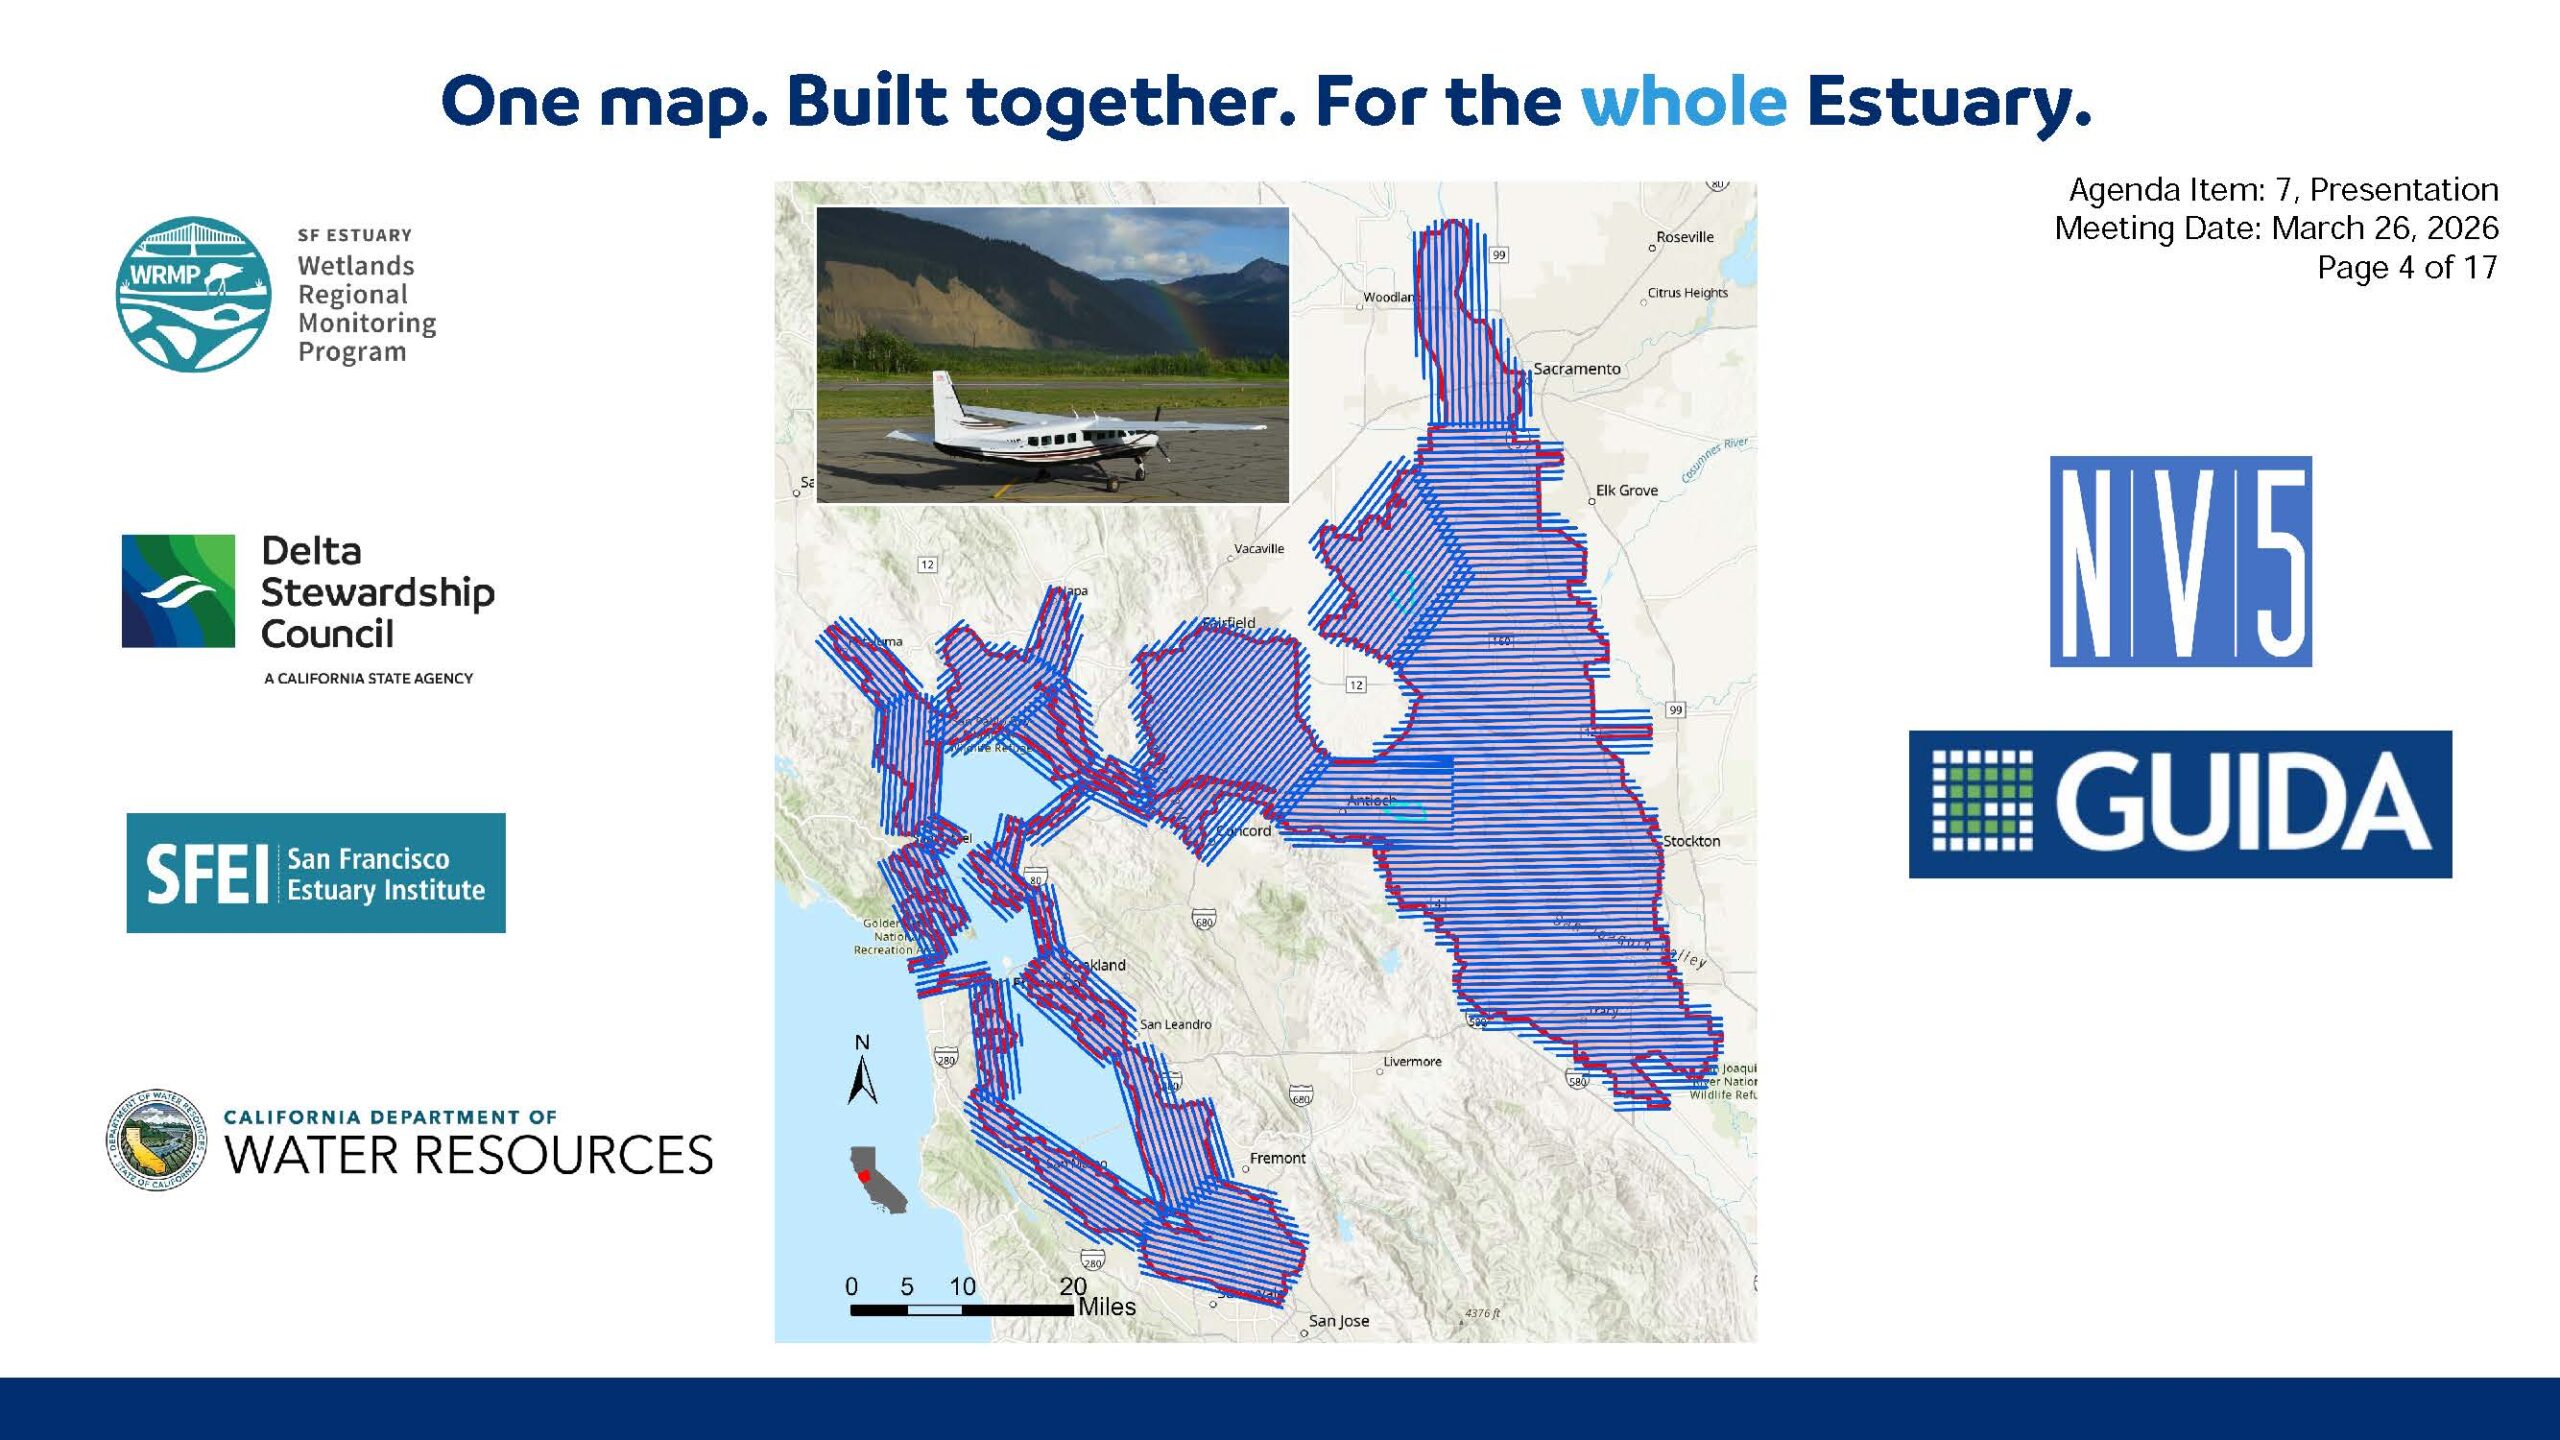 To address this, a collaborative effort led by the San Francisco Bay Wetlands Regional Monitoring Program brought together the Delta Stewardship Council, the San Francisco Estuary Institute, and the Department of Water Resources, with support from the South Bay Salt Pond Restoration Project and Santa Clara County Water District. The result is a comprehensive LiDAR survey that provides an unprecedented, unified view of the Bay-Delta’s elevation, offering critical insights for scientists, engineers, and planners alike.
The new seamless map offers greater visibility of ground features and improved vertical accuracy, crucial for areas where slight elevation changes affect water flow. Since the data was gathered during the summer when water levels and tides were at their lowest, the updated dataset provides more comprehensive details of river channels and wetlands than prior maps.
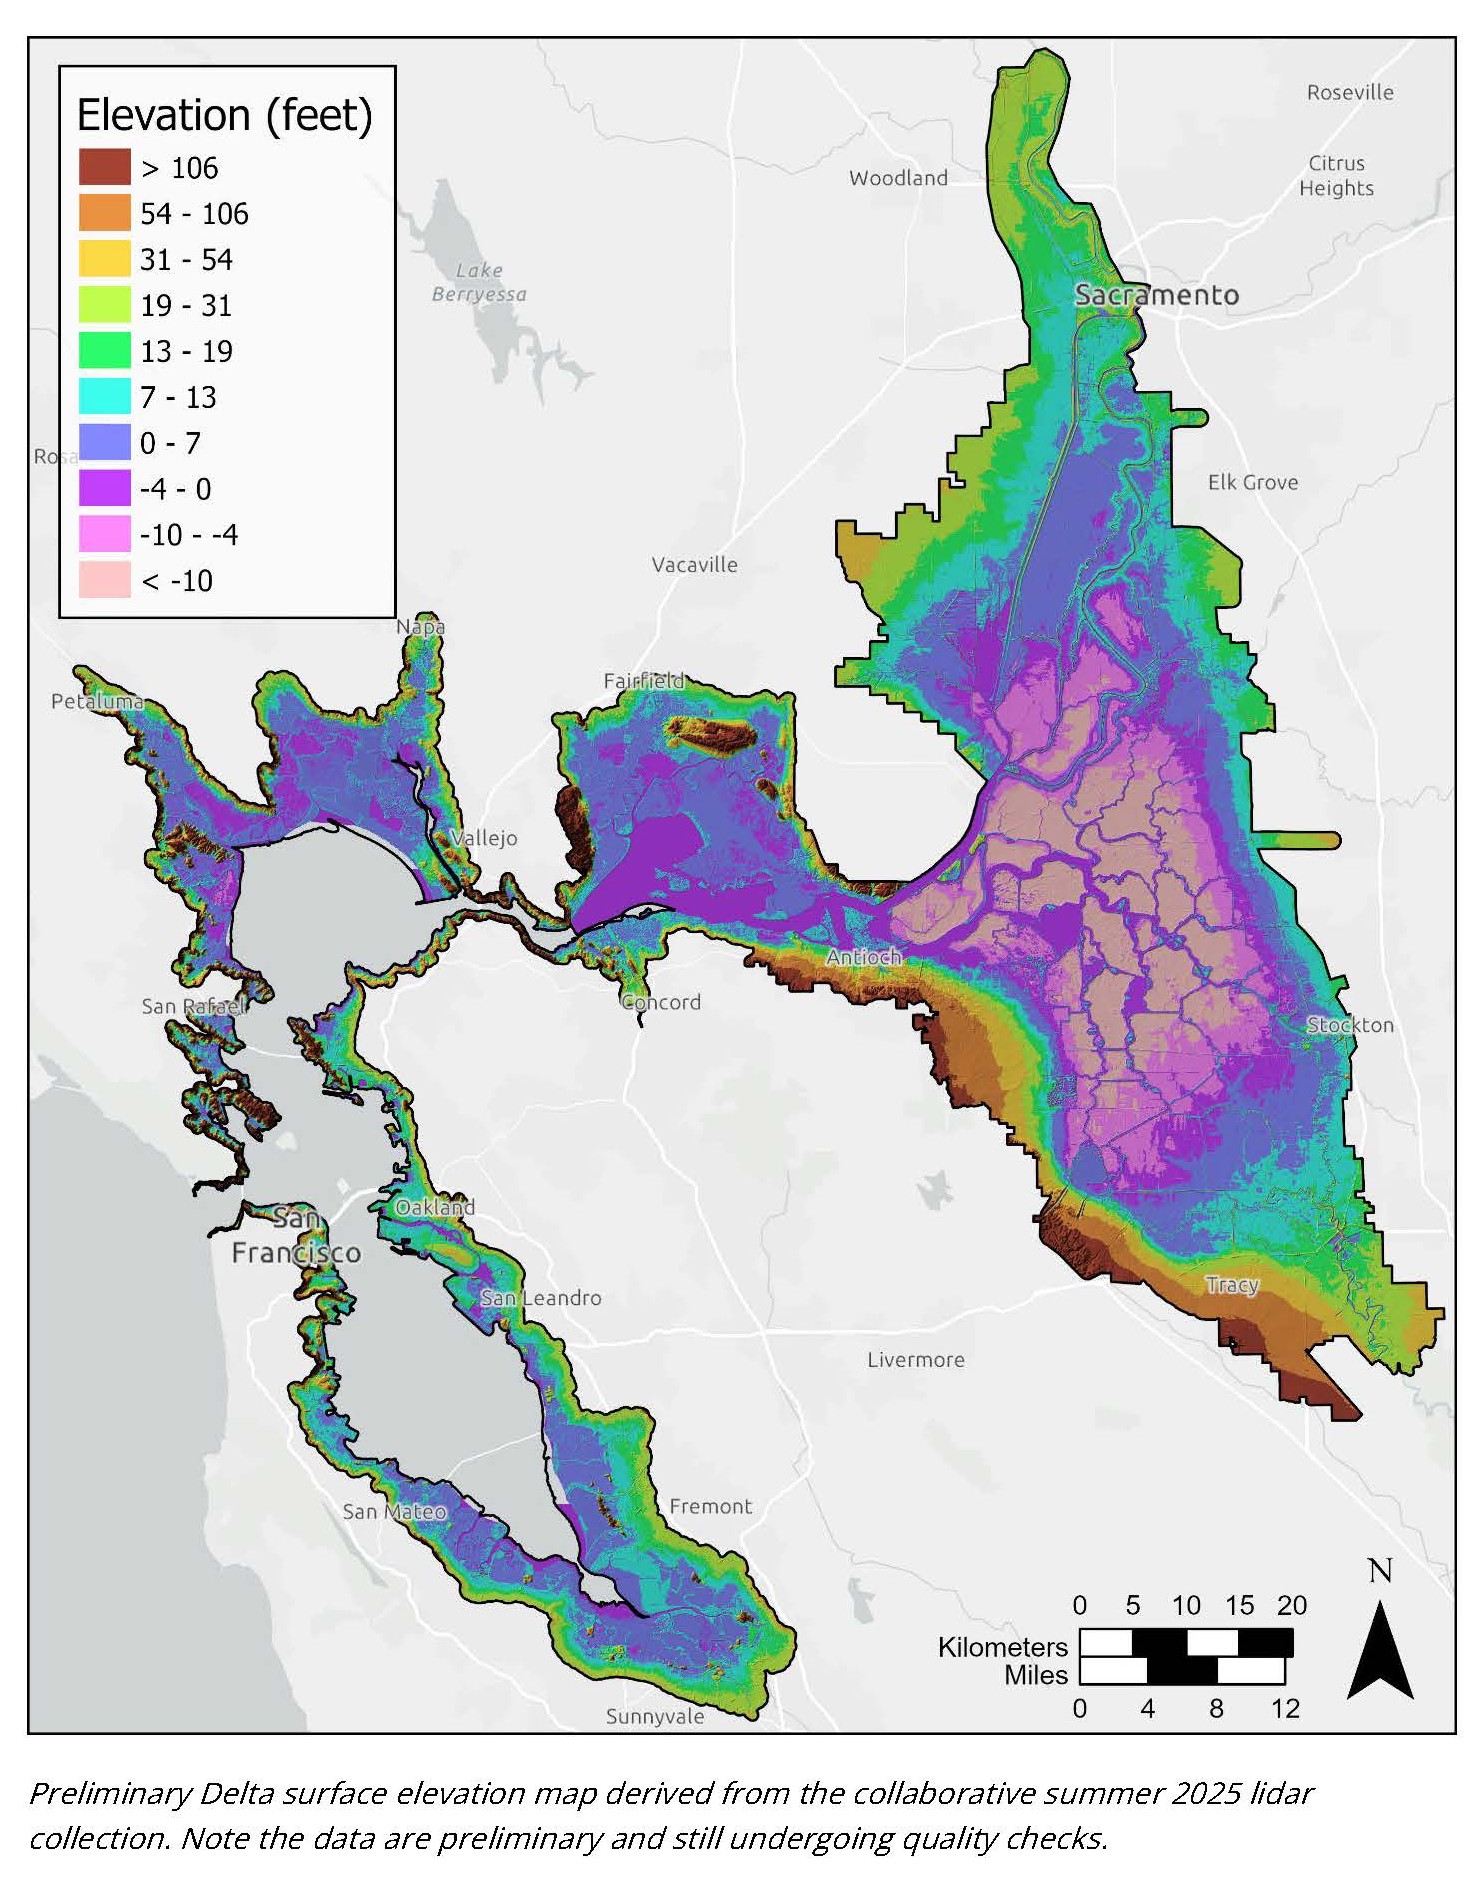
“It’s one map built together for the entire estuary. So for the first time, everyone in the Bay—Delta flood engineers, habitat scientists, infrastructure planners, the public, and more—will be looking at the same map. The map shows the landscape as it actually exists today,” said Ms. Nguyen.
Drilling down into the data
The Delta is a landscape of constant change. LiDAR data allows scientists to move beyond a regional view and examine how elevation shifts over time at specific locations. It can capture ground motion, subsidence, and the effects of restoration or development. The dataset also includes features such as vegetation and structures, providing a detailed, three-dimensional snapshot of the landscape. With that level of detail, the data can be used to closely examine how individual sites have changed on the ground.
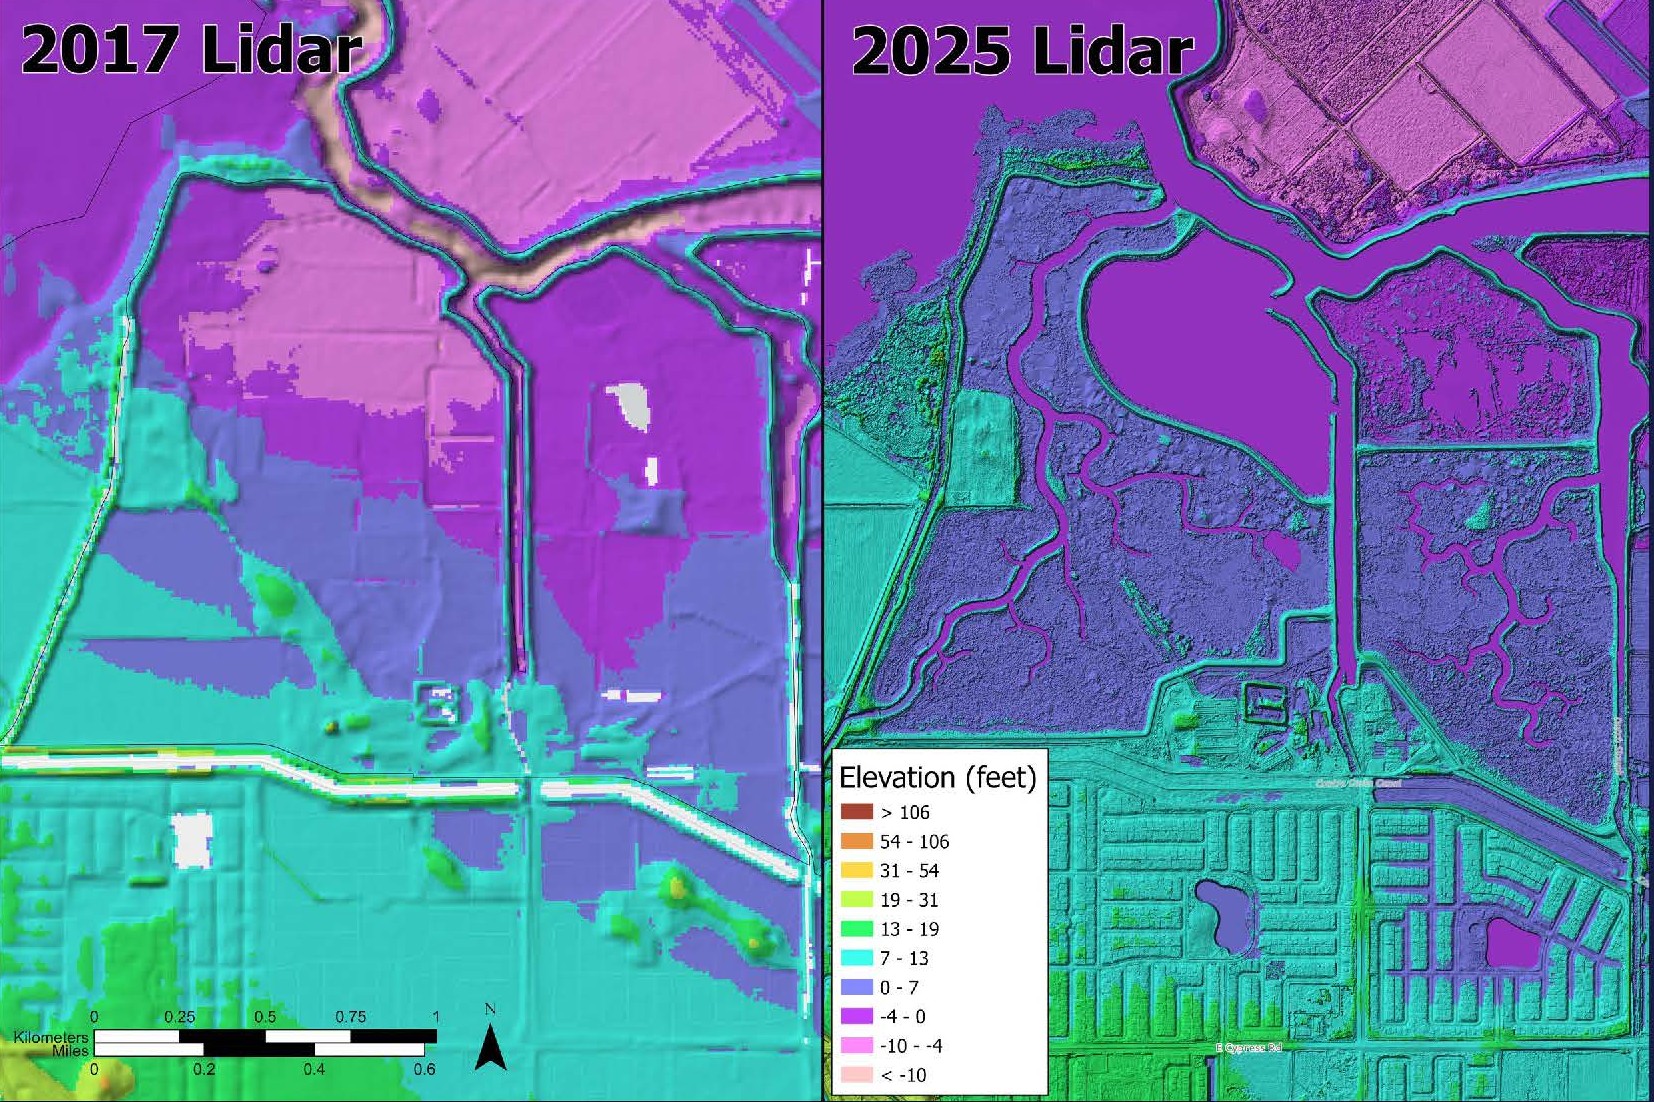 The slide shows the change in the Dutch Slough elevations from the 2017 LiDAR and the 2025 LiDAR. Dutch Slough was farmland and became the site of a large restoration project. Construction began in 2018. The 2025 LiDAR image shows the levee breaches and the resulting wetland habitats.
“Things have greatly changed on the ground between the two,” said Ms. Nguyen. “We have a tidal drainage system growing with finer resolutions of things like tidal creeks, channels, and vegetation.”
Alex Braud from the San Francisco Estuary Institute noted that while substantial effort goes into measuring and forecasting water levels for flood risk, having precise elevation data is equally crucial.
The new LiDAR dataset offers two key benefits. First, it enables the identification of vulnerable low-lying areas, especially where floodwaters might breach or overtop levees. Second, by comparing current data with earlier collections, we can monitor changes in the ground itself over time, such as erosion, land subsidence, or effects from new construction.
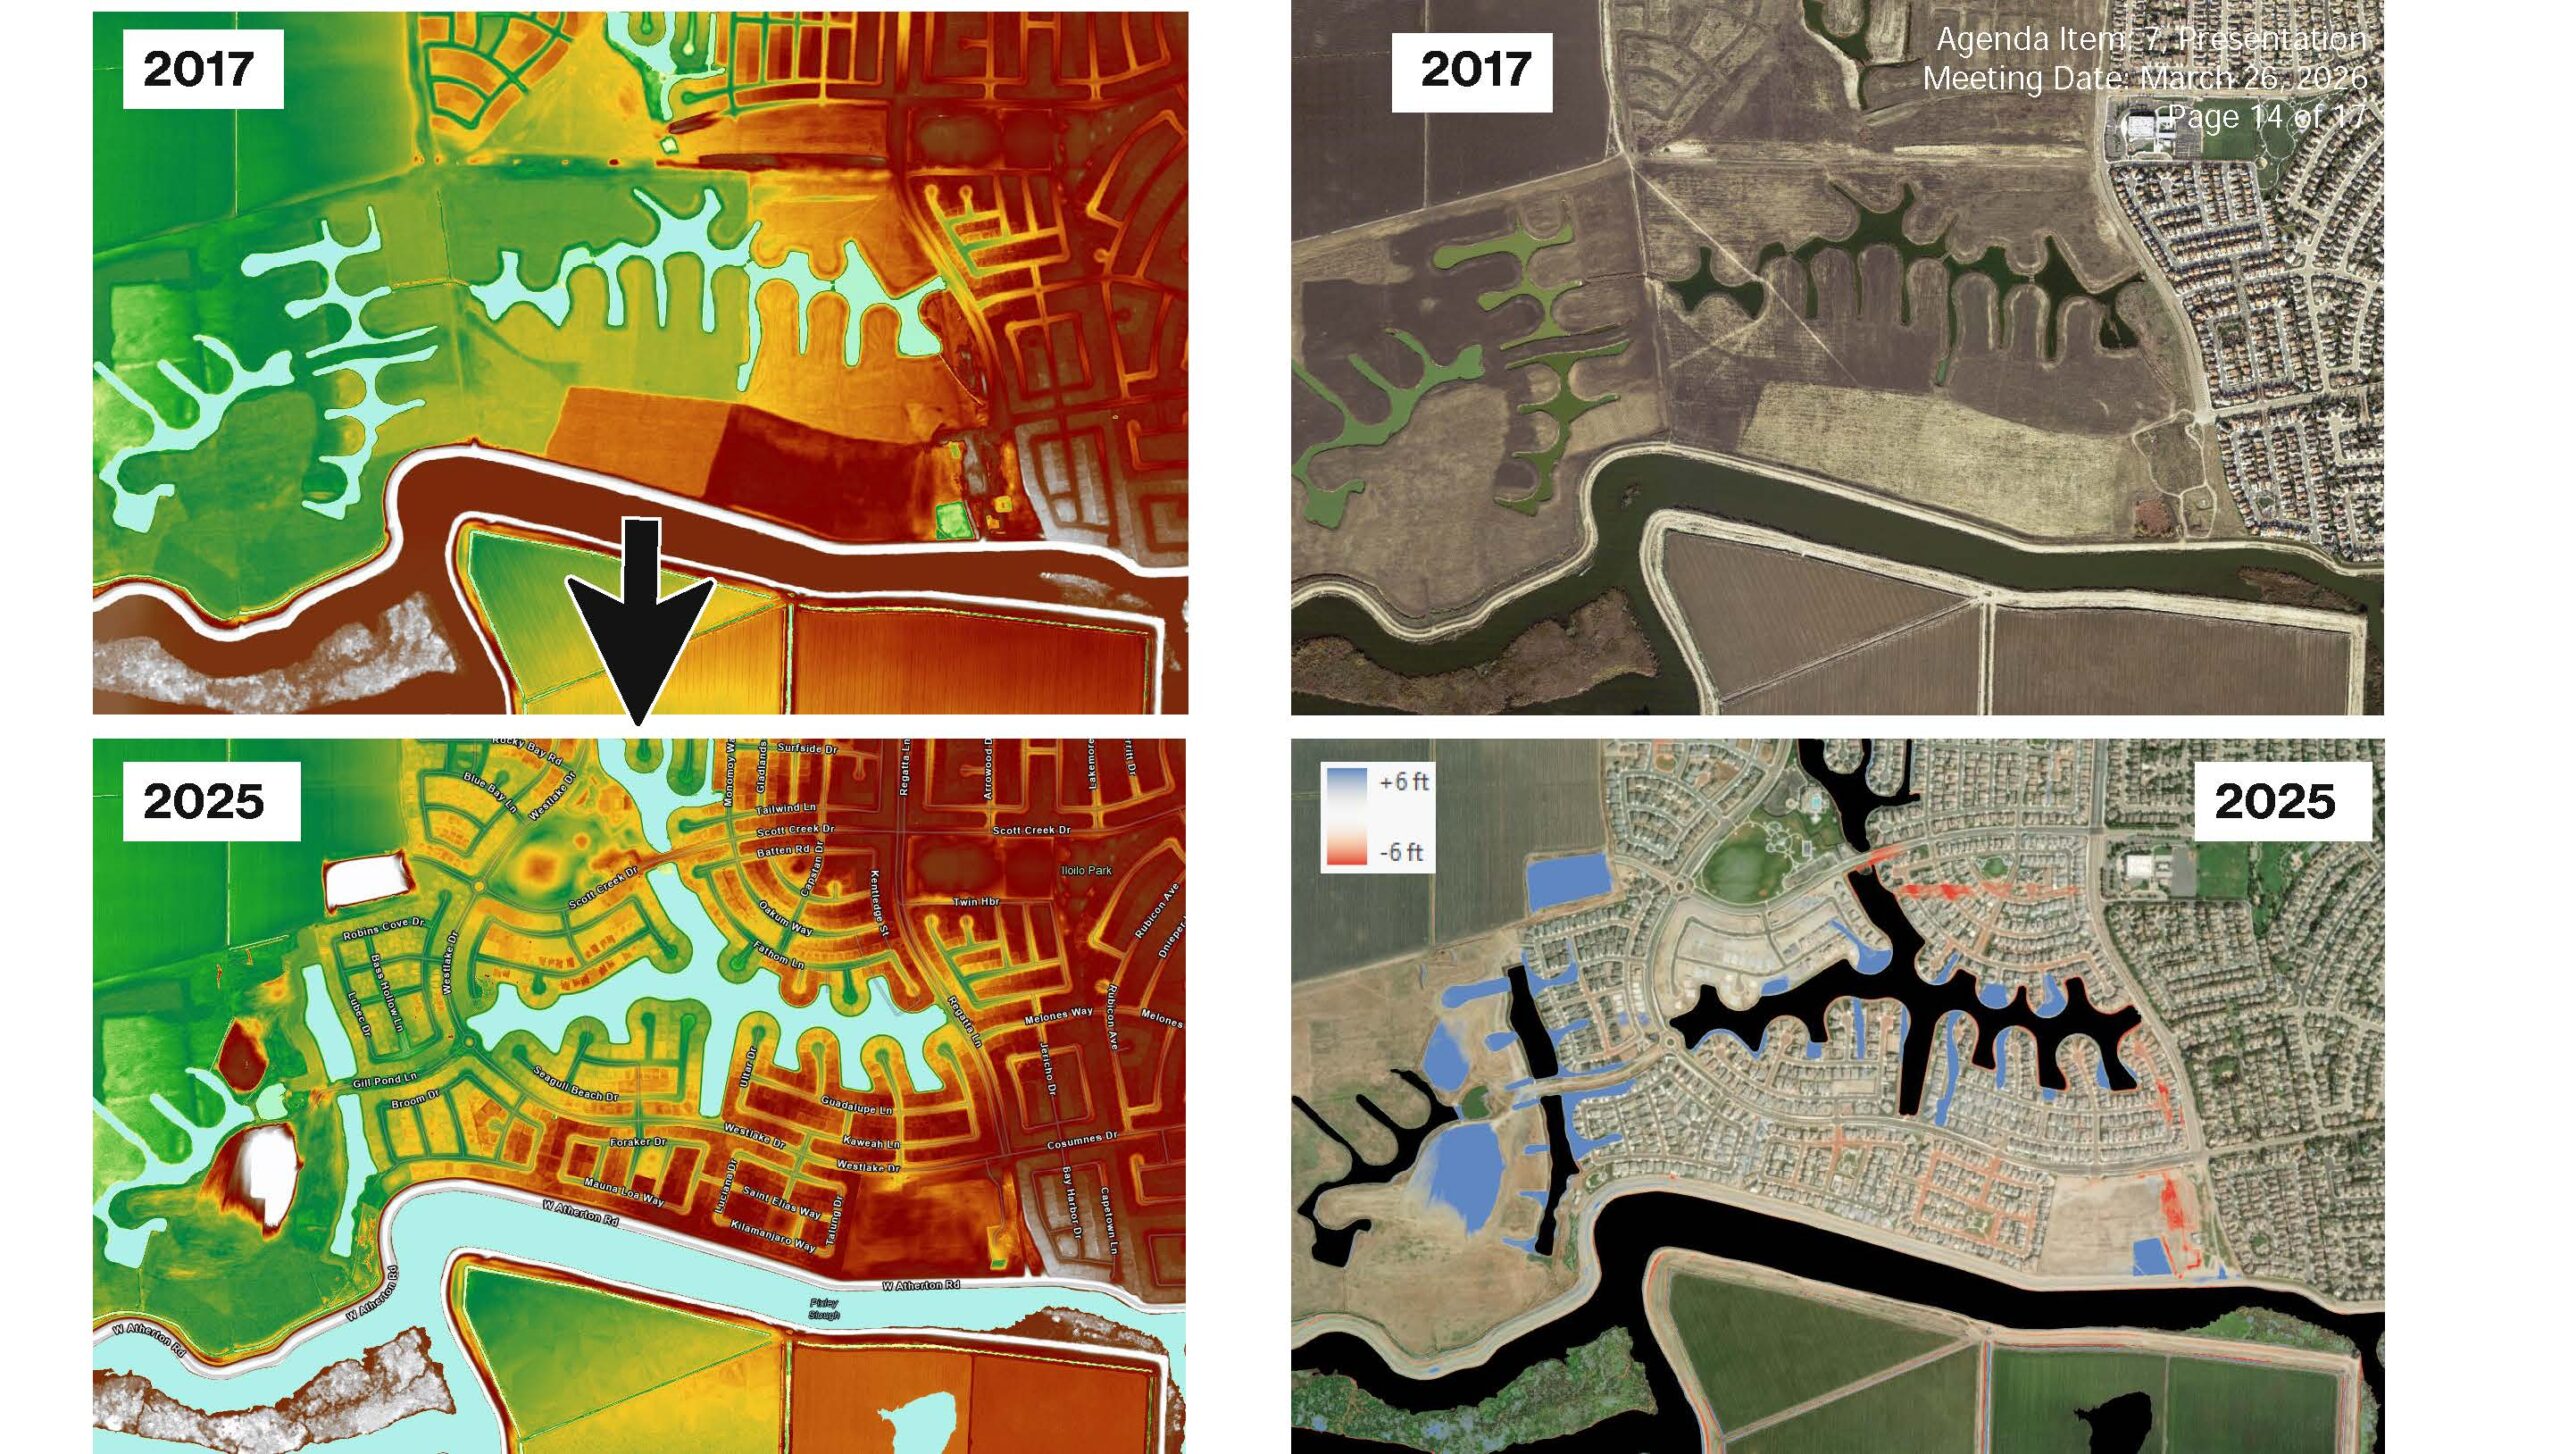 This slide illustrates how building a neighborhood affects land elevations. The top images, from 2017, depict the area prior to development; the bottom images show the neighborhood as it appears in 2025. Changes between these two data sets are highlighted: blue indicates areas where elevation has increased, while red marks places where elevation has decreased.
“I’ve spent my career trying to provide the kind of data analysis that leads to smarter decisions. This is a good example of that data that gives engineers, planners, and decision makers a common, accurate foundation to better prioritize where to adapt, and I’m proud to have contributed to it,” said Alex Braud.
 Next steps
The data is currently undergoing quality assurance and is anticipated to be released later this summer. It will be accessible through the California Natural Resources Agency’s open data portal. Subsequently, the maps are expected to be published on federal platforms such as NOAA’s Digital Coast and the USGS National Map, allowing users to conduct regional analyses at various scales.
“Our role facilitating these kinds of foundational layers is how the science program builds out our community so that we’re all looking at the same high-quality maps,” said Delta Lead Scientist Lisamarie Windham-Myers. “This can help people work across the landscape on issues that we all care about, like predicting water movement and mixing, prioritizing sites for ecosystem restoration, modeling flood risk, and ultimately tracking rates and directions of change.”
Click here for an information sheet.

New Delta mapping tool now online
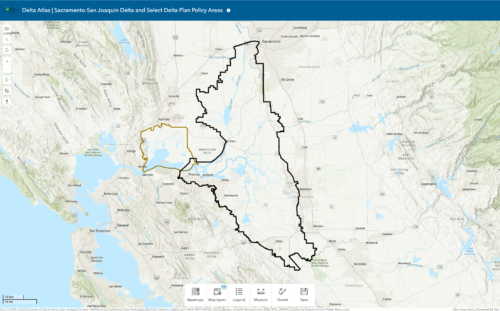 Also making a debut at the meeting was the Delta Atlas, a tool designed by Council staff to enhance visualization and planning efforts within the Delta region. This free, online interactive mapping tool is intended for use by Council staff, project proponents, and the general public.
With its user-friendly interface, the Delta Atlas provides access to a wealth of unique information, including Delta Plan policy layers and contextual data such as public lands. Users can explore its features to display data, search for specific locations, add place marks and sketches, and even export customized maps. Importantly, the Delta Atlas requires no specialized software or technical expertise, making it accessible to a wide range of users.
The Delta Atlas consolidates key spatial data for the Delta into a single convenient platform, providing a valuable resource for answering common questions, such as whether a location falls within the Delta’s boundaries. Beyond this, it provides administrative boundary layers, including cities, Legacy Communities, and the primary Delta, as well as layers that visualize Delta Plan policies, such as priority habitat restoration zones. These features make it easier to associate policies with specific locations, a task that was previously challenging. The tool also includes accessibility features such as screen reader navigation, keyboard shortcuts, and basic multilingual support.
Learn more in this blog post, Mapping the Delta, Made Simple, and click here to access the tool.
This article covers Agenda Item 8 (LiDAR) and Agenda Item 6B (Delta Atlas) from the March 26, 2026 Delta Stewardship Council meeting.

