

 The San Francisco Estuary is a dynamic and highly altered system that has experienced many changes since its widespread colonization by European-Americans in the 1800s. As a result of land use changes, overfishing, pollution, and other factors, many native and some introduced species have experienced drastic declines in abundance during the past 100 years.
Several agencies and research groups have operated regular fish surveys to track species declines, some dating back to the late 1950s. While most fish surveys are designed to track estuary-wide fish abundance, they vary in the total number of stations, the frequency of sampling, and the methods used for the survey. These constraints mean that a single survey likely does not capture all of the intricacies in long-term species trends.
To develop a more complete picture, UC Davis graduate student Dylan Stompe, along with Dr. Peter Moyle and Dr. John Durand, combined eight surveys that have operated continuously between 1980 and present into a spatially explicit integrated dataset, capturing 30 years of trends in estuary fish abundance at a much higher seasonal and spatial density than could be provided by any single survey. Through this work, trends in the distribution of several important estuary species can be examined over time.
At the 2021 Bay-Delta Science Conference, Dylan Stompe presented the results.
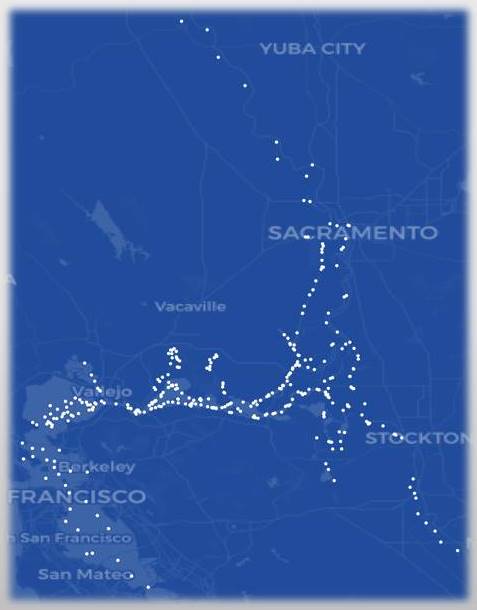 The San Francisco Estuary is extensively sampled for fish. The map shows the 421 stations sampled in 2017 by the 14 fish surveys operating for at least 15 to 20 years, representing a vast spatial breadth and density. However, these surveys were generally implemented in a piecework implementation style for specific mitigation and management goals and usually tracked one or very few species.
“Because of this piecework implementation style, they often have incompatible data formats and are largely independently leveraged because of this,” said Mr. Stompe. “Problems arise with this independent leveraging of the data sets in that we have a much lower spatial density when we only look at one of the surveys.”
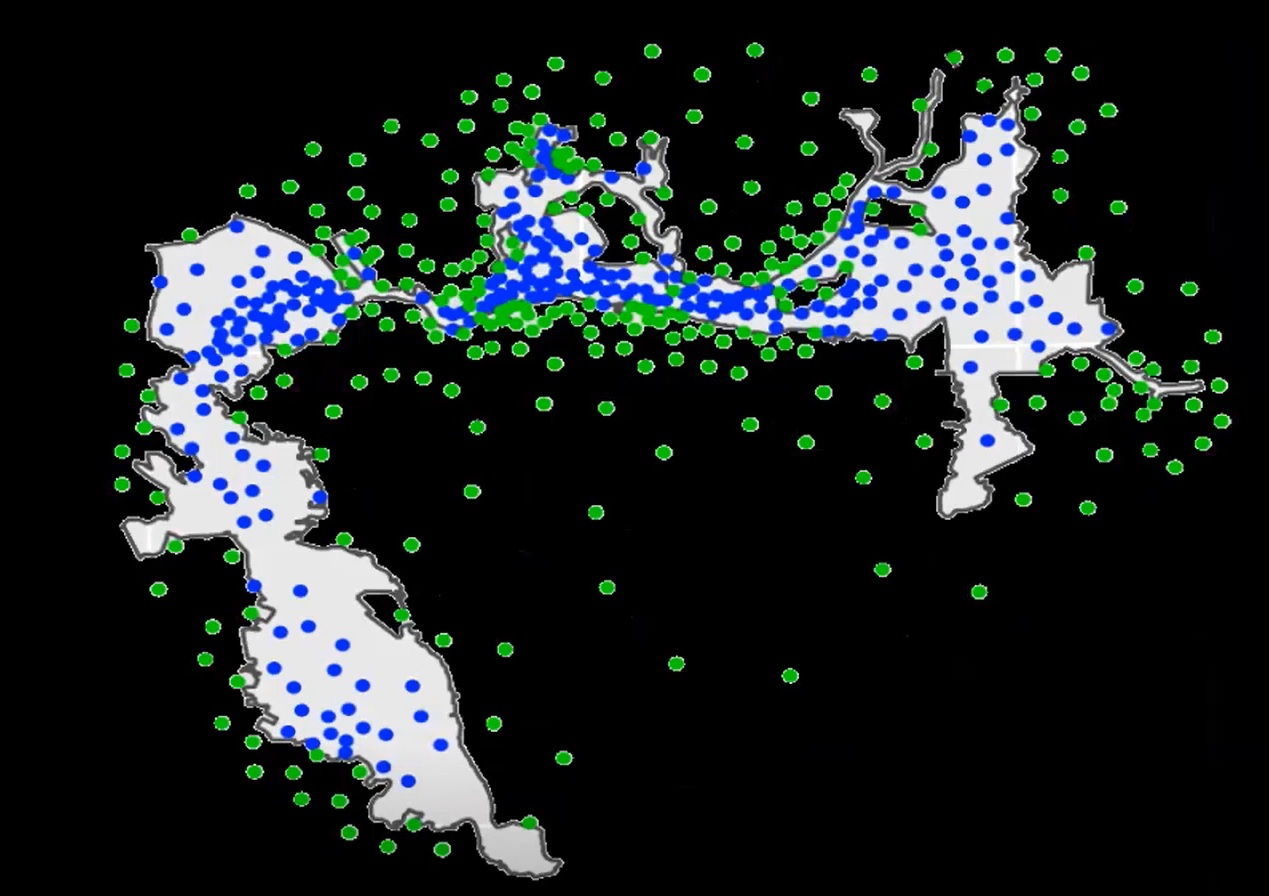
The slide on the lower left shows the 122 stations sampled for the Fall Midwater Trawl in 2017. He acknowledged it’s a lot of effort for a single survey, but even so, it’s just one-quarter of the total sampling effort within the estuary during this period. The Summer Tow Net survey, shown on the lower right, is less spatially explicit.


“It becomes apparent that a single survey analysis is not as powerful as looking at the entire data set,” said Mr. Stompe.
 Another issue with only analyzing at a single survey is selective capture efficiency. Since these surveys were designed to track one or very few species, the survey methods are generally tailored to most effectively capture those species. This can be problematic for non-target or bycatch species, which may not be efficiently captured with that type of survey. So when looking at bycatch species, it might not be a complete picture of their distribution or abundance.
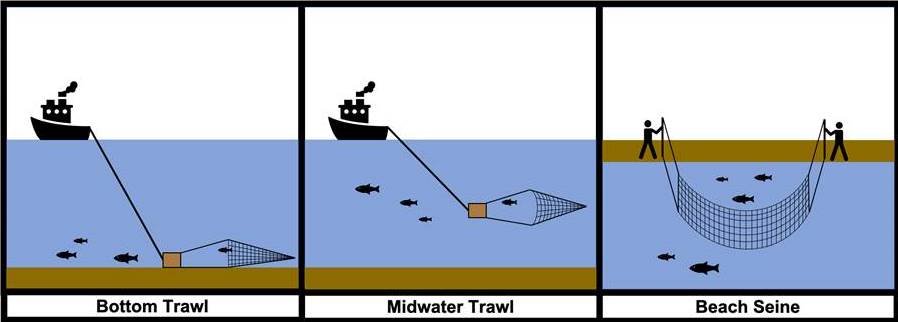
Likewise, a change in survey method that is effective for one species, such as midwater trawls in deeper pelagic habitats, to a less effective survey method for that species, like beach seines in shallow littoral habitats, could artificially be recorded as an abundance decline when in reality other factors are responsible.
To explore these issues. Dr. Peter Moyle, Dr. John Durand, Avery Kruger, and Mr. Stompe published the paper, Comparing and Integrating Fish Surveys in the San Francisco Estuary: Why Diverse Long-Term Monitoring Programs are Important, which combines the 14 fish surveys into an aggregate data set with over 274,000 individual sampling events, indexed by trawl or seine, with a total of 167 fish species represented.
“This makes it one of the richest if not the richest fish survey data sets in the world,” said Mr. Stompe.
They then narrowed it down slightly to the “8-survey index” by reducing the number of surveys down to the eight which have operated continuously between 1980 and the present. They further filtered this data to include only continuously sampled stations from 1980 to the present, ensuring that spatial sampling density was the same for every year.
The map on the lower right shows the resulting spatial extent for the eight survey index, with each one of the symbols on the map here representing one of the eight surveys. Mr. Stompe noted that the eight survey index results in a much more spatially explicit and dense dataset than would be provided by a single survey with the same standardization applied.

The data set was then used in a generalized linear mixed model with spatial and spatiotemporal autocorrelation fit to the spatial mesh; they then applied a spatial barrier, so the information sharing between the regions and that spatial mesh is constrained to only the wetted area, which gives a more accurate representation of regional trends and fish distribution within the estuary, as shown on the upper right.
Mr. Stompe then presented the model output for six different species. High density is represented by bright colors, low densities by dark colors. Delta outflow on the lower right represents wet and dry years.
Striped bass: Striped bass were present in high densities in Suisun Marsh starting in 1984. Striped bass, identified as one of the species in the Pelagic Organism Decline (POD), saw their populations drop in the Central and Southern Delta beginning around the year 2000. The central and southern Delta striped bass populations never returned to the densities that were present in the early 80s.
Delta smelt: Delta smelt were present in fairly high densities in the Sacramento River-Decker Island corridor and the central and northern Delta, and fairly high in Suisun. One of the POD species, populations started to decline after the year 2000. The last drought seems to have been especially impactful; there is a dramatic decline in abundance and constraining in density and not much of a return in that 2017 wet year.
Longfin smelt: Longfin smelt, another POD species, prefer somewhat saltier water than the bass or Delta smelt. They are generally found in the lower portions of the estuary and don’t really get up into the Delta, so they are a little insulated from whatever was driving the decline for the other species, but there is a system-wide decline. Interestingly, Mr. Stompe noted that there doesn’t appear to be any significant hotspots of density for the longfin smelt. All the declines are system-wide, not the result of constraining the population to a smaller portion of the estuary. The last drought really reduced the density and catch.
American shad: This is not one of the POD species. We have high densities in the central and southern Delta and low moderate in the Suisun and Decker Island corridor. We see a very pulsing distribution pattern with these guys. We’ll start to see that central and southern Delta cool down a little bit, populations moving north into Suisun a little bit more. A pretty drastic decline through that last drought. Not much of a significant recovery in that 2017 wet year.
Threadfin shad: Threadfin shad, also one of the POD species, were present in very high densities in the central and southern Delta, moderate to high in Suisun in the early portion of the period. However, at the tail end of the POD period, where they were present in high densities are now lower density regions. The population is fairly constrained to this Sacramento River Corridor and upper Suisun areas.
Sacramento splittail: This is not one of the POD species. They are present in high density in Suisun Marsh and Suisun Bay, moderate density within the Delta. There is a fairly strong, wet year signal with this fish; they spawn on floodplains which shows in the wet years.
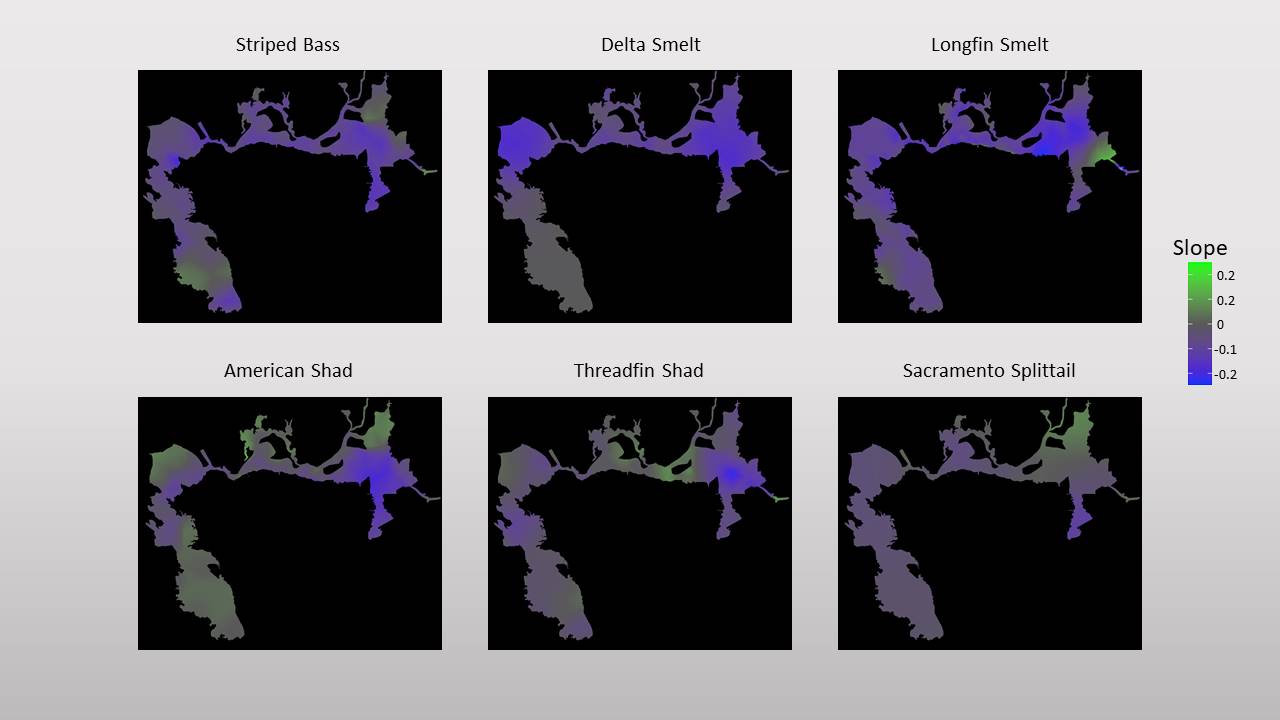 Another output from the model was the slope of those prediction points over the model period. Green represents a positive slope or increasing density; blue represents decreasing slope or decreasing density.
“Looking across all these different plots that in general, there’s more blue than green with a couple of notable exceptions,” said Mr. Stompe. “American shad appear to be increasing in density in Suisun Marsh and the north Delta; threadfin shad in upper Suisun and Decker Island- Lower Sacramento River Corridor, and Sacramento splittail in the northern portions of the Delta. We saw some of this with threadfin shad really constraining their population as they experienced declines in the central and southern Delta.”
Mr. Stompe noted the many uses for these results. “This is a really great intuitive summary of fish distribution and abundance as it’s really easy to look at these plots and get an idea of what’s been going on with a specific species over a certain time period,” he said. “It’s essential for hotspot or refuge habitat analysis. Identifying areas that are increasing abundance or historically been high-density habitats for these species could potentially be areas where we want to focus our management or habitat restoration dollars so that we can get the most bang for our buck with our limited funds.”
“Some of our species that are not caught in high enough numbers to be tracked anymore, such as Delta smelt, so we can use some species that are still abundant enough with similar distributional patterns to track the distributional changes and pinpoint our management and restoration to benefit them and see some of the response in those indicator species and know that it might be helping the other species.”
“For some of these species we don’t actively manage or track, kind of like Sacramento splittail, it’s beneficial to identify changes in distribution or abundance before it becomes an issue, so we can manage for these species before they are species of special concern or are listed.”
As for future steps, they plan on running the models using the entire 421 station data set over shorter timescales and asking more complex questions, such as the effects of climate and water management on fish distribution.
“Using a higher density model, we should be able to pull out some more granular distributional changes and get a better idea of what the exceptional drought and exceptional flood years as well as what South Delta pumping and upstream water management are doing to fish distribution and abundance in the short term,” Mr. Stompe said. “For some of these species we don’t actively track or manage, we plan on looking into these and seeing if there’s something that we should be paying attention to and what’s going on with these populations.”
Q&A
QUESTION: Are these annual mean catch? And also, some of the species, like American shad and striped bass, are migratory, so how should we interpret the results for these species, given that some survey sample only a single season?
“These are the mean annual catch per station,” replied Mr. Stompe. “We’re operating under the assumption that these surveys, especially for striped bass and American shad, are going to be primarily catching essentially one-year-old fish. So we’re assuming that the highly migratory older individuals are pretty poorly represented in this data. That’s something we’ll be looking into as we dive a little deeper into this, though.”
QUESTION: How would your maps look if you had to account for the fish’s responses to the moving salinity fields?
“Looking at it in conjunction with Delta outflow gets at that a little bit,” said Mr. Stompe. “That’s yearly Delta outflows. There’s a lot of information that we’re not getting with that. So these models don’t have any environmental predictors in them right now. We plan on building them out a little more later on. And that’s definitely something we’ll look at. My guess is that those distributions will shift with the changing X2.”
QUESTION/COMMENT: I would include the more recent 22 stations in the fall midwater trawl next time. We catch most of our shad species in the Deepwater Ship Channel these days, so you’re missing out on an important region for them. Any comments on that?
“That’s a great point,” said Mr. Stompe. “With our expanded analysis, looking at more recent years with that full 421 stations, that will definitely have the Deep Water Ship Channel in there. I believe the Summer Tow Net and at least one other survey is in there as well. So we’ll have pretty good representation in that region and hopefully have a much clearer picture of shad or smelt distribution up there.”
QUESTION: Why do you think the density of these fish species within the central and southern Delta have declined so dramatically while the Suisun region generally appears to be okay?
“I think that’s a habitat thing,” said Mr. Stompe. “The central and southern Delta is not great native fish habitat anymore – it’s super clear, not a ton of food, lots of lots of Egeria and largemouth bass, and it’s more lake habitat than what these fish have adapted to. So the Suisun Marsh, in general, has much higher turbidity, and we don’t have those huge stands of Egeria everywhere and hyacinth and whatnot. And a lot more food for these native and similar introduced species.”
PAPER: Comparing and Integrating Fish Surveys in the San Francisco Estuary: Why Diverse Long-Term Monitoring Programs are Important
Authors: Dylan K. Stompe, Peter B. Moyle, Avery Kruger, John R. Durand
 Many fishes in the San Francisco Estuary have suffered declines in recent decades, as shown by numerous long-term monitoring programs. A long-term monitoring program, such as the Interagency Ecological Program, comprises a suite of surveys, each conducted by a state or federal agency or academic institution. These types of programs have produced rich data sets that are useful for tracking species trends over time. Problems arise from drawing conclusions based on one or few surveys because each survey samples a different subset of species or reflects different spatial or temporal trends in abundance. The challenges in using data sets from these surveys for comparative purposes stem from methodological differences, magnitude of data, incompatible data formats, and end-user preference for familiar surveys. To improve the utility of these data sets and encourage multi-survey analyses, we quantitatively rate these surveys based on their ability to represent species trends, present a methodology for integrating long-term data sets, and provide examples that highlight the importance of expanded analyses. We identify areas and species that are under-sampled, and compare fish salvage data from large water export facilities with survey data. Our analysis indicates that while surveys are redundant for some species, no two surveys are completely duplicative. Differing trends become evident when considering individual and aggregate survey data, because they imply spatial, seasonal, or gear-dependent catch. Our quantitative ratings and integrated data set allow for improved and better-informed comparisons of species trends across surveys, while highlighting the importance of the current array of sampling methodologies.

