

Dr. Tina Swanson gives her analysis of the standard; has it really resulted in increased Delta outflow?
Fresh water flowing into the Delta is highly contested and tightly managed. The current regulations for spring outflows were established in 1995, following a severe multi-year drought, lawsuits, fish population declines and several Endangered Species Act listings. These new standards were designed to provide outflows to the San Francisco Bay that reflect variation in hydrological conditions, prevent extreme low inflows, and improve low salinity habitat. However, since then, fish populations have continued to decline.
So how effective has the 1995 spring outflow standards been in achieving its objectives? Dr. Christina Swanson, Director of the NRDC’s science center, gave this presentation at the Bay Delta Science Conference of her analysis the implementation of the standards established more than 20 years ago and their effect on seasonal flow amounts and low salinity habitat in the Delta.
The data available in the mid-1990s was that freshwater outflows to the estuary were declining, the quality and quantity of estuarine habitat, particularly low salinity habitat, was declining, and fish abundance was declining. “In fact, analyses of these data indicated that in fact all of these factors were related,” she said. “Those are the data that in part drove the establishment of new water quality standards for the estuary in the form of the 1995 water quality control plan.”
 The spring outflow standard element of the 1995 plan was put in place specifically to regulate outflows from the Delta into the estuary for the purpose of protecting and improving low salinity estuarine habitat and improving the conditions for fish and wildlife. The spring outflow standard had a number objectives, one of which was to prevent the extreme low flows that had occurred during the drought period in the early 1990s.
“It was also designed explicitly so that the standard for each year and each month would reflect hydrological variation, so that more water would be required to meet the standard in wet years than it was in dry years,” Dr. Swanson said. “It was designed specifically to reflect that variation in the required flows, and it was also designed to protect the estuary and outflow conditions from abrupt changes associated with flood control operations, in particular the shutting off of flood control operations there wouldn’t be abrupt decreases in Delta outflows associated with management of the upper watershed.”
The standard is based on three compliance locations within the upstream portion of the estuary. The most downstream compliance point is Port Chicago and the most upstream is at Collinsville near the confluence of the Sacramento and the San Joaquin Rivers. “Each of those compliance points is both a geographic location, but it’s also associated with a specific flow level that when that flow level was occurring, it corresponded to a specific location of low salinity habitat described and defined in terms of X2, which is the location of the 2 ppt isohaline in the estuary measured in terms of kilometers upstream from the Golden Gate,” she said. “Each of those compliance points is associated with a specific flow level and a specific X2 location, which is also expressed and measured in terms of EC and a particular EC = 2.64.”
 Dr. Swanson pointed out that it’s a complicated standard that is in effect for the five months from February 1 to June 30. “It layers a number of requirements,” she explained. “It starts with a minimum outflow requirement of 7100 cubic feet per second each day at the Collinsville compliance location and you could meet it by either having 7100 cfs flow there coming out of the Delta, or an EC measurement of 2.64 micromos per centimeter at the Collinsville location.”
“On top of this minimum flow level, there are additional required flows layered on that that are based on hydrological conditions in the upper watershed,” she continued. “Those are based on and derived from measurements of the 8-station index, which an index of the full natural flow conditions into the reservoirs of the eight largest rivers in the watershed. Based on the 8-station index of the previous month, for each month between the February 1 and June 30 period, the standard will require additional days of flow of 11,400 cfs or an EC value of 2.64 at the next compliance point downstream, Chipps Island, and potentially additional number of days of even higher flows of 29,200 cfs or an EC of 2.64 at the Port Chicago location. Those additional days are quantified in terms of number of days within that month, and they’re based on that previous month’s runoff in the upper watershed.”
In order to determine what the standard is, you need to know what the 8-station index is, and then consult a table contained within the State Water Board water quality control plan document to figure out the number of days for each of these different flow levels that are required, she said.
Dr. Swanson noted that there are exceptions built into the standard. “One of them says that you can relax the standard in exceptionally dry years and exceptionally dry months,” she said. “There’s another that has to do with whether or not you actually have to provide and comply with the Port Chicago flows; this is referred to as the Port Chicago trigger which says that on the last day of the month previous to the month for which you’re setting the study, if the EC at the Port Chicago compliance location already exceeds 2.64, then even if, based on upstream hydrology there were going to be a number of Port Chicago high flows required, you don’t have to do it. So, in order to be required to do the 29,200 cfs flows at Port Chicago, the EC at Port Chicago on the last day of the month before your next compliance month starts has to be below 2.64, and if it’s not, you don’t have to do those flows.”
 “It’s a somewhat complicated standard,” she said. “This standard was established in 1995; however, since that time as shown in this graph, while for the first year fish abundance numbers were relatively stable and relatively high, this happened to be a fairly wet period. Since then, fish abundance numbers have continued to decline to now record-low levels. Since the standard was designed and implemented in part with the expectation that it would be protecting fish, this was the spring period which we know is very ecologically important in the system and to the fish, but in fact even after the establishment and implementation of this standard, fish numbers have gone down to record low levels.”
“This has prompted a number of stakeholders in the system to suggest that it really is an indication that the flow really isn’t important to these fish, since the spring outflow standard hasn’t provided the benefits that it was supposed to, and since it neither really protected the fish nor recovered them, maybe there really is no relationship with flow,” she said.
“Jason Peltier of the Westlands Water District has said that we’ve been doing 20+ years of trying to increase flows in a meaningful way to help fish and none of that has worked,” she said. “So partly based on that, and partly based on the fact that we should be doing this, I decided to ask the question, have we really increased flows in a meaningful way with this standard?”
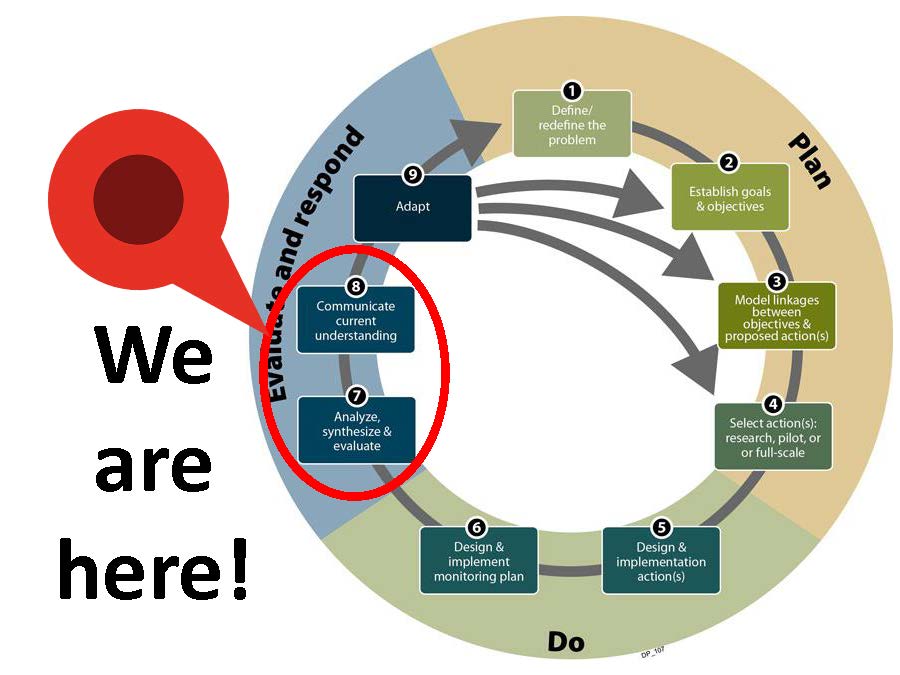 “This is a really appropriate question to ask and is particularly appropriate as a talk for this conference because in fact, I’m going to argue that the 1995 water quality standards and in particular, the spring outflow standard, was and is an exercise in adaptive management,” said Dr. Swanson.
“We based our management action of very well documented science and statistically significant science based relationships between environmental drivers and biological responses. We implemented it and we’ve been monitoring the system ever since. We know now the State Water Board is getting ready to reevaluate those standards, so now is the time to do what we’re supposed to do right here, which is to analyze and synthesize the results of our monitoring to evaluate the effects of that action and based on that, whether we need to adjust the action or something else. In other words, to close the loop in the adaptive management wheel here.”
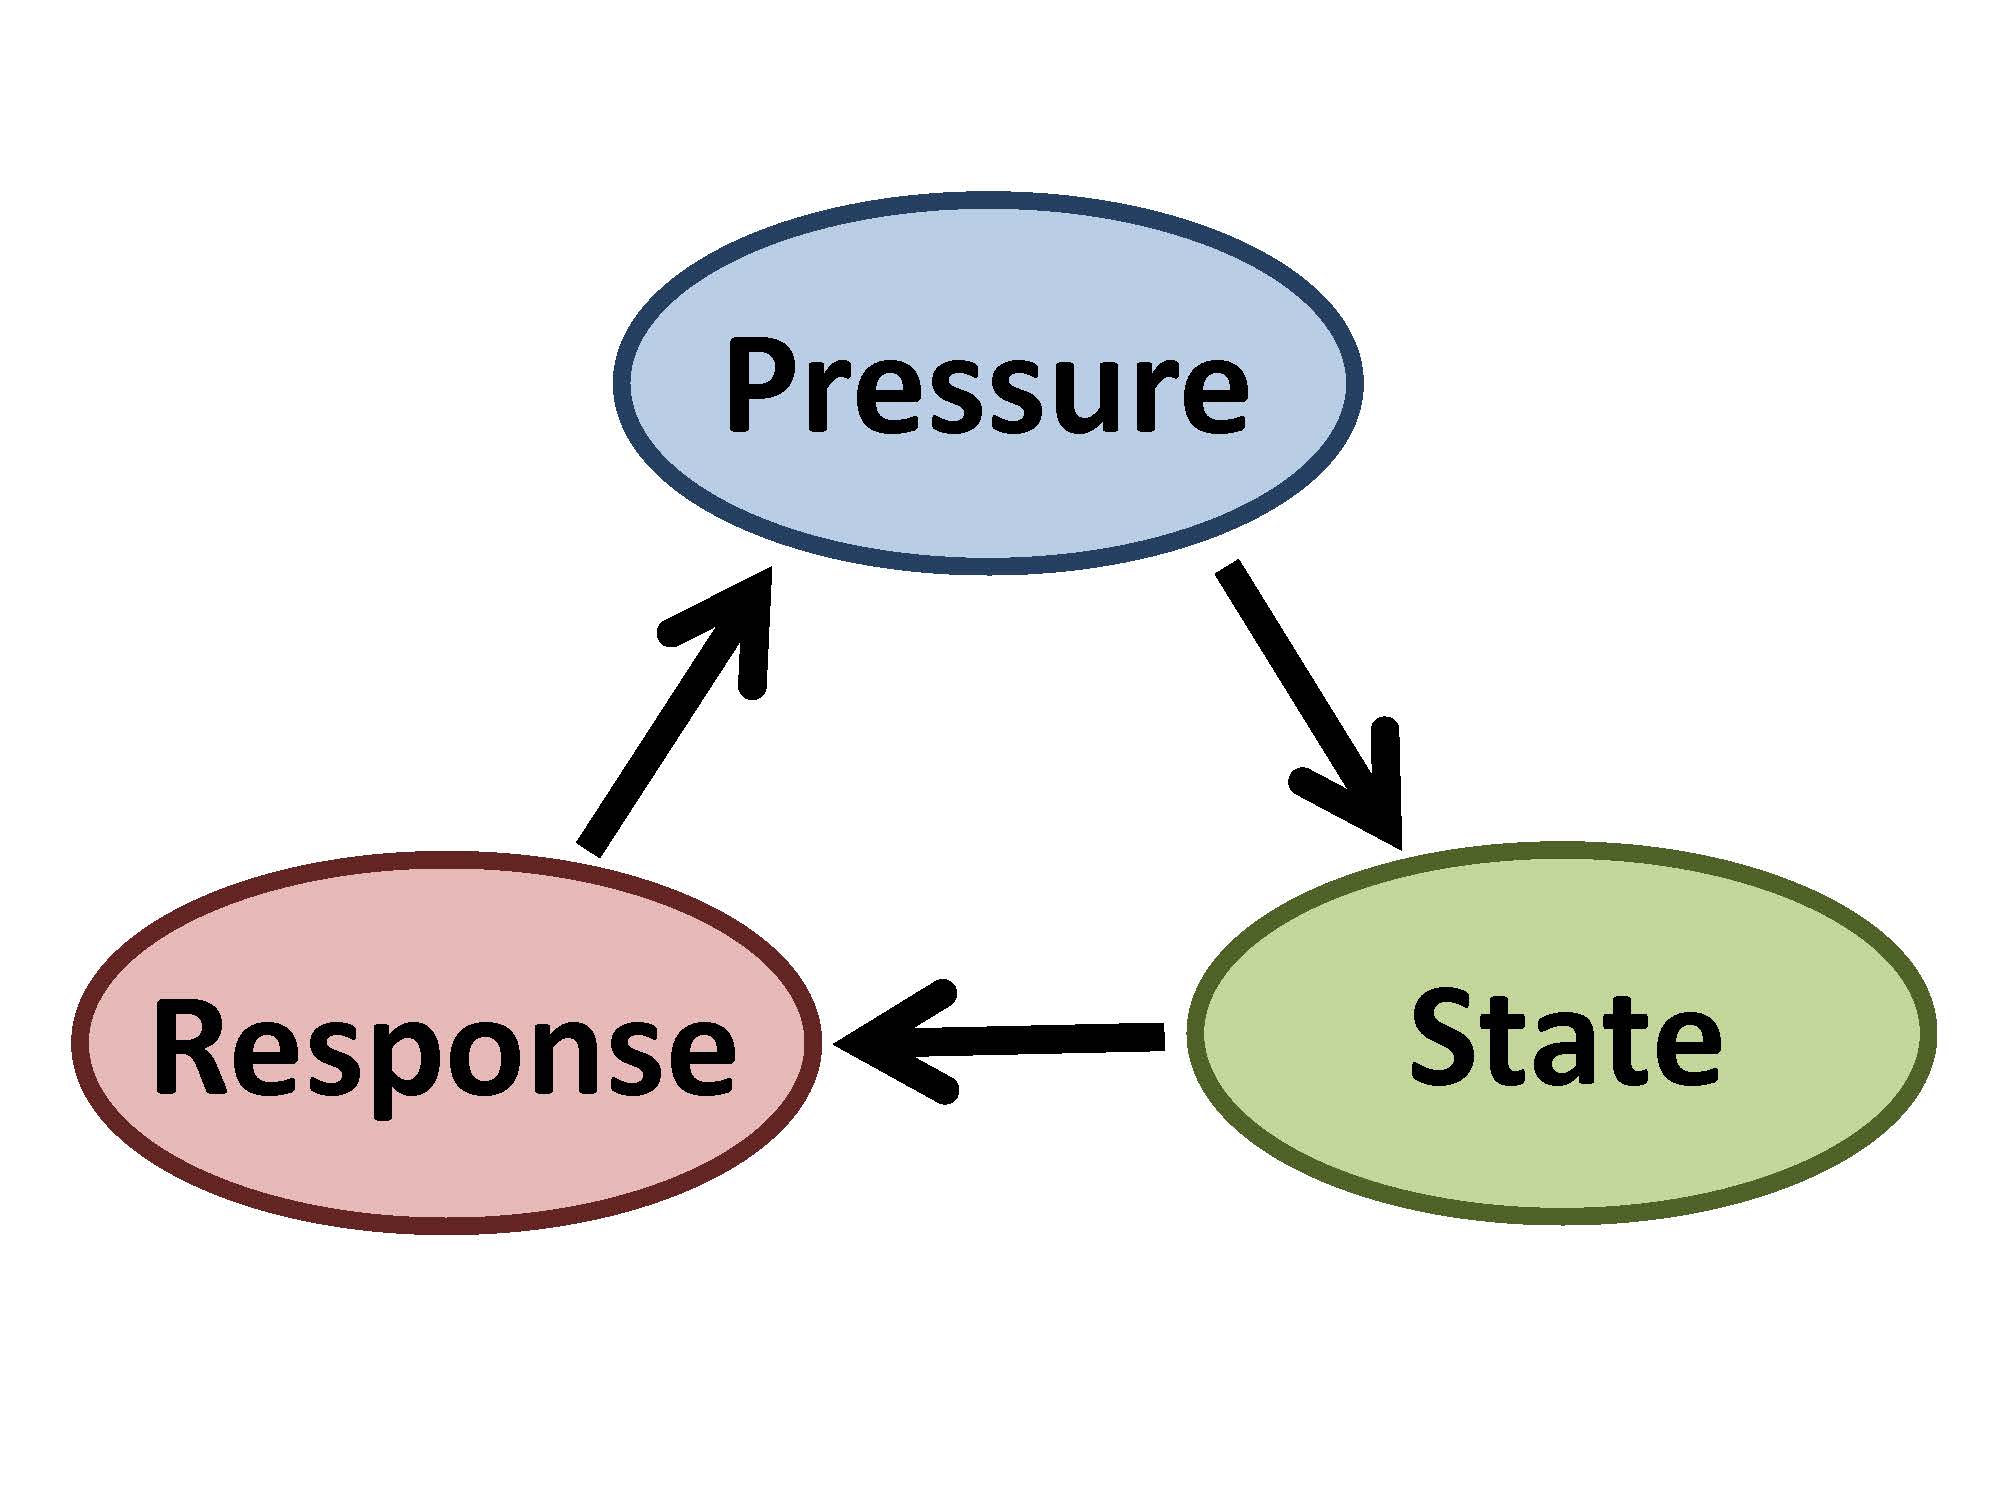 Dr. Swanson said she structured her analysis using a simple pressure-state-response model. “This model says that some pressure, usually an anthropogenic stressor, effects some state, usually some sort of either physical or biological response, and depending upon whether or not that state is desirable or not, you may respond with some sort of management action which is usually designed to affect the pressure in the purpose and in the hopes that you’re going to affect the state and improve that condition. So in my model, spring outflow was the pressure, the low salinity habitat was the state that was being affected by that pressure, and the standard represents the management action that we have taken to affect spring outflow.”
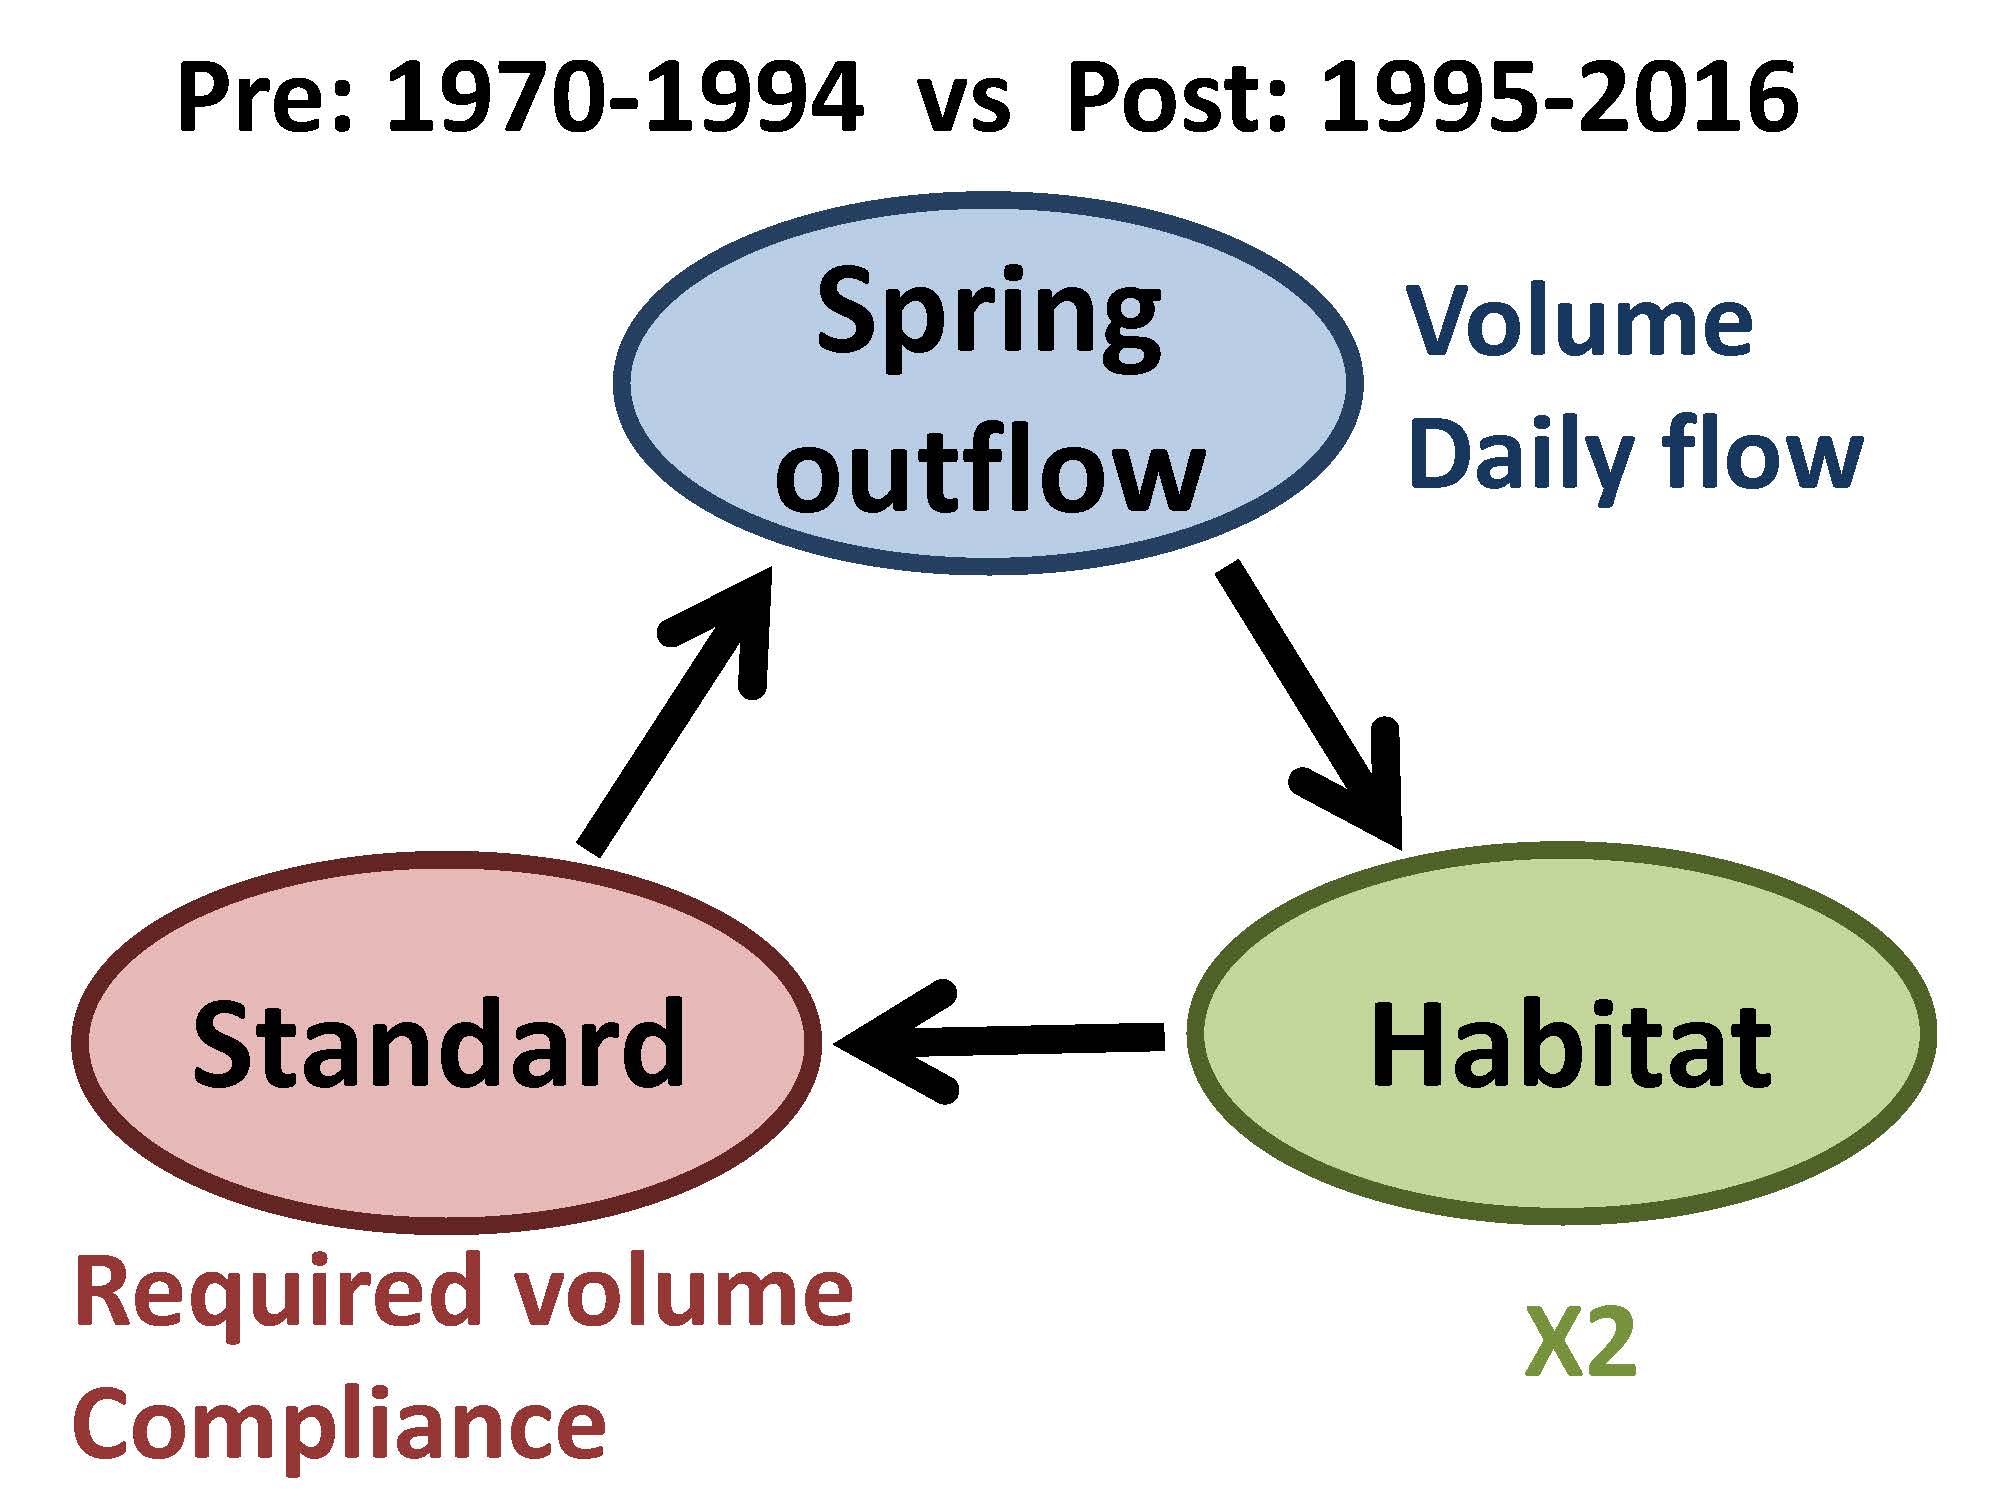 Dr. Swanson measured spring outflow both in terms of seasonal volume and daily flows. “I measured habitat in terms of X2, and I evaluated the standard in terms of what was the required volume of water that the standard needed to have flow through the system to be met, and whether or not the standard was fully complied with. I did this for a 25-year pre-standard period from 1970 to 1994 just immediately before the standard was established, and the post-standard period from 1995 to 2016. “
Dr. Swanson noted that during the time period, there were three years that stand out as outliers: 1970 in the pre-standard period, and 1997 and 2004 in the post-standard period. “These are years in which during the spring, there was a big huge short massive flood, where flows were in excess of 100,000 cfs or more, but in fact they weren’t particularly wet years. The system totally went out of control, meeting the standards wasn’t an issue, and these do show up as outliers.”
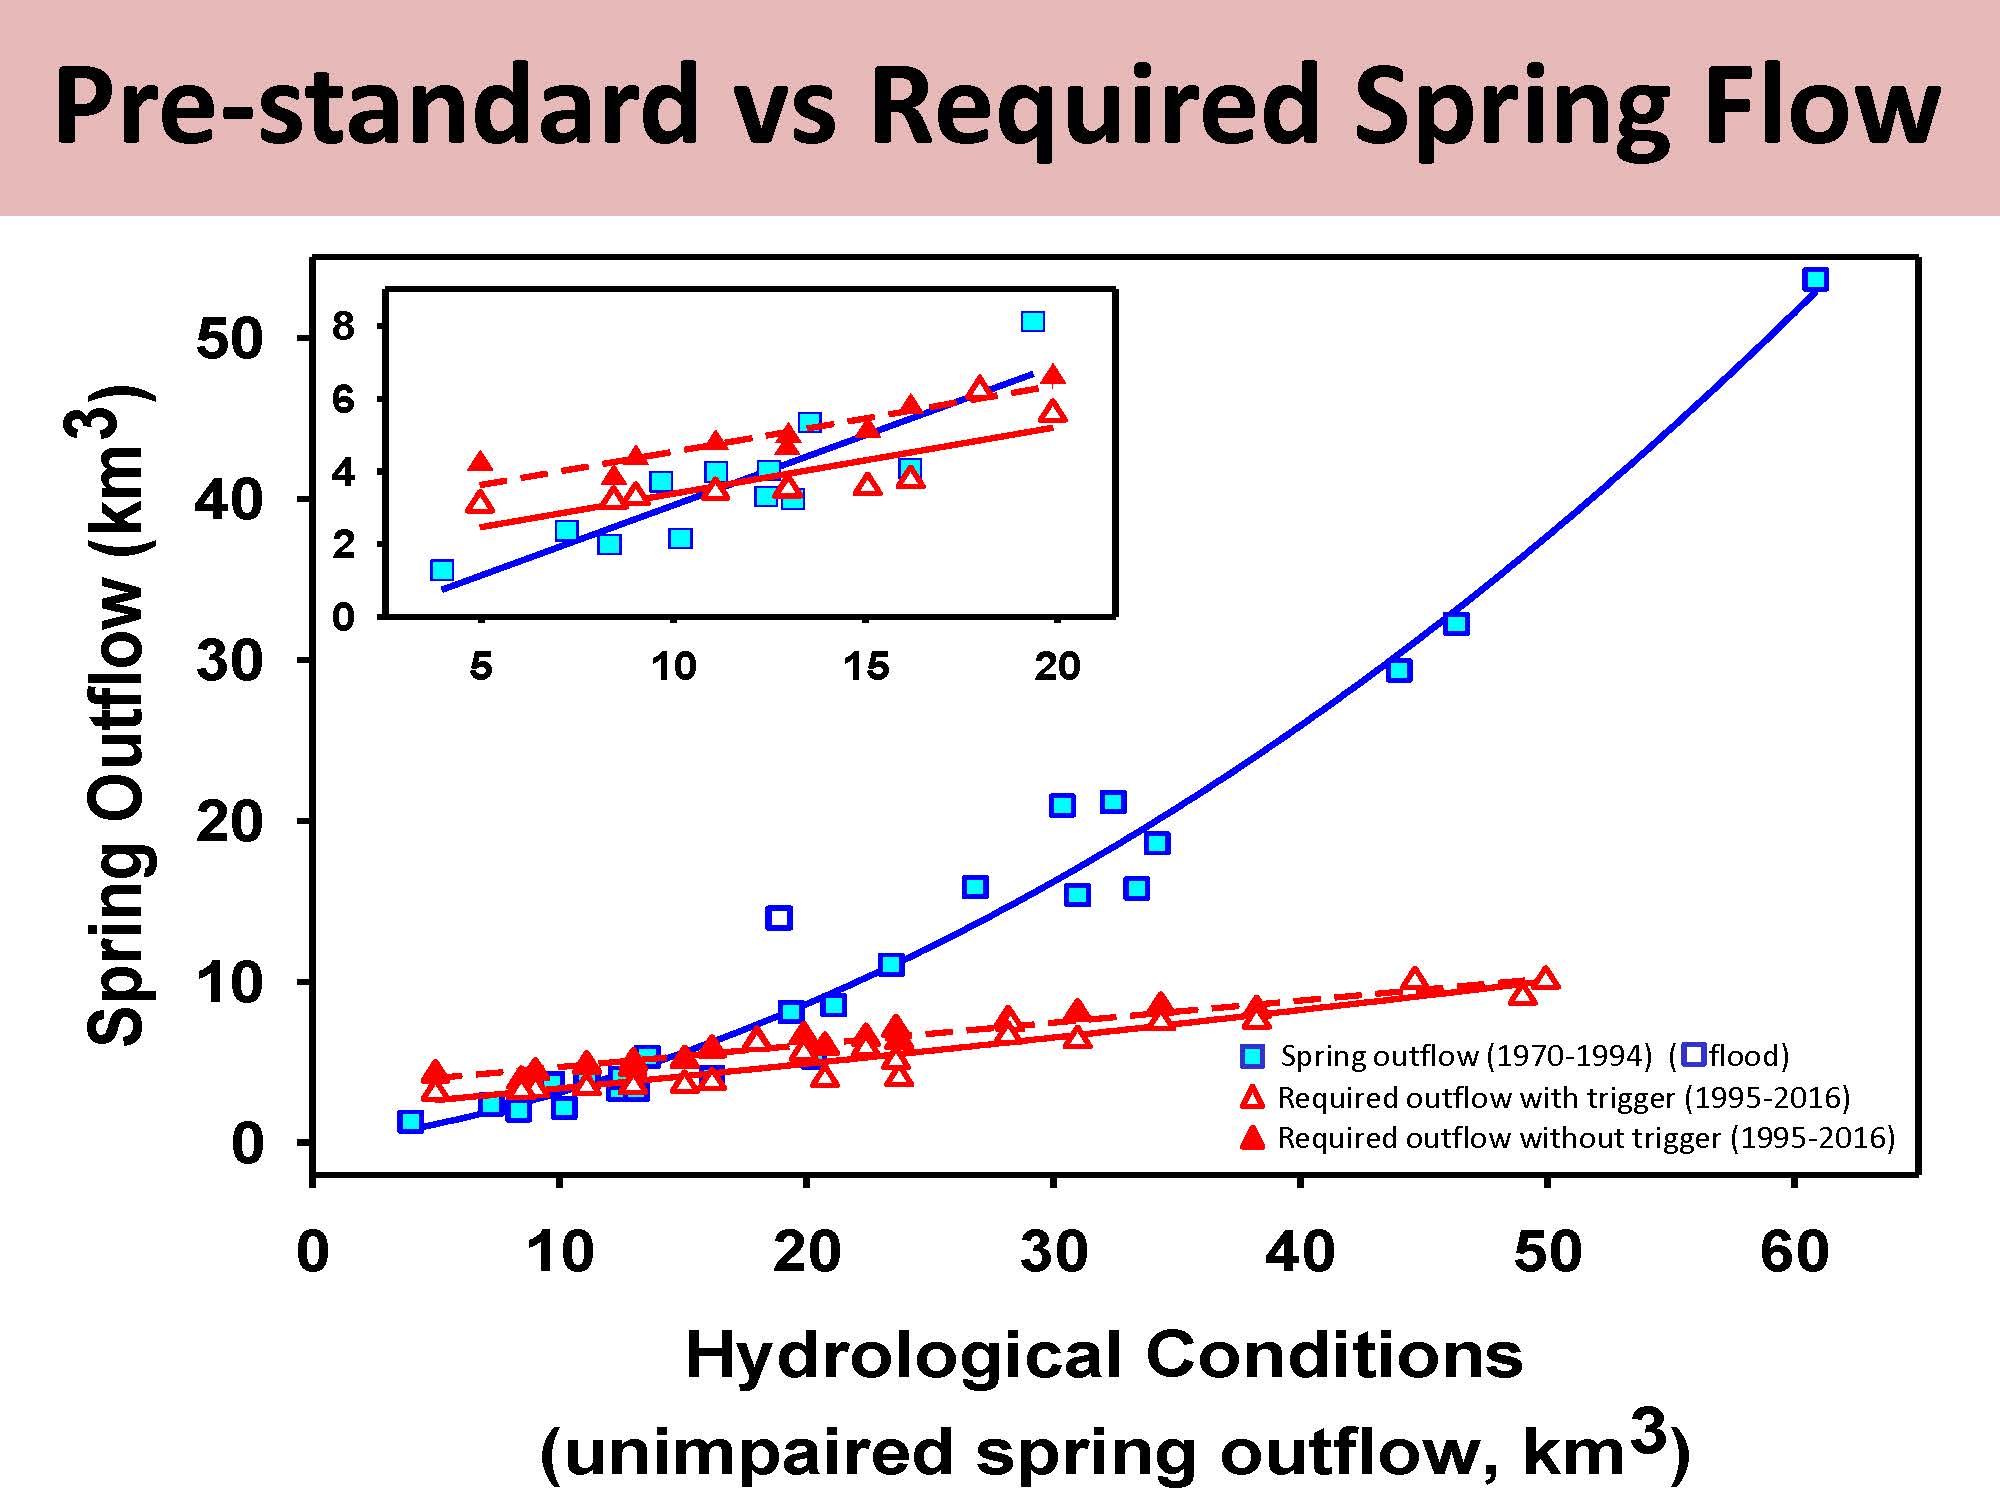
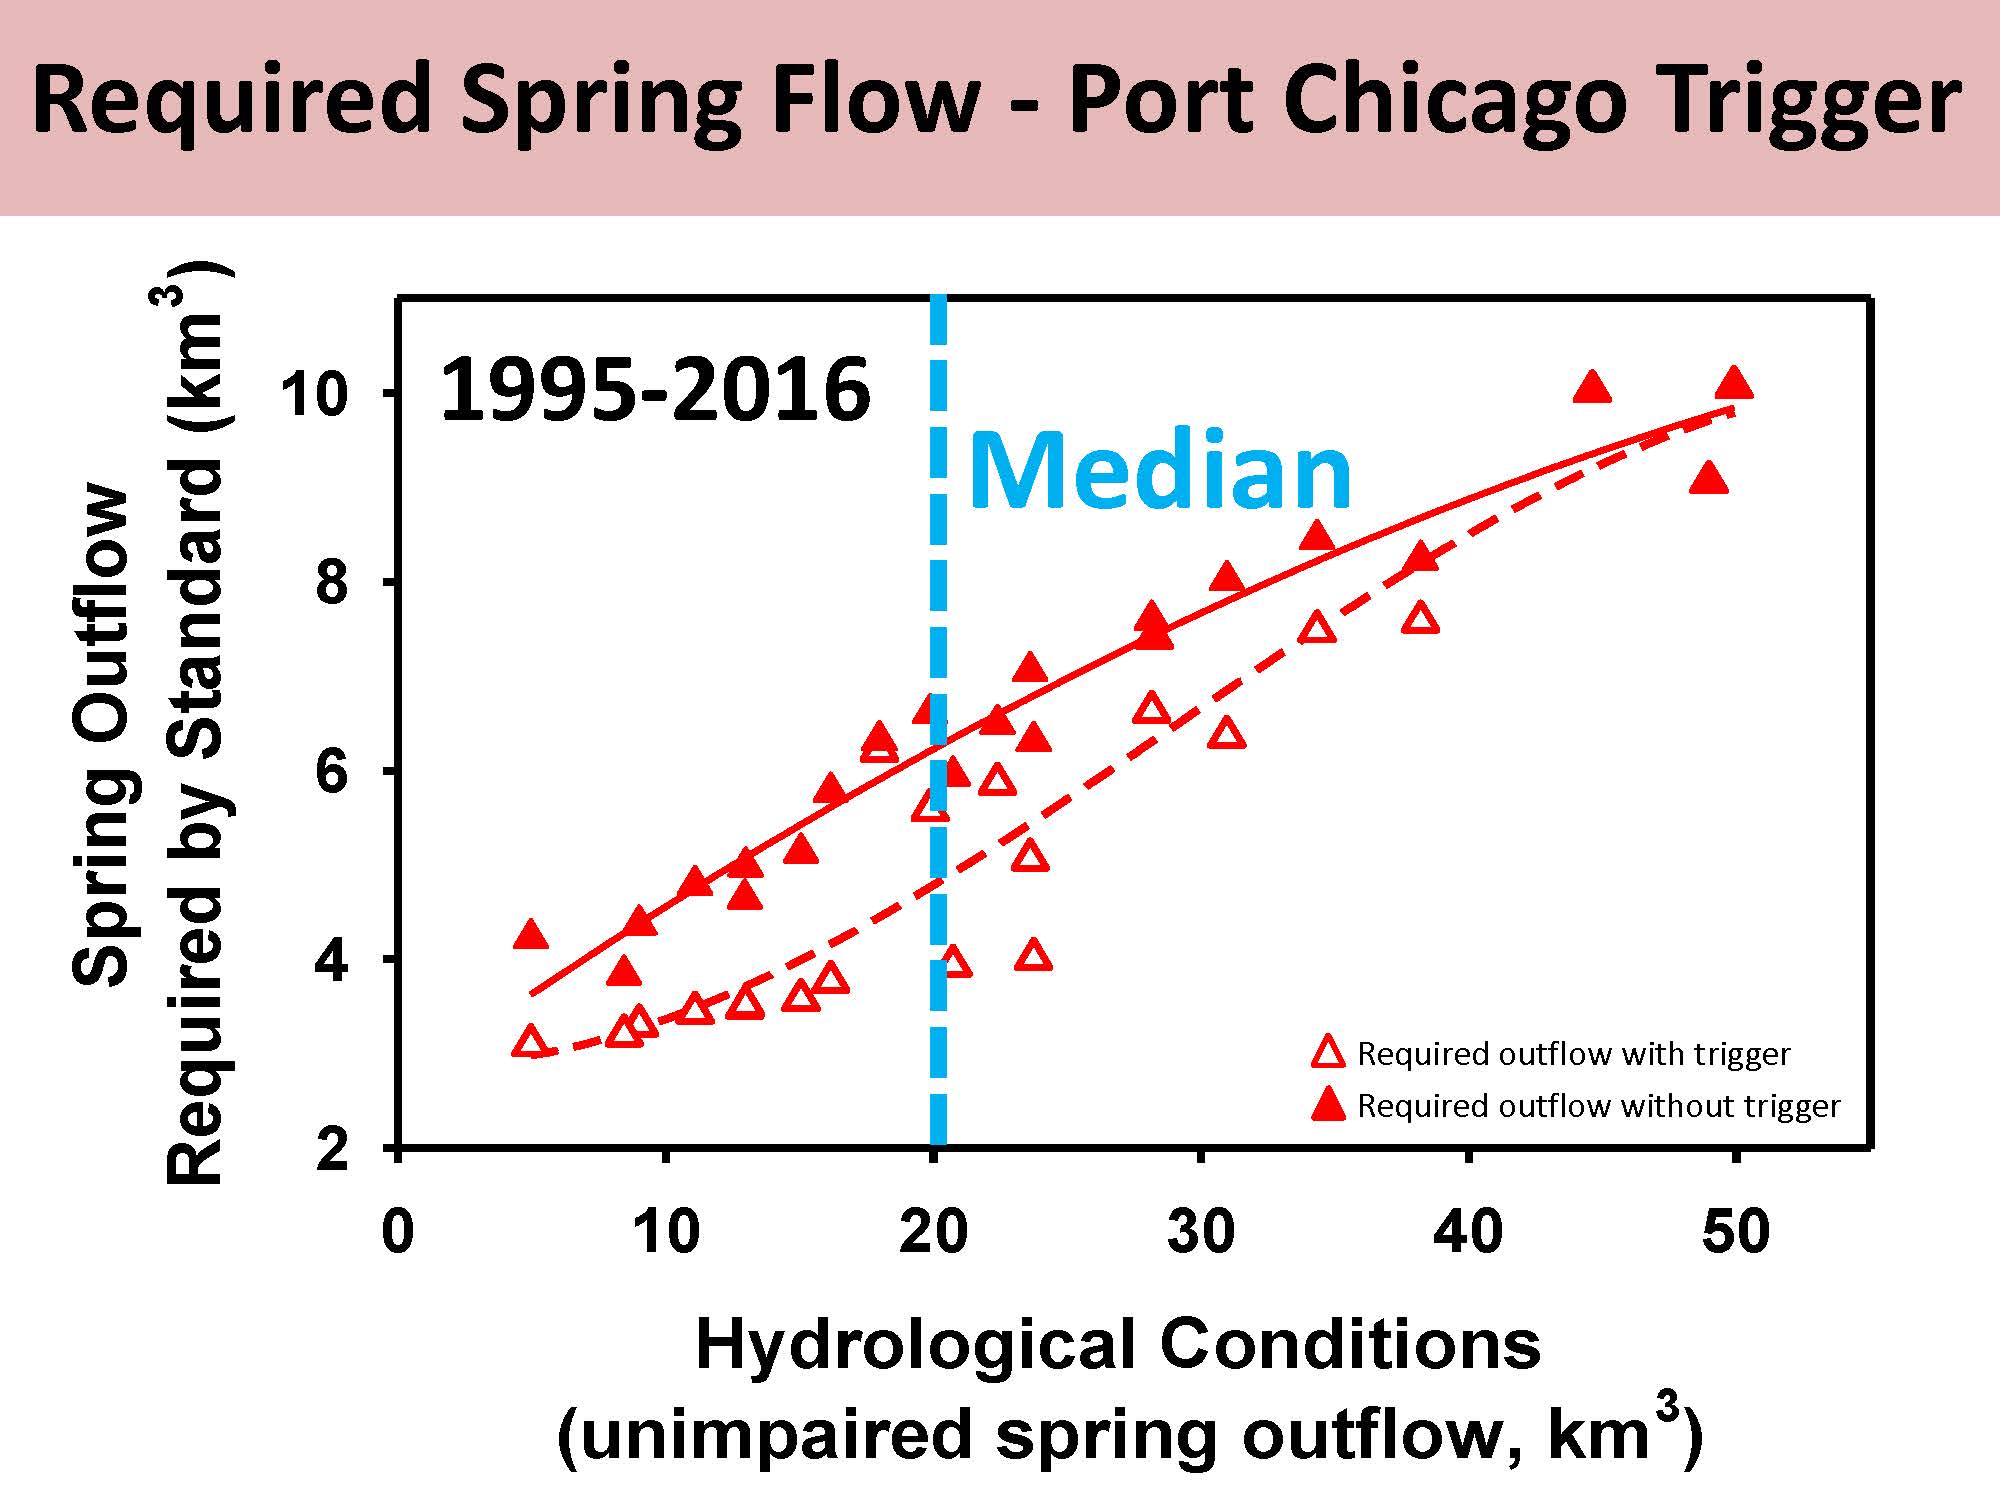 She then presented a graph of the required spring flow for the Port Chicago trigger, noting that the x-axis is the volume of spring outflow and the y-axis are the hydrological conditions. “This is seasonal volume calculated in the solid symbols without the Port Chicago trigger, that’s assuming the Port Chicago always had to be met; and calculated in the open symbols with the Port Chicago trigger. So I looked at each of the years to see whether or not EC at Port Chicago would have triggered the requirement for the low flows.”
Dr. Swanson noted that the inclusion of the Port Chicago trigger really reduces the amount of water that’s required by the standards and there is some reflection of hydrological variation. “This graph is plotting the required flow against an estimate of hydrologic conditions, in this case expressed as unimpaired spring outflow,” she said. “The median is the median of unimpaired outflow for the system, so we can compare dry years to wet years: 50% driest years, 50% wettest years.”
 So how do the minimum required flows for the post-standard period compare to the actual flows that occurred during the pre-standard period? She presented a slide showing the comparison, noting that the amount of flow that occurred during the pre-standard period is shown in blue.
“If you look at this both visually and statistically, you will see that the minimum flow required by the standard, when you include consideration of the standard of the Port Chicago trigger, is not significantly differently than the flows that in fact occurred during the pre-standard period,” she said. “So you have a standard that was developed in such a way that, in fact, does not require any more flows than occurred during the past.”
The Port Chicago trigger is what makes the difference, she said. “If you calculate the standard without the Port Chicago trigger, the amount of flow required by the standard with no Port Chicago trigger is in fact significantly higher, at least in years that are below about 11 km-cubed, basically about the driest 30% of the years.”
How has the standard been implemented? For the 22-year period the standard has been in place, it was waived in the driest two years, and in the remaining 20 years, based on the data examined for flows and EC, it was fully complied with in 18 of those 20 years. “It was not complied with in two years, 2009 and 2012. In those years, they missed at least one day of one of those other flow standards. 2009 was the more extreme one. So in fact, the standard has only been in effect for 82% of the years,” Dr. Swanson said.
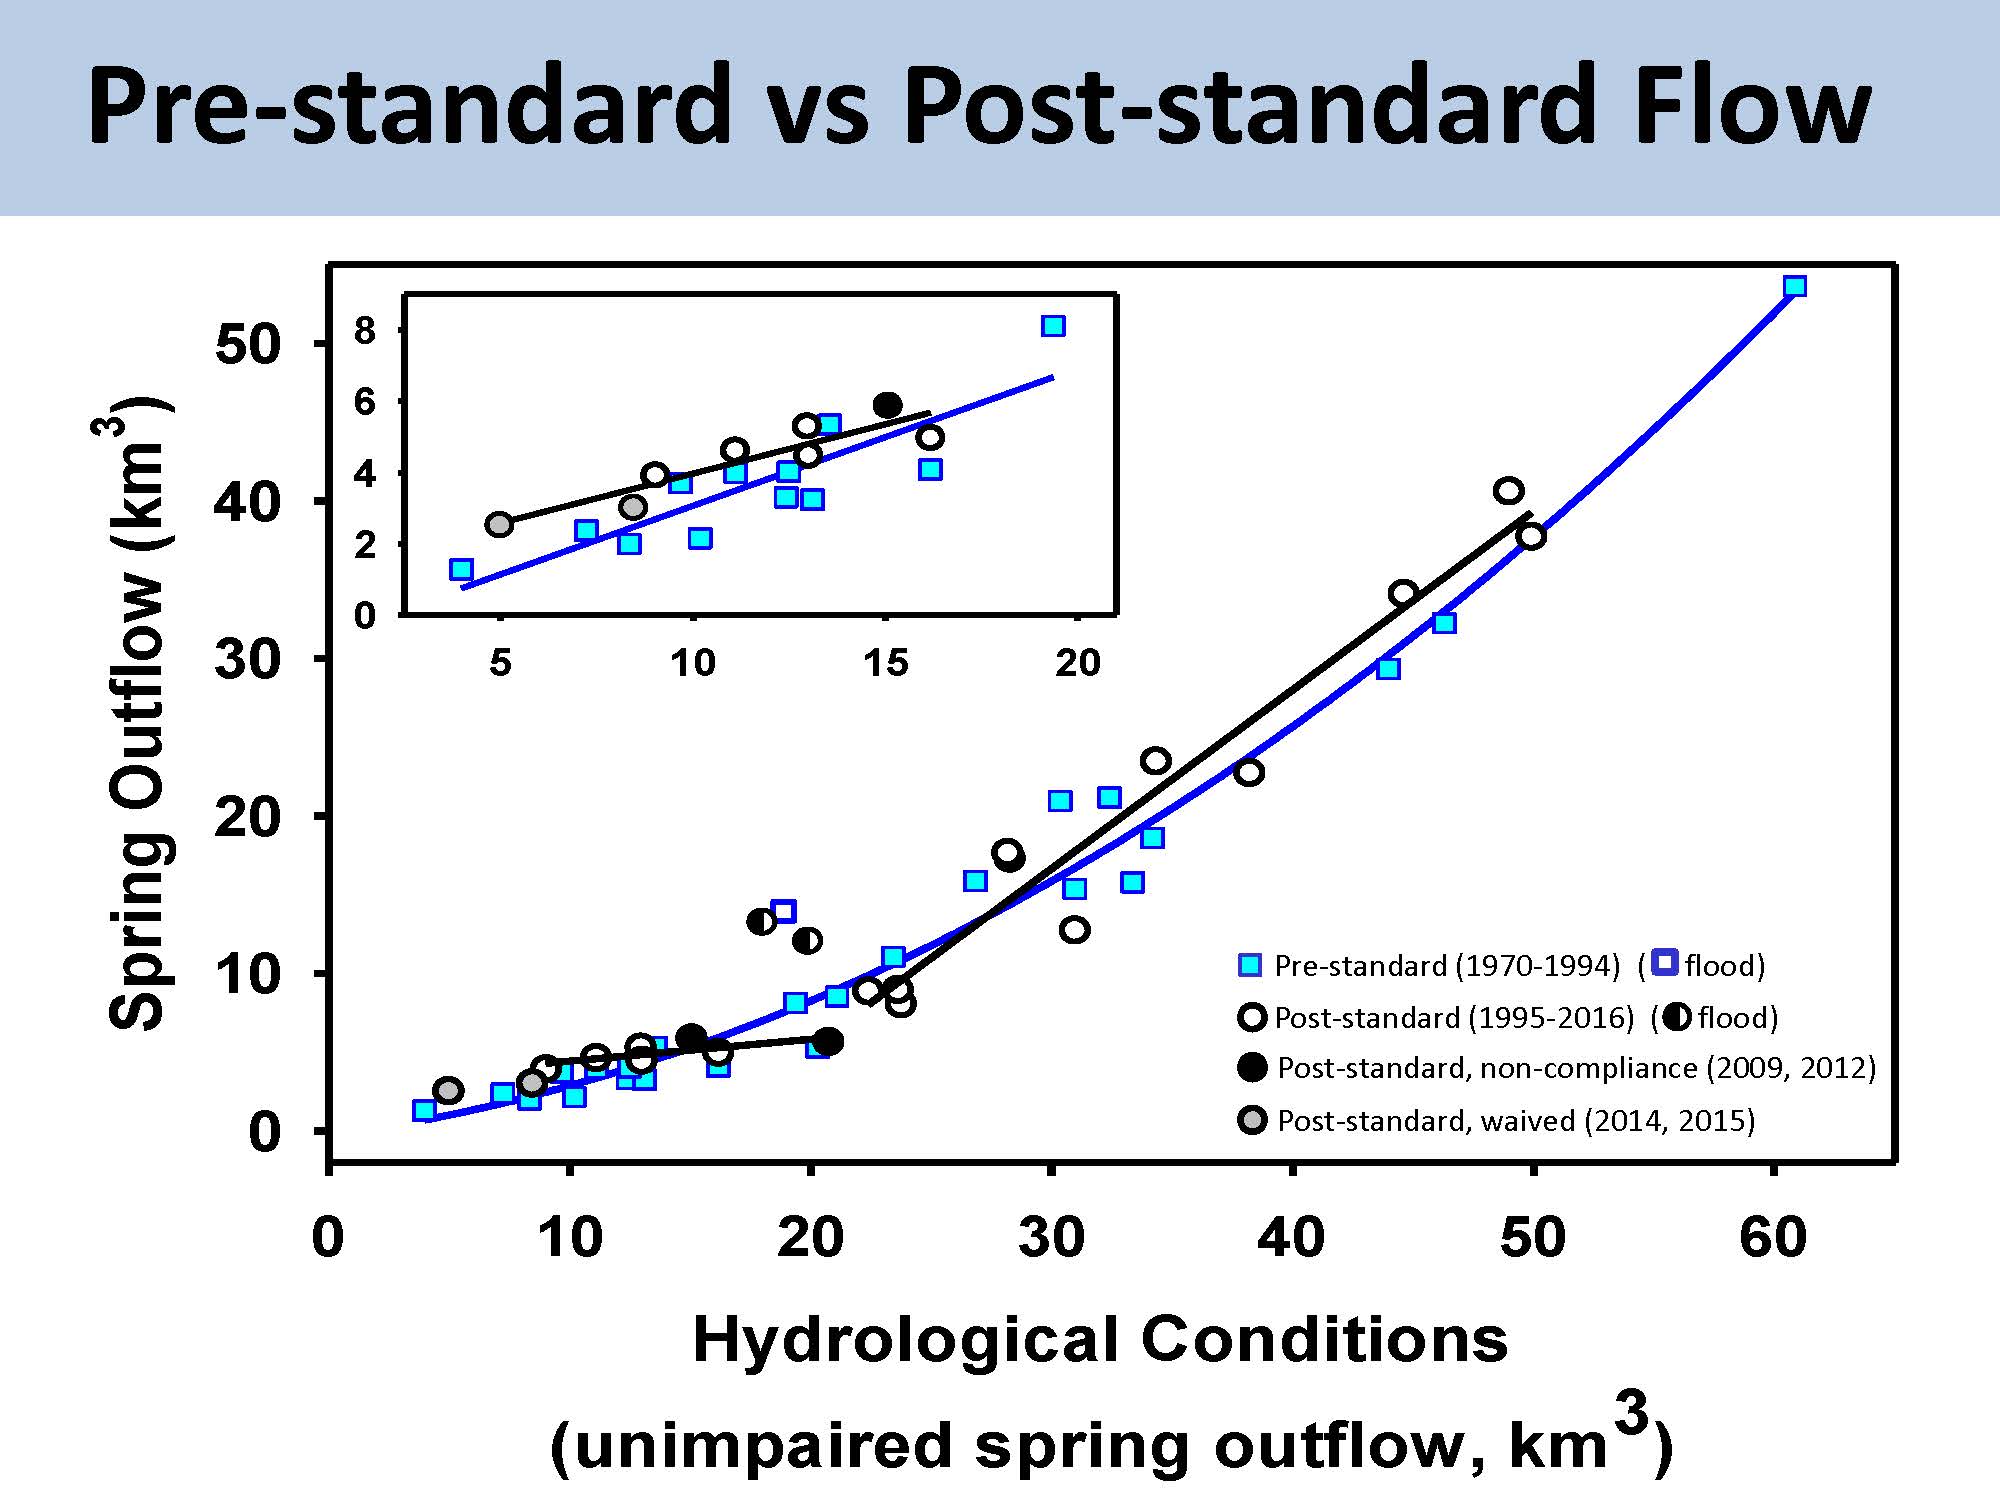 She next presented a comparison of pre-standard flows versus post-standard flows, noting that these are not the required flows, but the flows that actually happened. “In this graph, the pre-standard flows are shown in the blue, and the post-standard flows are shown in the black and white,” she explained. “The graph also shows the outliers, just so you have a reference point. What this graph shows is of the two black symbols, those are the two years in which the standard was not complied with, at least based on my analysis, and then the two years in which they were waived are the gray circles.”
“If you do a statistical analysis and you ask the question, in below median years, were the flows that occurred in the post-standard period any different than those that occurred during the pre-standard period, the answer is no,” said Dr. Swanson. “These flows are not significantly different from pre-standard flows, so in fact in these drier 50% of years, there really have been no significant changes in seasonal flow volumes because of the implementation of the standards.”
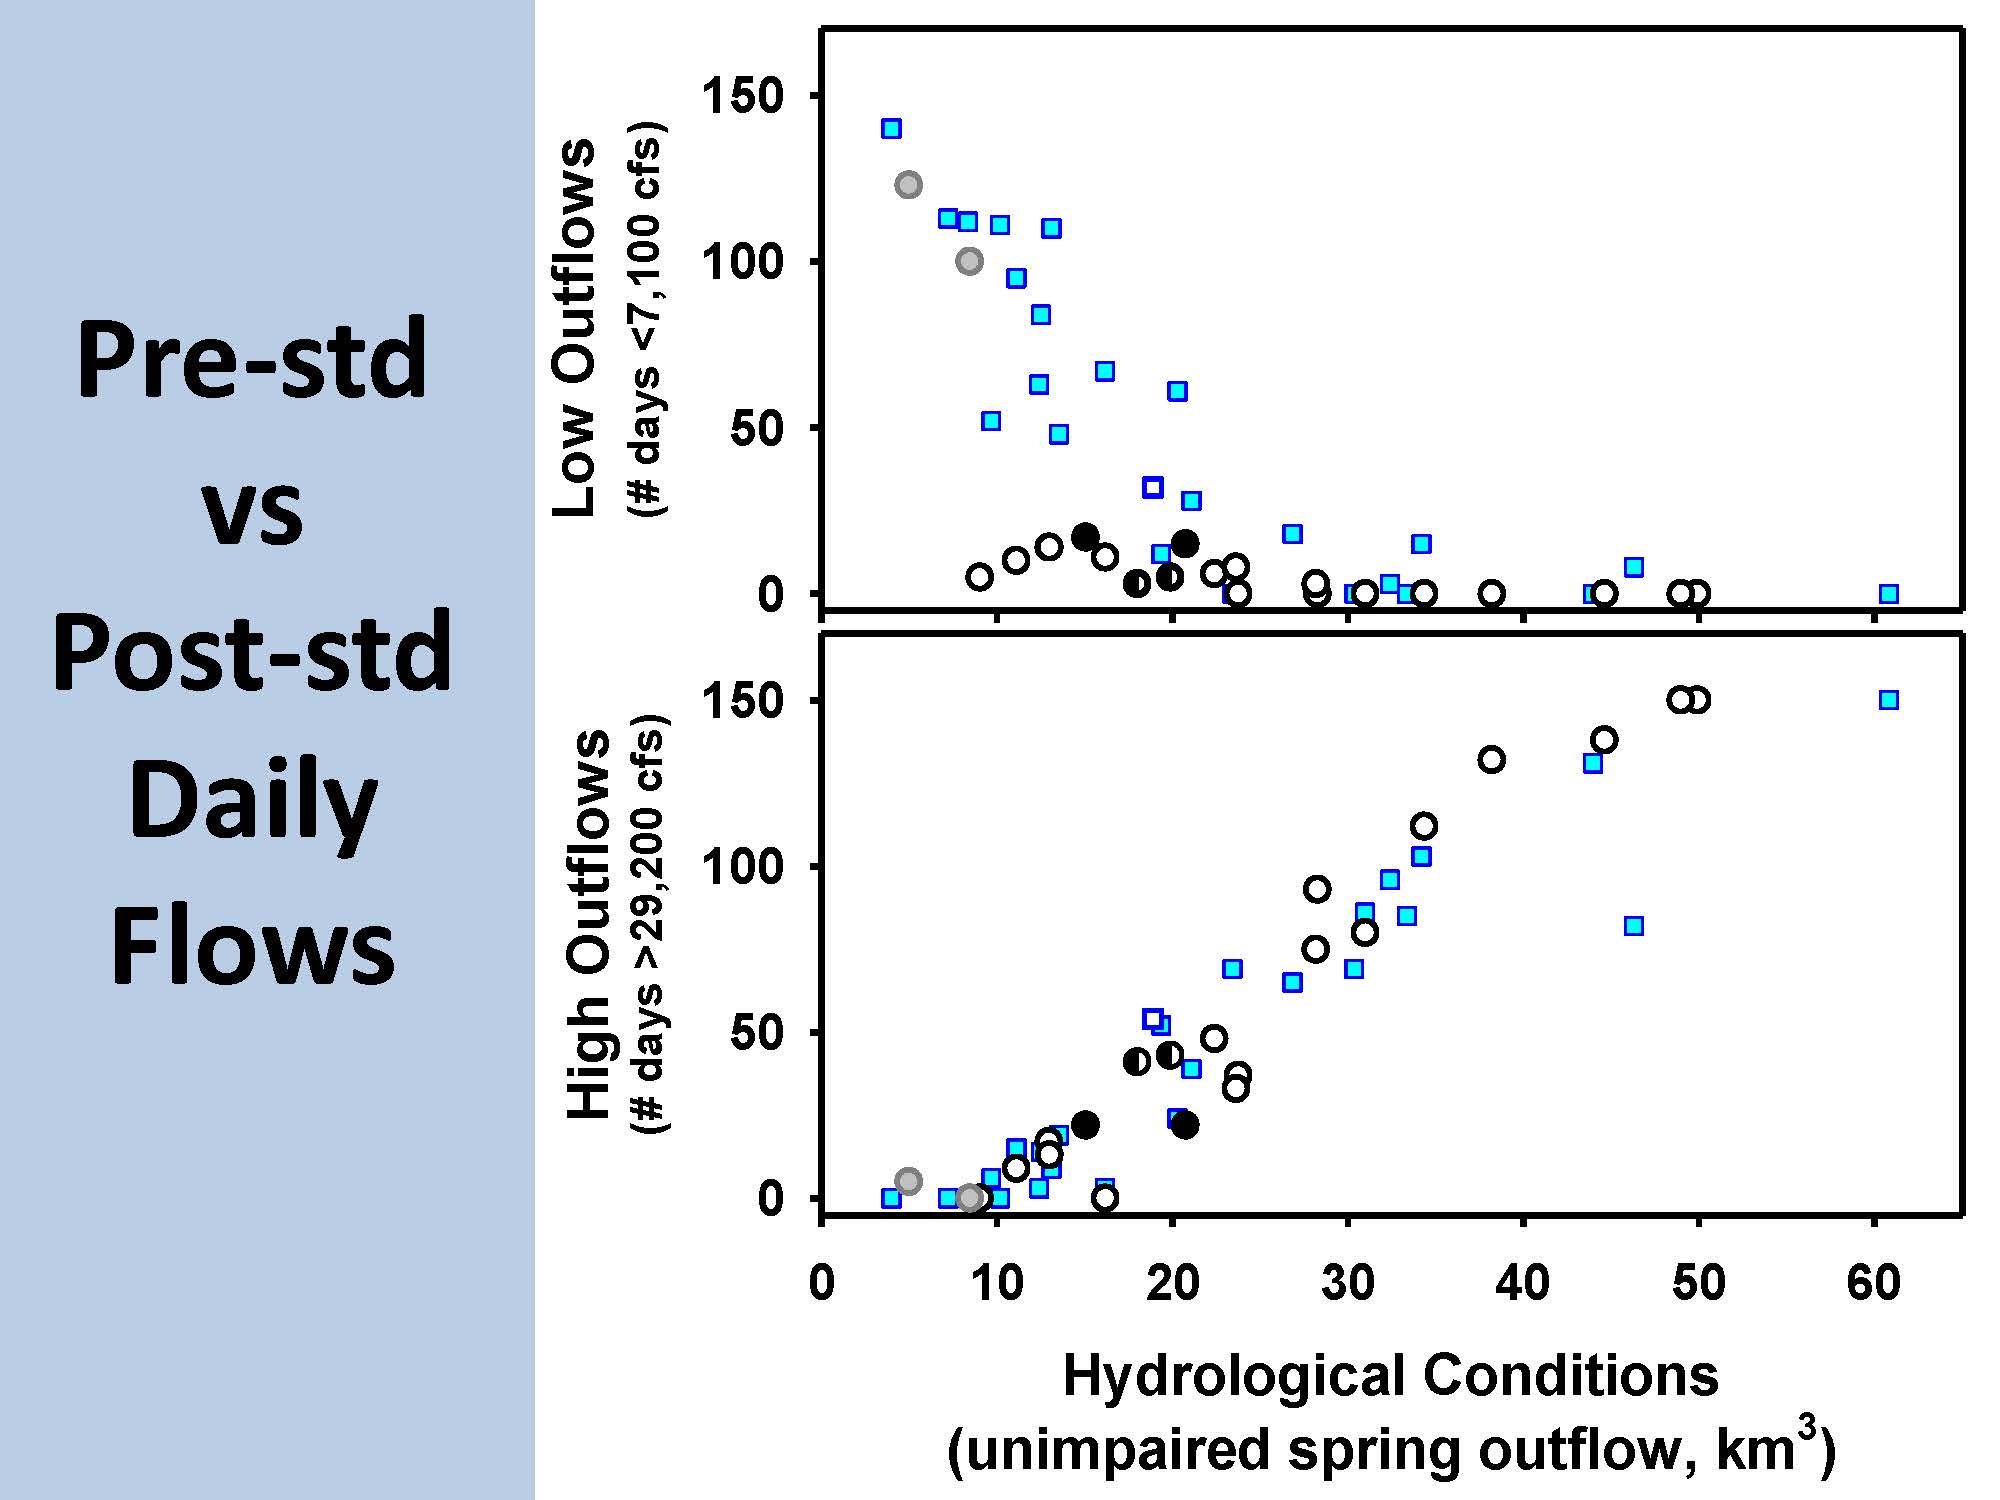 However, there has been a reduction in the frequency of the really low flow days, she noted. “In fact, in the pre-standard days, there used to be a lot of days in which flows were less than 7100 cfs; now in fact those are much rarer except for the two gray symbols up there when the standards were waived. There’s no difference in the high flow days.”
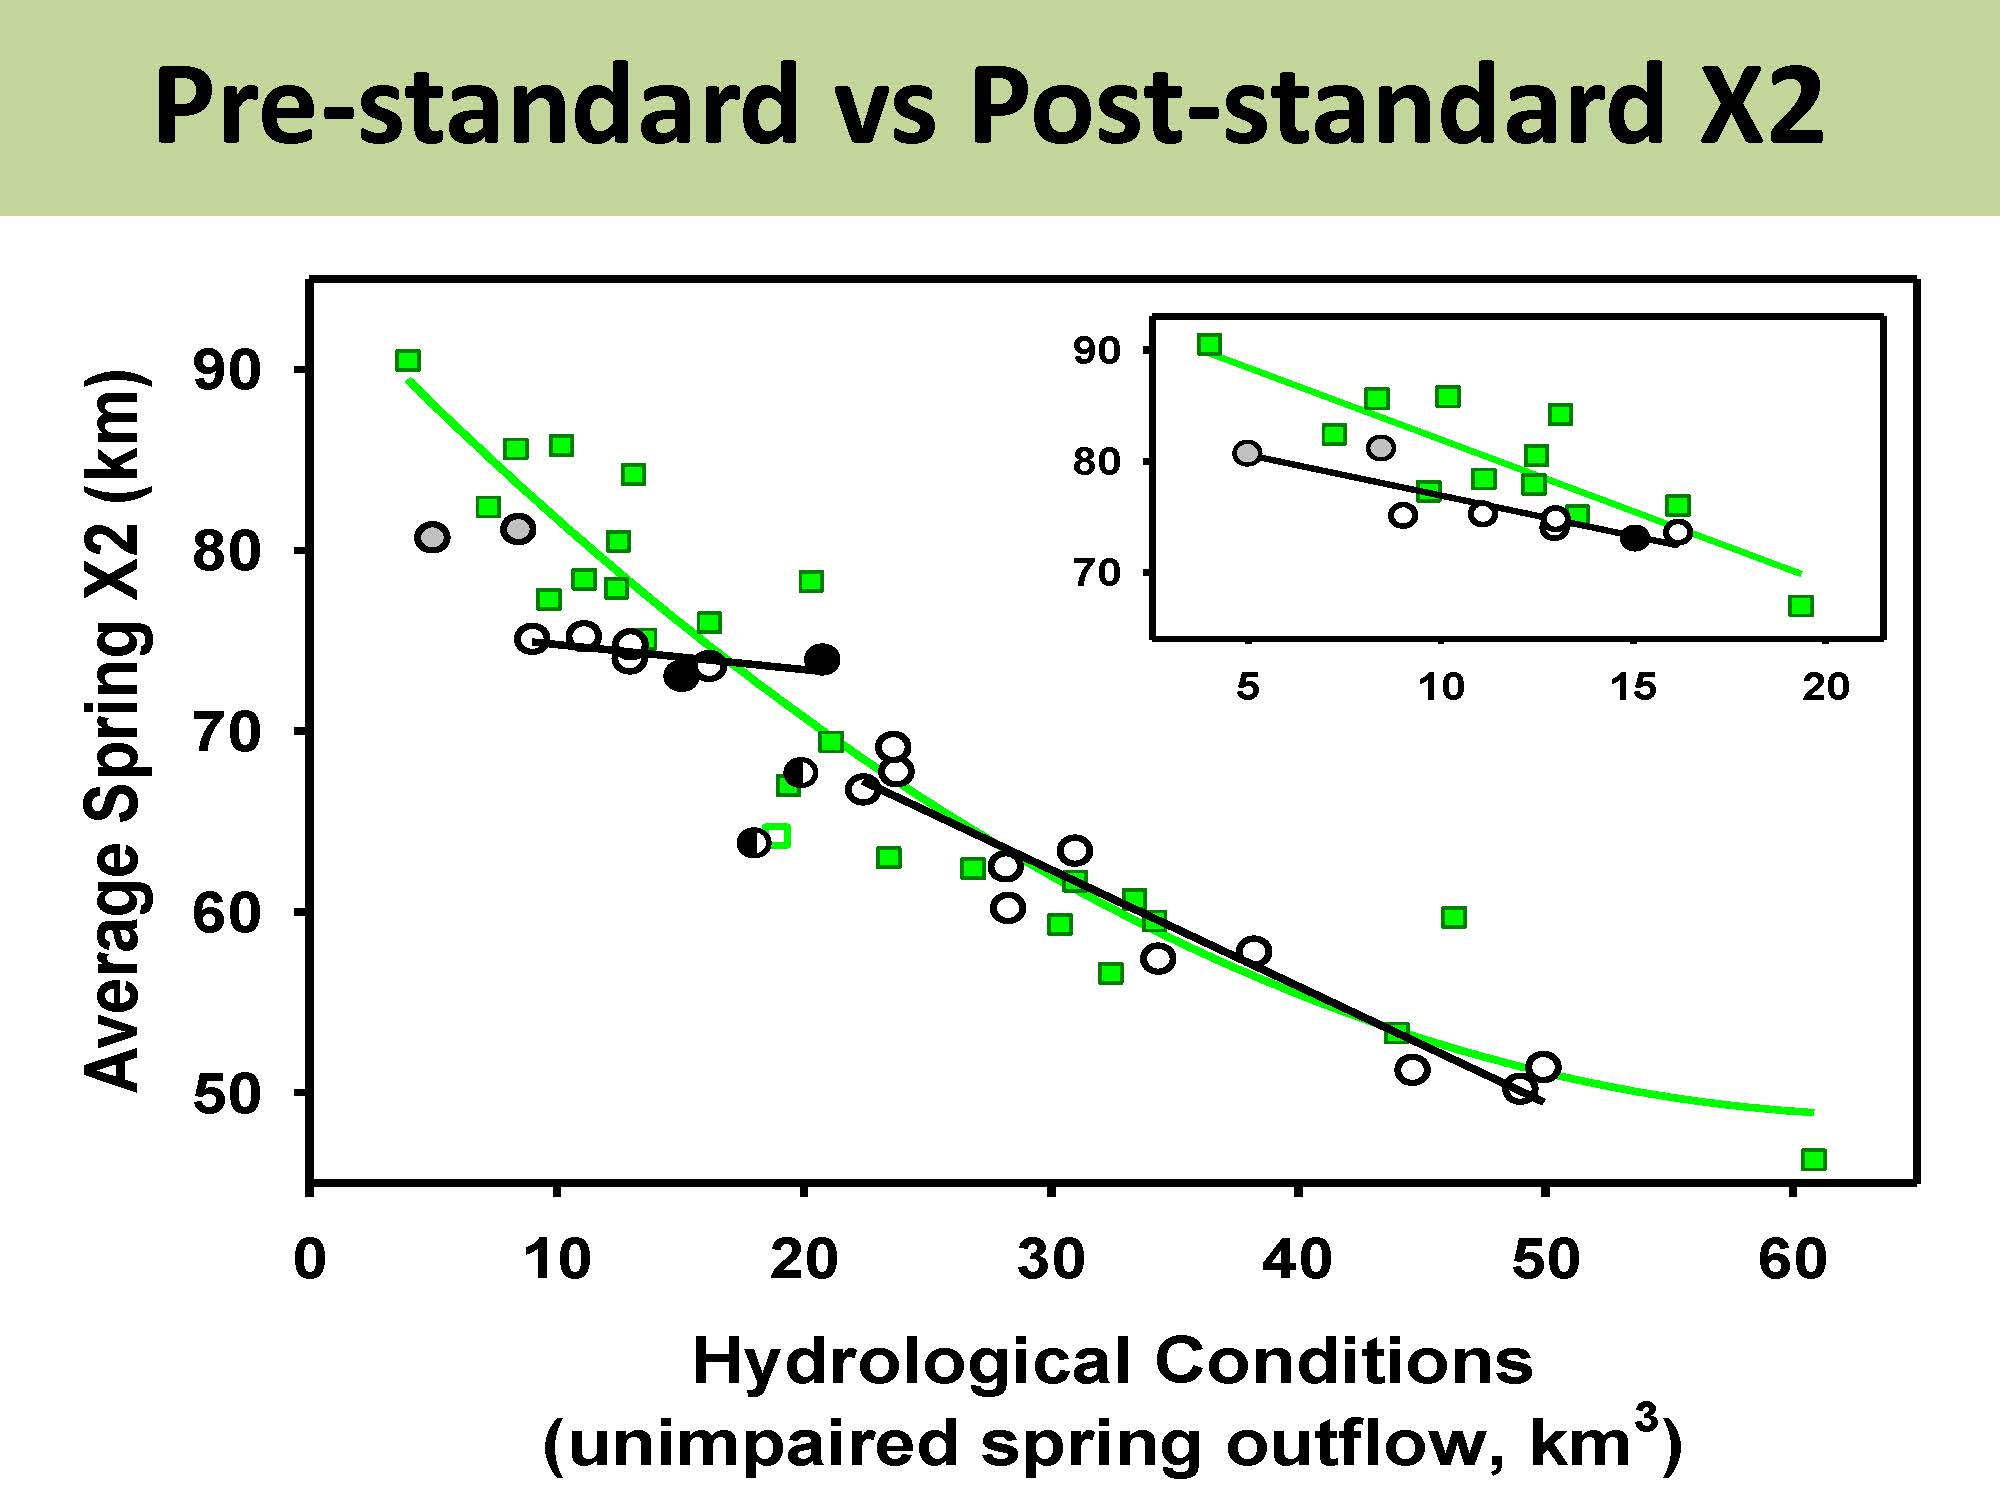 How does this affect habitat? Dr. Swanson presented a table showing average annual X2 plotted against hydrological conditions, noting that the green symbols are the pre-standard and the black symbols are post-standard. “In fact, X2 conditions in the driest 50% of years have improved. They are significantly lower, meaning further downstream then they were in the pre-standard conditions,” she said. “However, in fact if you look at the below median years in which the standard was implemented (so exclude the gray dots), there is in fact no significant relationship between X2 in all of those years and hydrological conditions. So basically it flatlined X2. It is not reflecting hydrology. It’s better than it was, but in fact, over the entire 50% of drier years, X2 conditions in the spring are pretty much the same at about 74 kilometers.”
Dr. Swanson then gave her conclusions. “The standard itself wasn’t implemented in the driest years, exactly the kinds of years it was intended to protect, and the Port Chicago trigger has a huge impact on what the standard requires,” she said. “I will also argue, it is something that’s vulnerable to managing the system to make sure that you don’t trigger the Port Chicago trigger.”
“In the driest 50% of the years, the amount of flow required by the standards is no different than what occurred during the pre-standard period,” she continued. “If you compare actual flows between pre and post standards, there’s no difference in seasonal volumes but there is a significant reduction in the extreme low daily inflows, and in fact, that is the characteristic that is driving the improvement in X2 in the low salinity habitat conditions.  So we’re getting a little bit better X2 and low salinity habitat conditions that we got in the past, but in fact they are not reflecting hydrological variation and in general, it’s fairly poor X2 conditions.”
“I just want to close by saying that this was a fairly comprehensive and effective way to evaluate a management action by making sure that you’re looking at the structure of the action itself, you’re looking at how it was implemented, you’re looking at the effect of the action, and you’re also looking at the efficacy of the action,” she said. “As we go forward with adaptive management for other actions we’re taking in the system, I would certainly advocate that we’re looking at all of these elements.”
 Sign up for daily email service and you’ll never miss a post!
Sign up for daily emails and get all the Notebook’s aggregated and original water news content delivered to your email box by 9AM. Breaking news alerts, too. Sign me up!
