

At the request of BDCP participants, the Delta Science Program has convened an Independent Science Review Panel to assess the scientific soundness of the effects analysis chapter (Chapter 5) of the Bay Delta Conservation Plan. The panel, which first met in 2011, consists of Alex Parker, Ph. D., California Maritime Academy and California State University (Panel Chair); Charles “Si” Simenstad, Research Professor, University of Washington;T. Luke George, Ph.D. Colorado State University; Nancy Monsen, Ph.D., Stanford University; Tom Parker, Ph.D., California State University San Francisco; Greg Ruggerone, Ph.D., Natural Resources Consulting, Inc; and John Skalski, Ph.D., University of Washington. (Click here for panel member bios.)
Using a broad range of analytical tools and models, the Effects Analysis tries to predict how the BDCP’s actions will affect the Delta’s ecosystems, natural communities, and covered species, and present conclusions on the outcomes from implementing the conservation strategy. In the analysis, the effects of the BDCP’s actions are evaluated against the existing (or baseline) conditions and what is expected to occur; the analysis then summarizes the positive and negative effects to determine the net effect to each of the covered species. The Effects Analysis differs from the environmental review analysis as it analyzes only the biological impacts of the Plan, whereas the Environmental Impact Report (EIR) analyzes the impacts of the project on water supplies, air quality, agriculture, recreation, transportation, land use, and other environmental resources.
This is the third phase of a three-phase review. During the second phase of the review, the panel reconvened in April and May of 2012 to review the administrative draft of Chapter 5 and many of the accompanying technical appendices. The panel made comments and gave recommendations in a report that was presented in June of 2012. (Click here for the report.)
On December 18, representatives from ICF International made a presentation to the panel members discussing what has changed since their last review, and how ICF has responded to the panel’s previous comments. Prior to the presentation, officials addressed the panel members.
“I really believe that one of our biggest obstacles to being able to issue a 50 year permit for water operations in the Delta is just the vast uncertainty that underlies many aspects of the plan, it’s effects and ultimate outcomes of what will happen,” said Mike Tucker, National Marine Fisheries Service (NMFS). “What we really need you to do is to instruct us on how best to reduce the areas of uncertainty wherever possible through this analytical process, but also how to embrace the remaining uncertainty and incorporate into our analysis – how to describe it accurately, and most importantly, how to structure the plan to really be durable in the face of this uncertainty and all the curve balls that it is likely to throw at us over the next 50 years.”
DWR’s Laura King Moon told the panel there is a much greater discussion of the uncertainties in the revised effects analysis. “I think we have a better handle on what we know and where the uncertainties still lie and you’ll see a lot of evidence in that and so the question is what do we do about that going forward,” she said. “So we’re acknowledging the uncertainty, but we are certain though that we can’t keep going the way we are now, and this project is the best thinking of a lot of people in how to move forward and make things better for the Delta ecosystem, the species that will be covered by this plan, and also for provide more stability in water supply, with is a very important thing to the economy of this state.”
“I think we have a vastly improved adaptive management process as part of this plan,” continued Ms. Moon. “It’s not something that is your purview in the review of the effects analysis, but I think it might be beneficial in January to talk a little bit more about the changes in that process because I think as we’ve been working on this effects analysis, the uncertainties have been looming very large in our eyes, and yet I think we feel more confident than ever before in moving forward knowing that we do have a good adaptive management process for dealing with those uncertainties, so we’ll urge you to take a look at that as well.”
Carl Wilcox, Department of Fish and Game
Carl Wilcox gave a brief presentation on the findings that the Department must make in order to approve the BDCP as a NCCP. “NCCPs, under the NCCPA, are the vehicle for the department to authorize take of state listed fully protected species and unlisted covered species that might be listed in the future through the conservation of natural communities at a landscape scale within the planning area,” he said. This is a very high standard that is basically equivalent to a recovery standard, so this is a high bar for the plan to accomplish. “So consequently, for species like Delta smelt and longfin smelt, the effects analysis and the findings in the effects analysis are going to be critical for us to be able to make the appropriate findings.”
Some of the important findings for the panel to consider include:
- DFW must find that the plan provides for the protection of habitat, natural communities and species at a landscape or ecosystem level; “This is particularly important because this plan relies on, different than most plans, to large degree on habitat restoration as well as providing appropriate flows, and that habitat restoration is a key component to achieving the objectives of the plan which are outlined in the 200 or so goals and objectives within the plan,” he said.
- Conservation measures in the plan area provide for the conservation of species by conserving landscapes for ecological integrity, function, and diversity. “This is the critical component for us in making our findings are that the species would be conserved. The standard for unlisted species is to preclude their future listing within the plan area as a result of the activities in the plan area and/or to get the species that are within the plan area, if they are primarily in that area, to a level that would make their listing unnecessary, so we’re shooting for a very high standard here.”
Assurances are based on:
- Level of knowledge of status of covered species – “The level of assurance is based on the level of the knowledge of the status of the covered species at the time the plan is approved; we still have some issues with some species where we may not know enough ultimately to list them,” said Mr. Wilcox.
- Adequacy of analysis of impact of take which is focused primarily on the effects analysis.
- Use of best available science to make take assessments
- Reliability of conservation strategies – “We have 21 other conservation measures that are supposed to contribute along with CM1 and the operational aspects of the plan.”
- Appropriateness of size and duration of the plan with respect to quality of data – “This goes to Mike Tucker’s point about uncertainty – the length of the plan, the science program that’s associated with the plan, and the ability of the plan, through its adaptive management processes to effectively achieve its goals over the life of the plan,” said Mr. Wilcox.
- The degree to which foreseeable circumstances are considered and provided for through adaptive management
The specific topics of concern to DFW are:
- The strength of the analysis addressing project effects on longfin smelt including flow abundance relationships, and the relationship of food web contributions from habitat restoration and management to ameliorate that in relationship to flow. “This is critical for us in being able to make our findings relative to longfin smelt in the plan,” Mr. Wilcox noted.
- Assessment of the conclusions and supportive analysis relating to the foodweb benefits of tidal habitat restoration.
- Assessment of the conclusions and supporting analyses relating project population‐level effects on white sturgeon.
David Zippin, ICF International: Major changes to the project
David Zippin, the program manager for the consulting team with ICF International, began with a presentation on the major changes to the project since the panel’s last review of the February 2012 administrative draft. (Note: the panel did not review the version of Chapter 5 that was released in the spring of 2013, so the changes that have occurred in the last two years are described throughout this presentation.”
Since then, there have been two major changes, he said. In July of 2012, the number of intakes was reduced from 5 to 3, changing the capacity from 15,000 cfs to 9,000 cfs, and changing the tunnels to gravity flow as opposed to pumping, reducing energy use. The change eliminated the need for the intermediate pumping plant, which reduced some of the surface impacts. “The rationale for reducing the number of intakes was both to reduce impacts to local communities along the Sacramento River and reduce impacts to migrating salmon as they pass the intakes,” said Mr. Zippin.
 In August of 2013, the tunnel alignment was modified, primarily to reduce impacts further to local communities along the previous alignment as well as reduce impacts to biological resources, and in particular, the Stone Lake National Wildlife Refuge, which was in very close proximity to some of the larger features of the project as it was previously proposed.
We also recognized that the material that’s excavated through the tunnel boring process as an asset, whereas in previous administrative drafts, we hadn’t considered whether or how the material would be reused, said Zippin. “So we took it a lot more seriously and recognized it as an asset that could be reused in a variety of different beneficial purposes. This material we call ‘reusable tunnel material’; it’s mixed with a non-toxic biodegradable conditioner to help the tunnel boring machine move through; it is then transported to the surface and then dried for a period of time. Tests are performed to confirm its non-toxic nature for beneficial reuse, and we do expect the vast majority of this material to be non-toxic and therefore available for a variety of different beneficial reuses, including perhaps use for construction of the facility itself in certain locations, but the majority would be available for levees in the Delta, tidal marsh restoration, or perhaps elevating Delta roadways,” he said, noting that the SFPUC’s Hetch Hetchy tunnel project has been boring through similar materials, with a large portion of the material being used for tidal marsh restoration in the Bay Area.
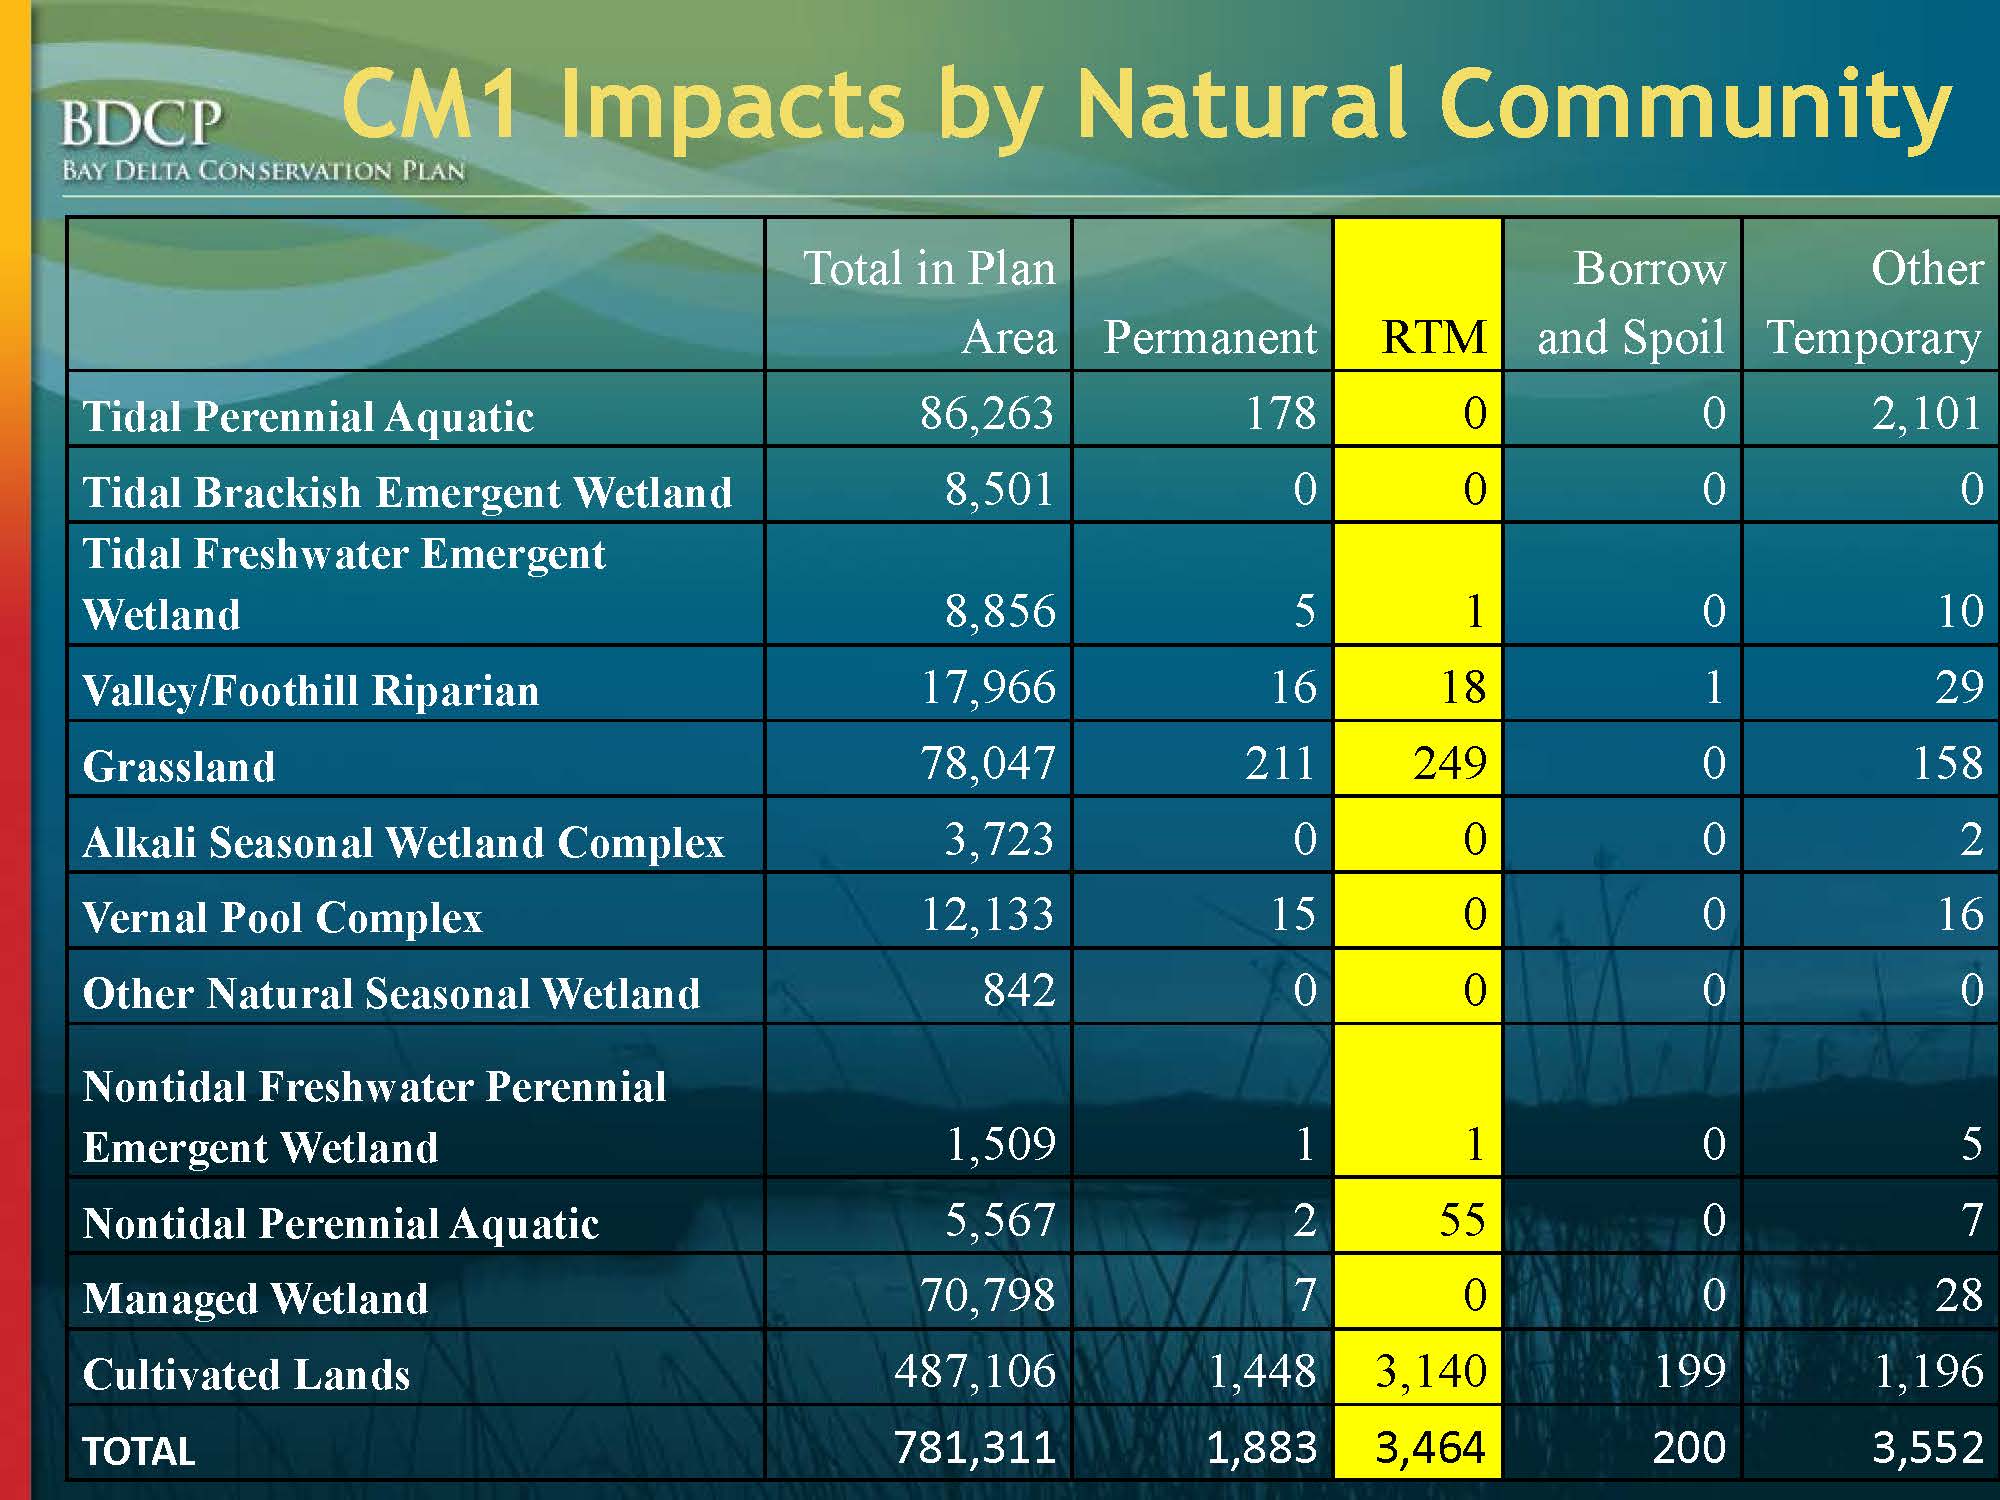 He presented a table that summarized the impacts of the construction of CM1, the water facility, and explained that the table was meant to illustrate that a majority of the impacts are associated with the reusable tunnel material storage areas (the yellow column in the middle highlighted RTM). “We have assumed that those impacts are permanent in our effects analysis, even though, for the most part, they will be temporary. We just don’t know how temporary,” said Mr. Zippin. “It could last several years, perhaps the duration of the construction period which would be up to 9 years.”
 Next, Mr. Zippin presented a slide that showed both the old and new alignments, noting that the old alignment is the lighter gray dashed line to the west; the new alignment is the darker line to the east. He noted that the major changes were in the northern part of the Delta, north of Highway 12, and around Clifton Court Forebay. The intake locations did not change; but the alignment was moved farther east. “The primary reason the alignment was moved to the east was to reduce impacts to the communities there around Walnut Grove and to reduce traffic impacts; there were operating natural gas fields that posed a serious conflict and we were able to avoid those by moving the alignment farther east,” Mr. Zippin said.
DWR will be deepening and enlarging Clifton Court considerably which provided the engineering flexibility to reduce the size of the intermediate forebay from 750 acres to 40 acres, which reduces surface impacts and effects to terrestrial covered species. DWR is trying to use more public lands and more state property for the reusable tunnel material storage sites, he said.
South Delta operations have been revised to be more restrictive and more protective of fish, including at the Head of Old River Barrier; those operations are all described in the CM1 in Chapter 3, Mr. Zippin said. There is a new section called the decision tree which has revised outflow criteria for the spring and the fall.
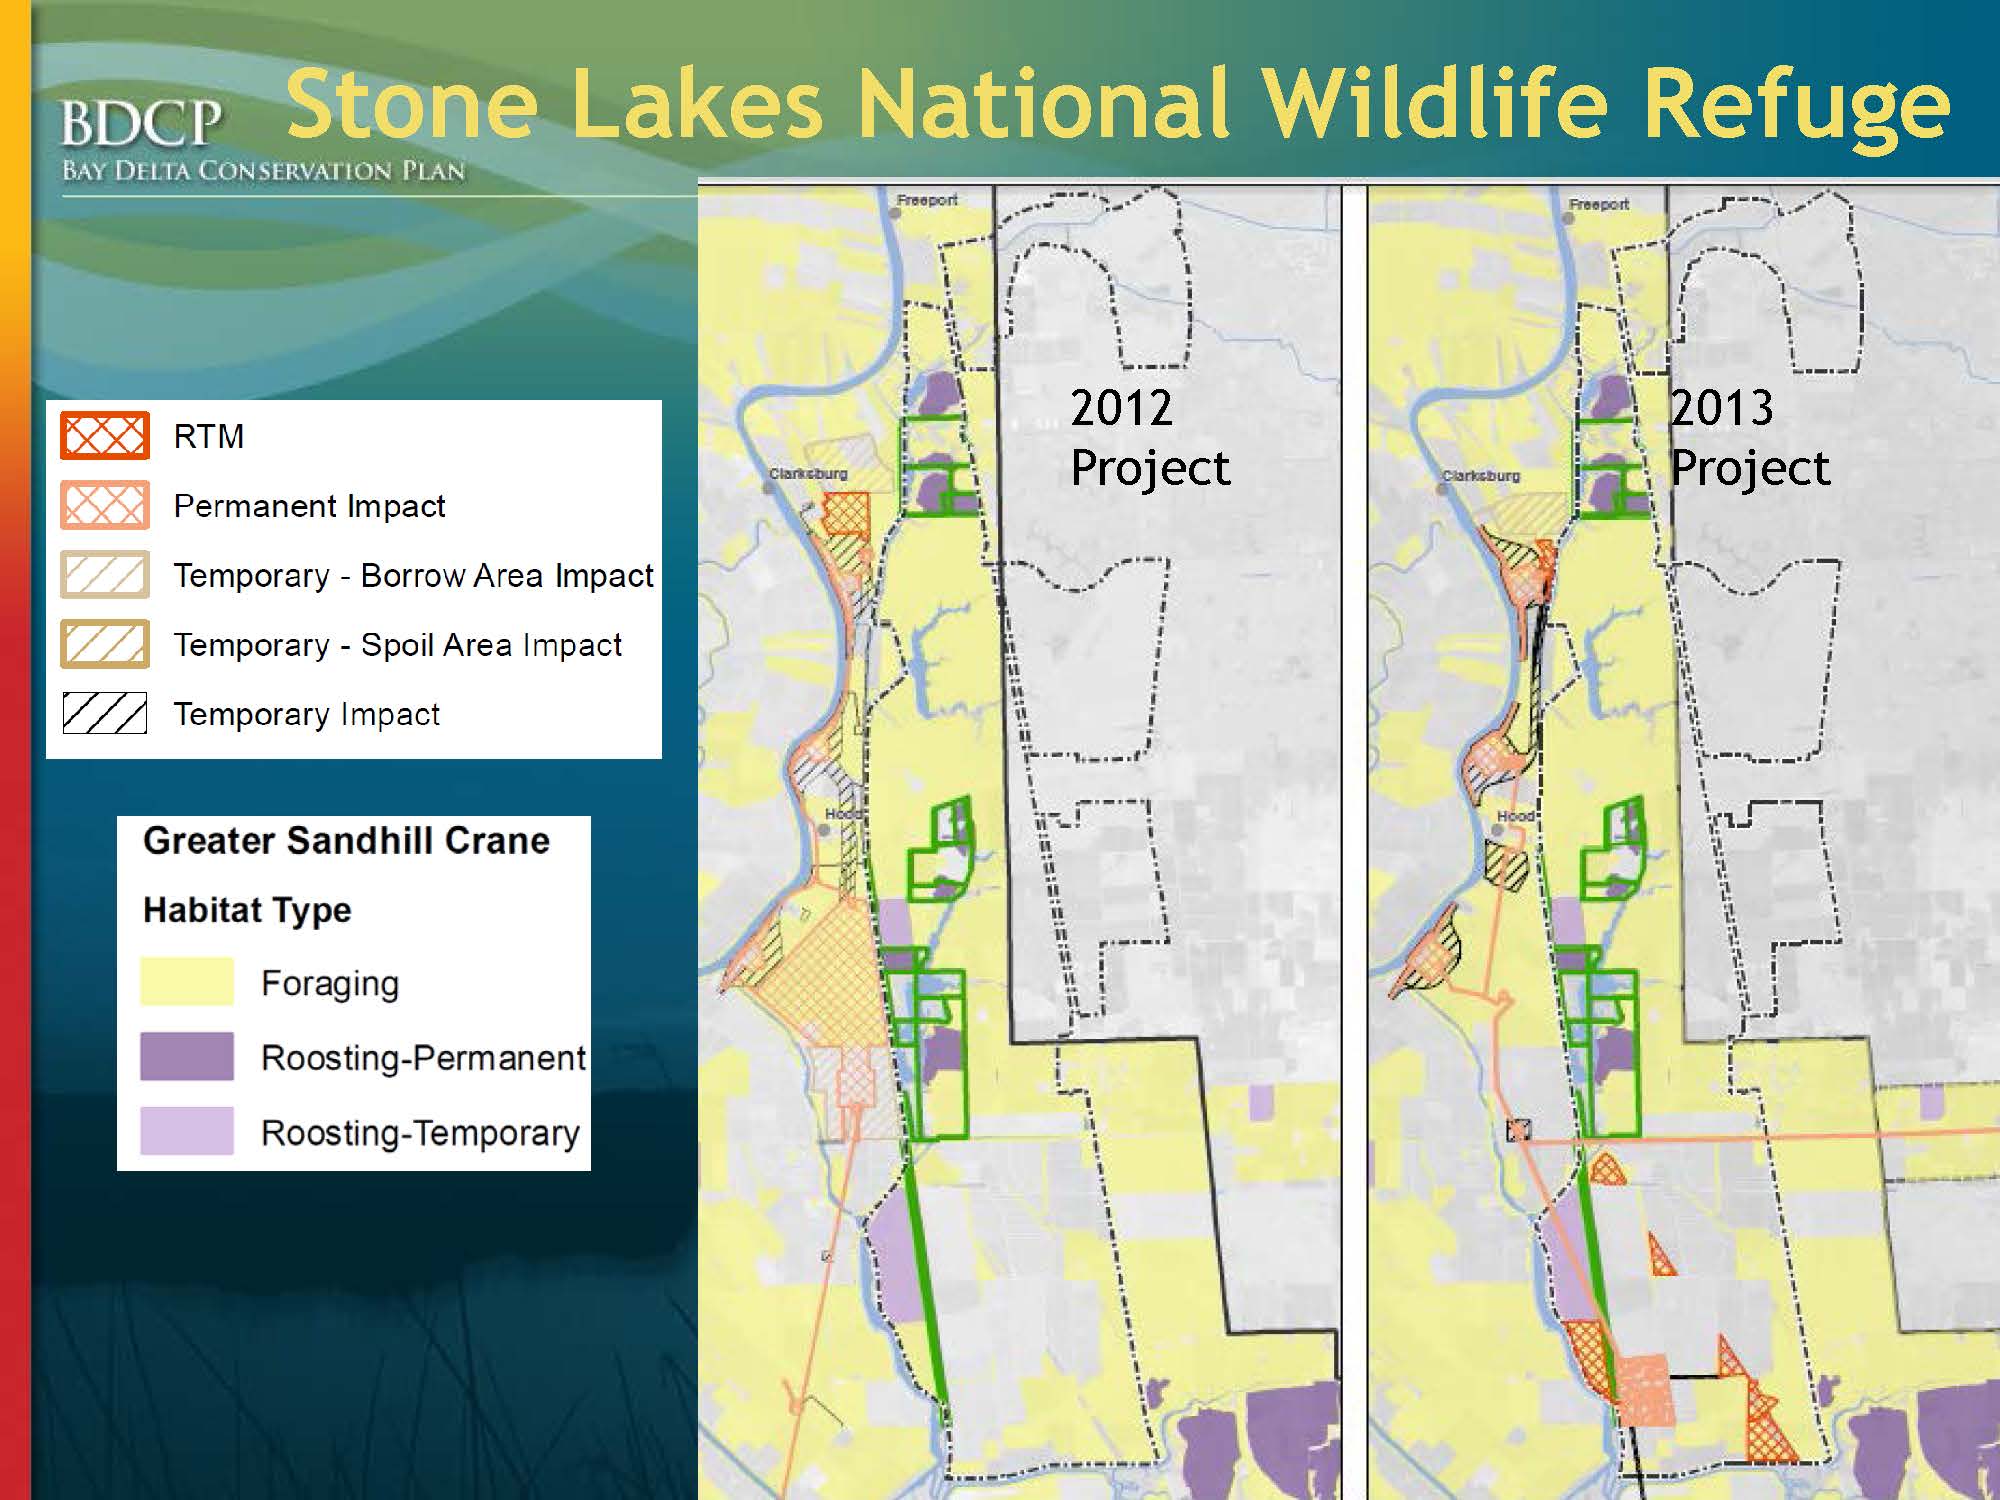 The new alignment reduces impacts to Stone Lakes National Wildlife Refuge, but there are new impacts on Staten Island as a result in this shift in alignment, he said. He then presented a slide that showed the changes that had been made to the intermediate forebay that was located close to the refuge. He noted the red hatched zone notated on the map just south of Hood which was the previous location for the larger forebay. We wanted to resolve the issue of a large facility adjacent to the refuge, so now with the forebay reduced to 40 acres, we were able to move it far to the south, Mr. Zippin said.
The triangular shaped parcels are state owned land in that area. “That’s all vineyards in that part of the approved refuge boundary, which is very low quality habitat, almost no quality habitat, so we would not be removing or disturbing areas used by covered species,” he said.
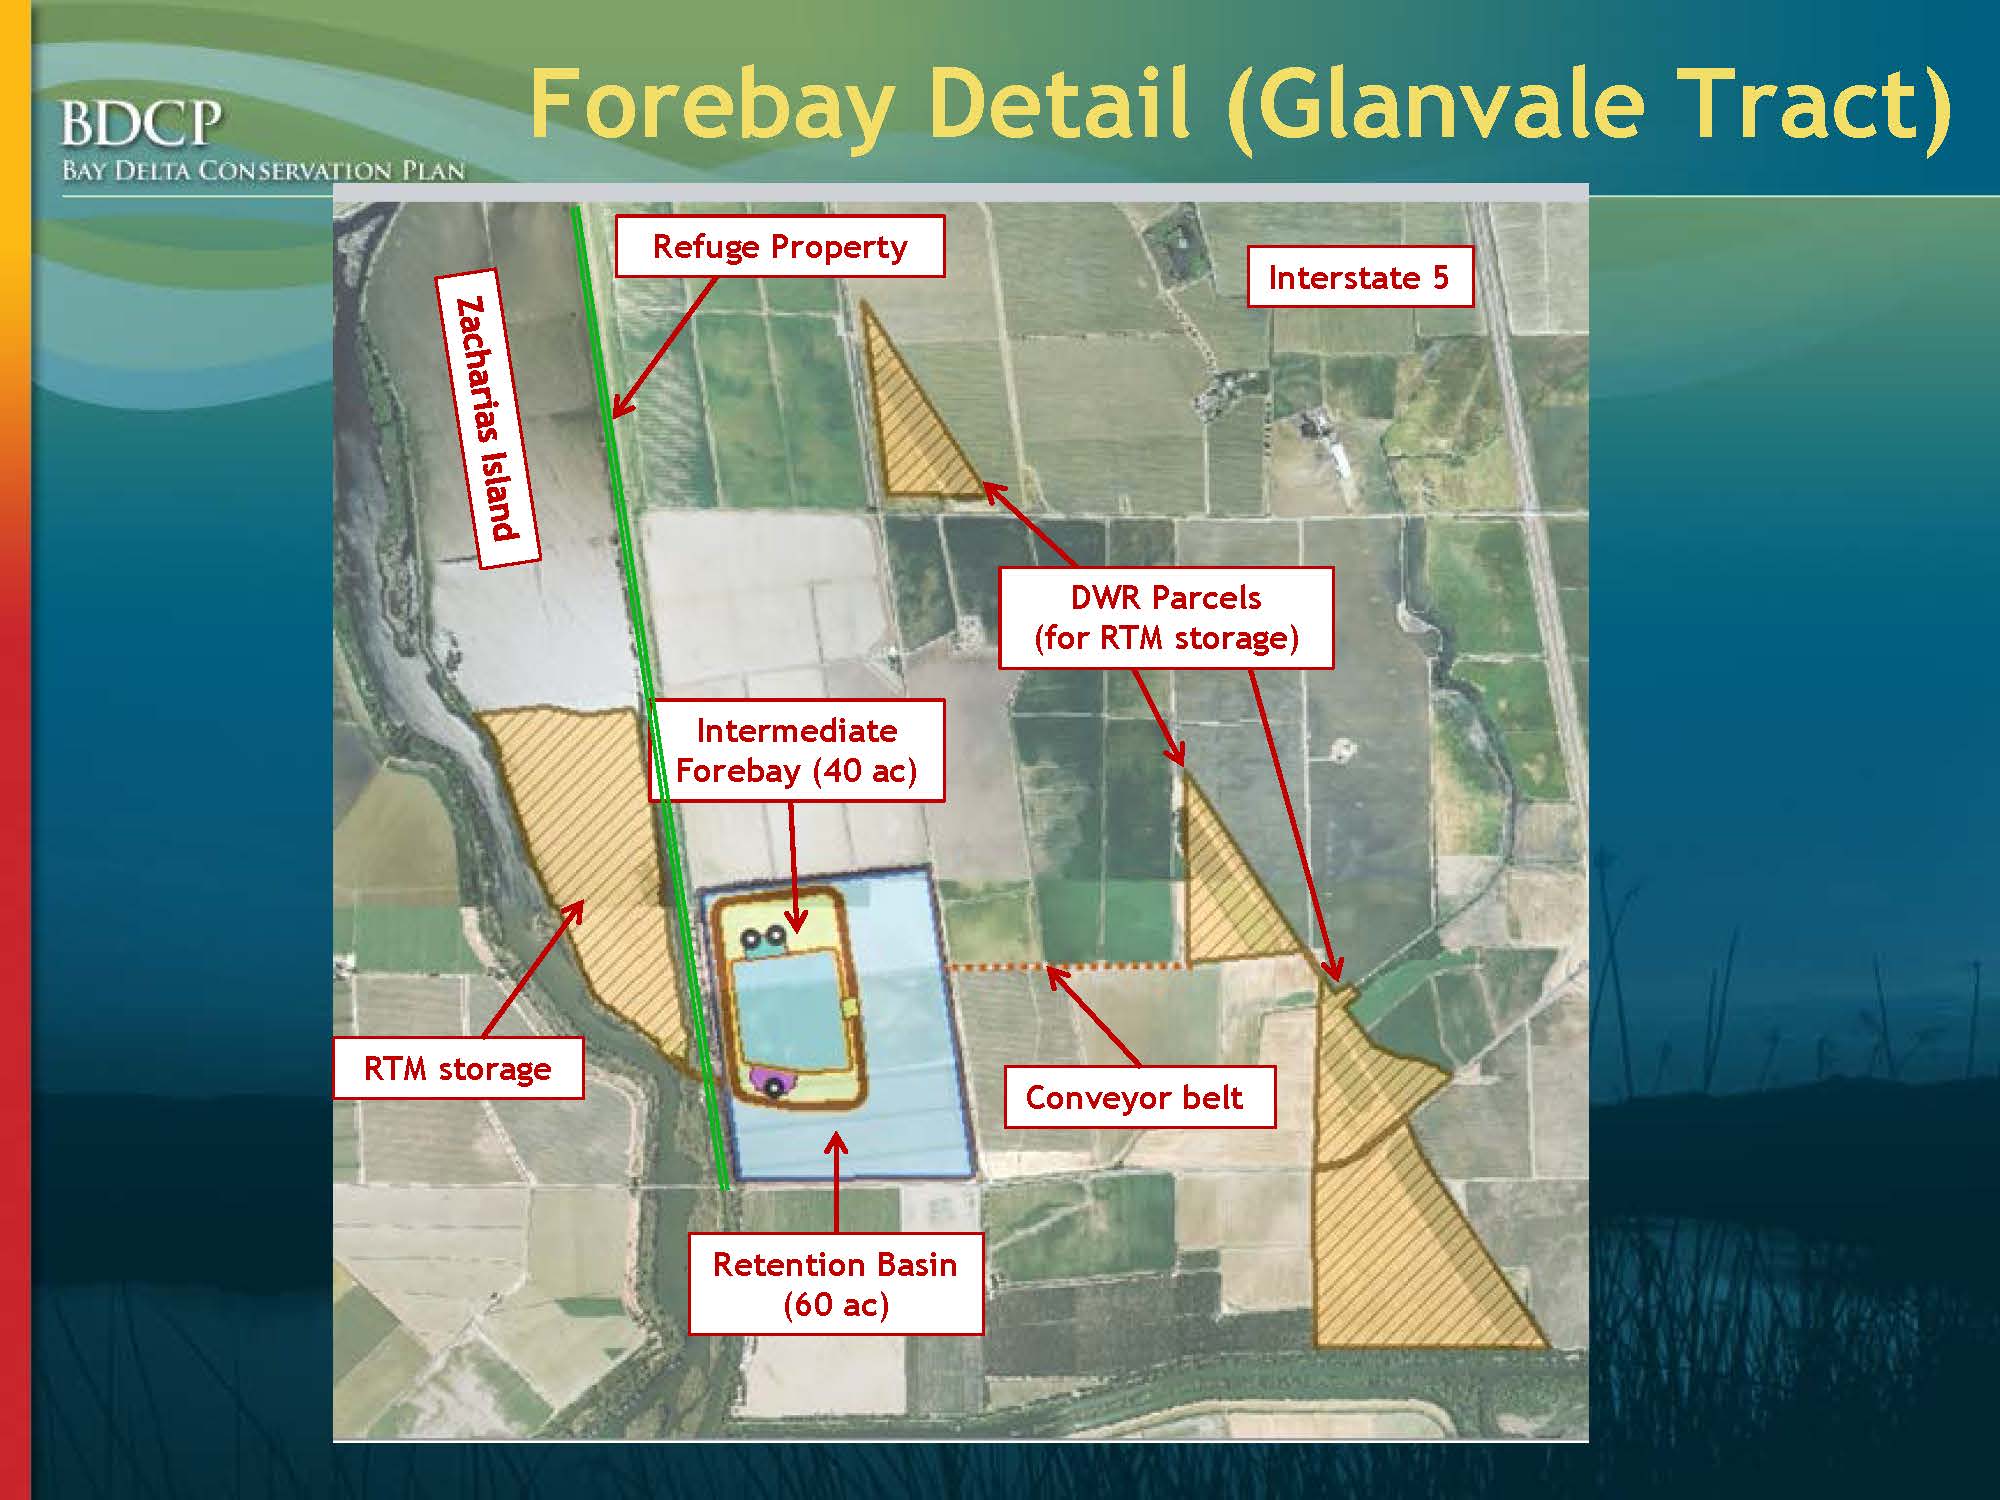 The one exception is at a site called the Glanvale tract, Mr. Zippin said. “Reusable tunnel material storage is planned to occur to the west of the intermediate forebay, which is in the past has been used for sandhill crane foraging; it no longer is just because of the change in crop type. We see that as a great opportunity for restoration potential once that site is no longer needed for storage.”
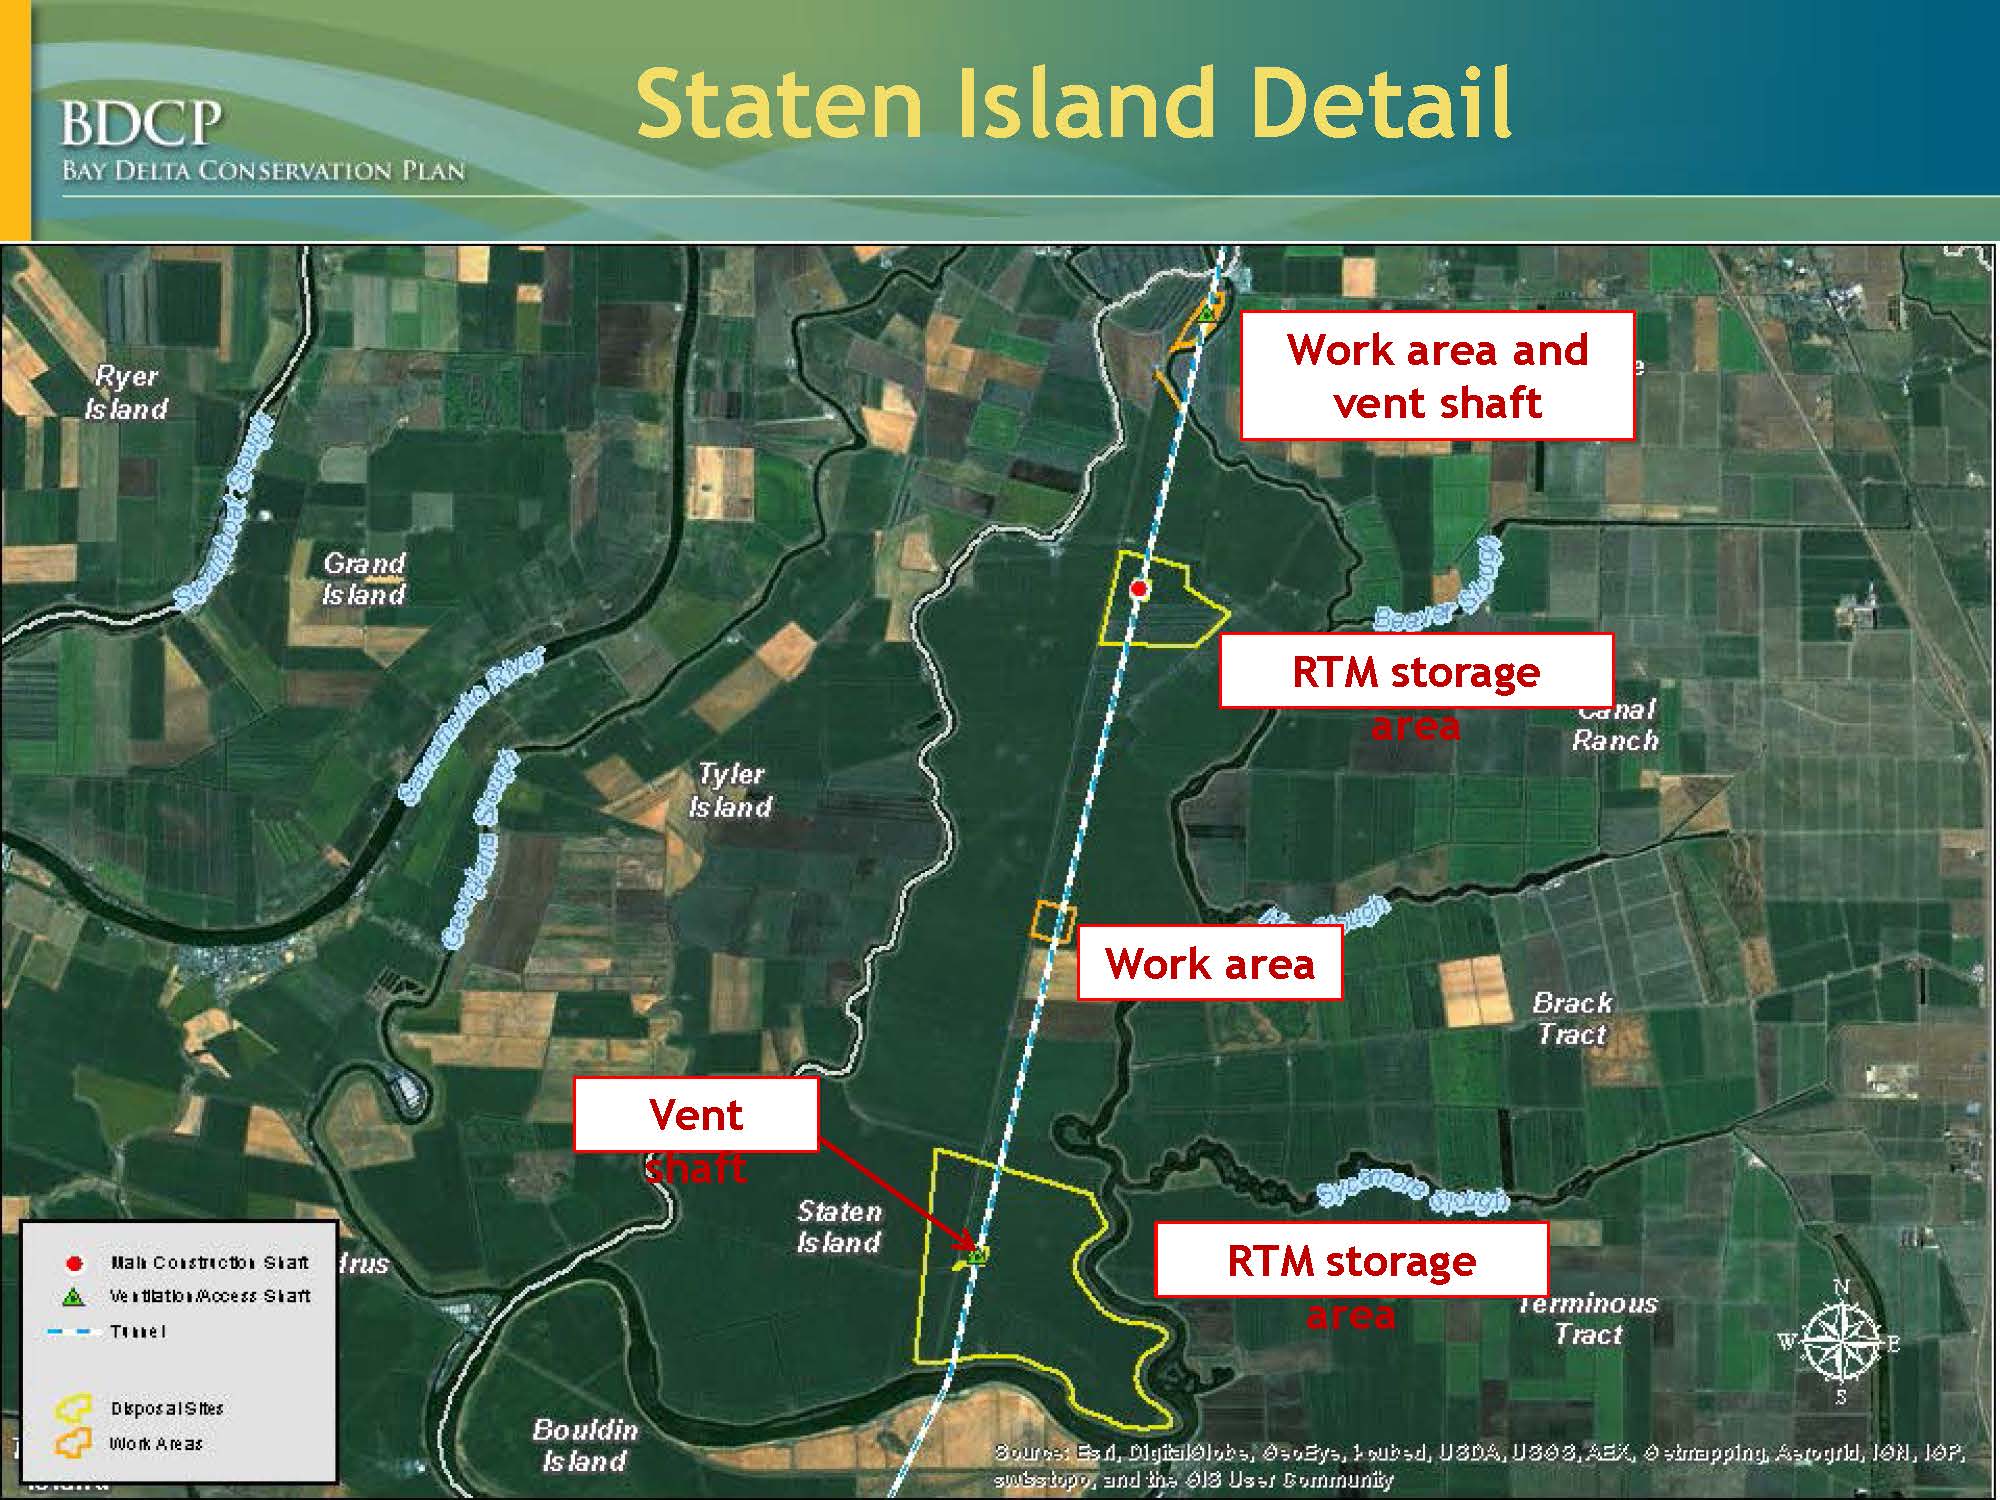 Mr. Zippin then presented a slide of Staten Island. Noting that the tunnel alignment is the blue and white dashed line, he said the only surface features are the yellow polygons, which are either reusable tunnel material areas or work areas. “Once the reusable tunnel material is moved away from the site or reused beneficially perhaps onsite, all that would be remaining would be those two orange boxes which would be vent shafts for the tunnel itself.” He said that they have attempted to design the locations of the storage areas to avoid any impacts to the sandhill crane’s roosting habitat, and they are in continuing discussions with stakeholders to further reduce impacts to the cranes.
 Next, he presented a slide detailing the planned changes at Clifton Court. Mr. Zippin explained that the forebay would be split as denoted by the horizontal green line; water from the north Delta diversions would enter the forebay on the north side; current south Delta diversion would empty into the southern portion. The southern portion would also be expanded and the entire forebay would be deepened to increase capacity. “The reason they have to be separated is that water coming in from the south Delta pumps contains fish and the water coming from the north Delta pumps does not,” he said.
Another advantage of the realignment was a reduction in the length of the tunnel by almost 5 miles, he noted, a significant savings in cost, effort, and material, Mr. Zippin said. He also noted that the changes at Clifton Court have reduced the loss of grassland, but “there is some slight additional increase in vernal pool complex impact, but we are avoiding pools,” he said.
The water operations have been revised, he said. “The south Delta operations are now more protective of fish,” he said. “We use criteria that were called Scenario 6. There’s also more detail now in the CM1 on real time operations, both in terms of the procedures and decision making. And the decision tree process is intended to address the uncertainty surrounding outflow needs for Delta smelt in the fall and longfin smelt in the spring.”
Ellen Berryman, ICF International: Revisions to the terrestrial species effects analysis
Ellen Berryman then discussed the revisions to the terrestrial species effects analysis:
- Four species have been removed from the covered species list: The Townsend’s big eared bat, the California least tern, the Western spadefoot toad, and the caper-fruited tropidocarpum because the species either were determined not to be in the plan area or covered activities were determined not to affect them.
- A number of revisions have been made to the conservation strategy for terrestrial species, most notably, increased conservation for the giant garter snake, the salt marsh harvest mouse, the greater sandhill crane, and Swainson’s hawk.
- There were additional revisions to refine the conservation requirements for some species, such as for the riparian brush rabbit, a requirement was added that at least 800 acres of the riparian restoration would need to meet the habitat requirements for that species and a provision was added for adjacent grasslands to provide refugia during flood events; a species specific objective for the California black rail was added to specify that at least 1700 acres of the freshwater marsh restoration must be suitable for that species, and there is more specificity to the greater sandhill crane strategy related to things like the locations of conservation.
- The giant garter snake conservation strategy has been revised to increase conservation acreage and to be consistent with FWS’s draft recovery plan.
- A number of revisions have been made to salt marsh harvest mouse strategy, including increased specificity in the acreage and conservation targets, including a requirement for uplands beyond the restored marsh habitat to provide refugia during flood events
- For greater sandhill cranes, there is more specificity on the location of conservation in relation to impacts from conveyance facility construction and also in relation to potential flooding, including both sea level rise and seasonal flooding events; there is added detail on the minimum patch sizes for restored habitat, 180 acres have been added to roost site restoration within the Stone Lake NWR boundary; and the requirement for roost site restoration is no longer contingent on cranes abandoning the old roost site and needs to be created, regardless.
- The cultivated land for Swainson’s hawk was increased from 33,700 to 43,325 acres with the requirement that at least 50% of that needs to be managed as alfalfa, which has the highest value habitat for the species, an elevational requirement was added to ensure that the foraging habitat conservation isn’t concentrated in areas that are highly vulnerable to sea level rise, and added conservation of other natural communities, such as grasslands, as foraging habitat for the species.
- We worked with the wildlife agencies to identify key landscape linkages and added language to conservation measures 3 and 11 regarding the protection and enhancement of those linkages.
- Avoidance and minimization measures for greater sandhill crane: We added measures to avoid and minimize the indirect effects of conveyance facility construction and impacts of bird strikes from the transmission lines. A performance standard was added to specify no net loss of crane days on Staten Island, to be achieved by shrinking the footprint as much as possible and away from crane use areas. Another performance that was added to specify no net increase in bird strike risk from transmission lines, which would be achieved through a combination of siting the transmission lines in the lowest use areas for cranes, adding bird strike diverters, and potentially also underground existing lines to reduce bird strike risk in the plan area.
- An avoidance and minimization measure was added for the Swainson’s hawk that calls for minimizing loss of nest trees during near term implementation that includes transplanting and moving mature trees into nearby conservation areas in association with protected foraging habitat.
- The species habitat models and descriptions have been revised to enhance repeatability, and clear descriptions of minimum mapping units have been included
- Revisions to the terrestrial effects analyses (Section 5.6) include revised assessments due to model revisions and the new CM1 footprint, reusable tunnel material” is treated as a permanent impact, and new conservation strategies, avoidance and minimization measures have been incorporated;
- A number of analyses have been added including an assessment of recreational activities in the reserve system, expanded descriptions of the indirect effects of methylmercury on covered species, an analysis of effects of enhancing managed wetlands on species that use that habitat, an analysis of bird strike risk from the transmission lines, and a detailed assessment of potential indirect effects of the conveyance facility construction on sandhill cranes.
- The analysis for the Yolo Bypass operations and the flooding has been revised. Seven different flood scenarios were analyzed and existing conditions compared with future conditions under each scenario, and assessed the potential loss of giant garter snake rice habitat as a result of flooding.
- The beneficial effects section was revised to better clarify how quantitative habitat benefits were derived; objectives were refined or added where needed to ensure the estimated benefits will be achieved; references the beneficial effects sections to the objectives and conservation measures have been added, and the net effects descriptions have been revised to better clarify how the quantitative net effects estimates were derived.
- In regards to adaptive management and monitoring, there was specificity added to sections 3.6, appendix 3D and the conservation measures related to monitoring and adaptive management in addressing key uncertainties, but Ms. Berryman noted that this is a work in process and they are still coordinating with the agencies to further provide additional specificity, prioritize species from monitoring, and identify additional key uncertainties for selected terrestrial species.
Rick WIlder, ICF International: Revisions to the aquatic species effects analysis
Rick Wilder, one of the authors of the aquatic section, then followed with an overview to the changes to the aquatic effects analysis, the eleven covered fish, and aquatic natural communities.
Global changes to chapter 5 and the appendices include:
- The entire analysis has been updated to reflect the new facilities using three operational scenarios: “ESO” or Evaluated Starting Operations, which is the starting point for operations of the project during the evaluation; “HOS” or High Outflow Scenario, which includes both fall and spring outflow standards; and “LOS” or Low Outflow Scenario, which did not include either the fall or spring outflow standards.
- Additional model documentation has been added to help the reader to better understand the models and tools that were being used.
- New literature or tools have been added as relevant and available
- Net effects have been revised substantially: text has been revised to for more logical flow and better understandability, attributes (formerly called stressors) have been more accurately defined, agency staff input has been incorporated on the attribute ranking and effects scores using systematic methodology.
- Salmonids have been separated by stock or race and by the watershed or origin, as well as the time they spend in the Delta, and further considered as either a forager (individuals who spend more time in the Delta before moving out to the ocean) or migrants(individuals who pass right through); this essentially determined the exposure of the BDCP project on each of these individual races.
- Net effects are tied back to the biological goals and objectives where possible.
Appendix 5A – Climate Change
This is a new appendix to the panel that deals with the effects of climate change on the covered species, independent of the BDCP. “We ran the analysis using just the baseline conditions into the future, the changes of which were primarily due to climate change,” Mr. Wilder explained. “Then we analyzed the effects that climate change would therefore have on flow and temperature conditions primarily, although there are a couple of other effects that we analyzed, and then related that back to the effect that it would have on the covered fish species.”
Appendix 5B – Entrainment
This appendix deals entirely with entrainment. Some of the changes include refining the methods that were applied to adult Delta smelt to be consistent with the FWS biological opinions analysis and updating the particle tracking model methods and results. The starting distributions used for Delta smelt have been revised to be more consistent with the distributions in the Delta, and additional hydroperiods have been added to make a broader range of flow conditions for the analyses. “The results, in a nutshell, show that there was reduced entrainment across all species, compared to both the baselines and the previous analysis which included the old operations,” said Mr. Wilder.
Appendix 5C – Flows
Global changes to the appendix:
- Conclusions have been moved to chapter 5: “This was done simply because this appendix was so large, some of the readers were thinking that the entire effects analysis were found in this appendix, once they got to the end. So we just decided to remove them from this section and move them back into Chapter 5.”
- The presentation has been streamlined and standardized for consistency and ease of reading.
- The accuracy and consistency of timing of the life stages has been improved using input from the agencies.
- There is a discussion of discrepancies between model results.
- Overall the effects were limited only to the plan area and to the Feather River and so that’s a preview of what you’ll read.
Changes to In-Delta and Passage:
- The Delta passage model results have been updated for Chinook salmon
- Particle tracking model analyses using nonlinear regressions have been added
- An analysis of through-Delta smolt survival for spring run and fall run Chinook salmon that was based on equations found in Newman 2003
- An analysis of reverse flows entering Georgiana slough has been added.
- Analyses related to the Yolo Bypass have been added and refined: the proportion of Chinook salmon that benefit from CM2, an evaluation of fry growth of Chinook salmon in the Yolo Bypass as compared those to individuals that would be using other routes through the Delta, and an evaluation of the effects of the Fremont Weir notching on the Lower Sutter Bypass inundation.
- There are a few new analyses added related to the north Delta diversion, including reverse flows associated with Georgiana Slough and an evaluation of salmon survival associated with the north Delta diversion.
- The turbidity analyses have been expanded, including the addition of a new attachment to appendix 5C dealing specifically with turbidity.
Upstream changes:
- The upstream temperature analyses for salmonids and sturgeon have been completely revised. “This was based on comments that we had received from NMFS, so we worked collaboratively with them to develop an entirely new analysis,” Mr. Wilder said.
- “We also confirmed that there was no effect to the nonlisted spring and fall run races of Chinook salmon as well as steelhead in the Trinity River, and as a result of that, those analyses showed no effect,” said Mr. Wilder. “So to streamline the document, we removed those sections from the Trinity River section, just to make it much more readable.”
- A worst case scenario for Chinook salmon was added. Using the SALMOD model, all four of the salmon races were analyzed, looking at the number of years with less than 100,000 juveniles produced, and evaluated that under each of the different model scenarios.
Appendix 5D: Contaminants
- Updated mercury model: The analysis was revised, using an updated model from the Central Valley Regional Water Quality Board, and those results have been incorporated. “It turns out that they were similar to the previous simplified analysis that we did, so we reported both of those results,” he said.
- Updated selenium model: The selenium model has been updated to include white sturgeon.
Appendix 5E: Habitat Restoration
This appendix describes the effects that the BDCP habitat restoration and enhancement would have on suitable habitat, food production, and other ecosystem level effects. “In a nutshell, we found that habitat restoration has the potential for substantial benefits related to suitable habitat and food resources for all of the covered species; however, there’s a lot of uncertainty related to the effects that habitat restoration would have on food and suitable habitat, so we made a valiant effort to acknowledge this uncertainty throughout this appendix,” said Mr. Wilder.
Appendix 5F: Biological stressors
The modeling analysis looking at predation loss at the north Delta diversion was refined using a bioenergetics modeling analysis, and a number of Microcystis analyses have been added throughout.
Appendix 5G: Fish life cycle models
This appendix reviews and screens available life cycle models and determines whether they were applicable or not to the BDCP. “We identified two models in particular that were applicable and we used them in the analysis. Both of them were winter run Chinook salmon models called IOS and OBAN,” Mr. Wilder said. “The results that we found from the analyses are mixed regarding the effects of BDCP on winter run Chinook salmon, and it really depends on the outflow scenario we used, whether it was ESO, HOS, or LOS. Turns out that both models are highly sensitive to upstream temperatures in the Sacramento River and while the temperature modeling indicated slight increases in temperatures, the BDCP description states that there will be no changes in Shasta operations, so we’re a little unsure and uncertain how to interpret these results from reality.”
Appendix 5H: Aquatic Construction
Only small revisions, no major changes.
Jennifer Pierre, ICF International: Response to the panel’s previous comments
Jennifer Pierre then finished the presentation by discussing how ICF International incorporated the comments from the science panel’s previous reviews into the draft effects analysis.
Adaptive management is integral to plan implementation; the adaptive management section, chapter 3 and section 3.6, has been substantially revised and updated. The BDCP is now using an adaptive management process that is very similar to the Delta Science Plan’s process, Ms. Pierre noted. “To the extent that we can, we are linking specific uncertainties and questions that we have in the effects analysis back to the adaptive management plan and we’ll continue to do that,” she said. “So especially related to the decision tree and other key uncertainties, we’ll continue to work towards identifying what those questions are and how we might answer them.”
How the biological goals and objectives were applied and integrated into the effects analysis was another area of interest, Ms. Pierre said. “We did assess as much as we could, but the biological goals and objectives, especially for fish, are ‘aspirational,’ some might say. Even in the face of 35 models used for the fish effects analysis, we have some tool limitations, and this is another area that can be identified and worked on and developed through adaptive management and through the BDCP science program. But where we stand today, there’s a lot of instances where we can’t map as well as a lot of people would like the biological goals and objectives to the effects analysis … a lot of what would need to be developed for understanding the biological goals and objectives and how well they are being met is really an implementation process versus an analysis process, but to the extent that we are able to map the biological goals and objectives to the effects analysis, we’ve done that in Section 5.2, table 5.2.8.”
The panel had asked if there was a way to take the scoring from the net effects on fish and sum them across. She noted that previously, a score was developed based on the magnitude of change and certainty of what was predicted, and those were present individually. Panel members had asked if we could sum those across and come up with an overall number of the effect on the species, much like a scaled grade for net effects. “We did look into that, but this was one area we weren’t able to do that and the reason is that in a lot of instances, for the aquatic species, the attributes are overlapping. For example, flow is a primary driver on many of the attributes we are looking at, so there’s a lot of concern about are we double counting certain changes, so we felt like they really needed to be kept separate for that reason,” explained Ms. Pierre. “We also wanted to make sure that the certainty was not confounded or otherwise masked by not having these more explicitly and individually identified. The net effects conclusion itself does try to narratively combine all of that scoring, so we are hoping we’ve addressed the spirit of this comment, which is to better integrate what the overall effect of each of these attributes are.”
Panel members asked for more information regarding species accounts and background information, but at the time of the last review, a lot of the other chapters weren’t as well developed, she said. “So we provided a brief history of each species in the net effects section … we tried to set up the context around each species so that in effect, each species net effects is a standalone summary of the effects we found,” she said, “and the full species accounts of included in chapter 2. So that’s another area where we’re hoping to address the spirit of the panel’s comments but maybe not to the letter.”
Regarding the net effects for other species, the panel asked if the same quantitative scoring approach could be expanded to the sturgeon, the lamprey, and the terrestrial species. Ms. Pierre said they were able to that with sturgeon, but not for the lamprey. “Our understanding of how the attributes affect lamprey is a lot lower than the other species … so we opted to keep that one as a more narrative, but based on the quantitative information we had in the appendices.” They weren’t able to apply the same technique to terrestrial species either, but Ms. Pierre said that tables 5.6.7 and 8 provide the description of the net effects on the habitats for these species, noting that section 5.6 is terrestrial species component of chapter 5.
Chapter 5 now includes a map of the Restoration Opportunity Areas, she noted.
One of the areas of greatest improvement is regarding restoration. Although it wasn’t officially part of the panel’s review, they received substantial comments from the panel as well as the agencies, Ms. Pierre said, noting that it has been one of the most common areas of discussion and concern across the board. So in attachment B to appendix 5E, she said they tried to step through what restoration has been done intentionally, where have there been unintentional breaches, what has resulted, what can be learned from that and what are the things that are still left to understand. “We tried to articulate what those uncertainties are, and what the potential benefits are. Some of the lessons learned are really related to the benefits we’ve seen; some of them are related to adverse effects we’ve seen, so how do we take all that and implement a project that provides the benefits that we know we need for BDCP? So that particular attachment to the habitat appendix itself was substantially revised to provide some of that context that the panel and agencies and many other entities have been looking for.”
In our revision of Chapter 5, and section 5.5 in particular, we really tried to tell the reader in the sentences that we were writing where to find technical backup in the appendices, she noted.
More detail has been added to the summary of methods in section 5.2, and section 5.3, Ecosystems and Landscapes, has been updated to include additional information regarding ecosystem level changes in flows, food web changes, temperature affects in the Delta and other areas that are affected by BDCP. “We’re trying to provide a comprehensive story within chapter 5 itself, and that’s why I’d recommend readers actually start in chapter 5, because we think we’ve done a pretty good job of the mapping you back to where you might find a lot of specifics and a lot of detail if you are particularly interested in understanding more of a certain topic,” she said.
There was a panel comment about using more life cycle models. “What we really found is that only about 2 life cycle models are relevant and useful at this time … in Appendix 5G we walk through a whole series of life cycle models that are either currently available or are under development, and try to outline if and how they can be applied,” said Ms. Pierre. “Unfortunately what we found is that a lot of them are very limited in their ability to provide a forward looking analysis … we did try to step through that screening process in Appendix 5G and we ended up with these last two models which are both winter run models, and those were used and incorporated into chapter 5 as well.”
She noted that in their analysis, the net effects are developed based on life stages. “So when I talk about the scoring, we’re not just talking about five species; we’re looking at specific populations and then life stages within those populations, and then how each attribute effects them, so we really have tried to break down, as much as we can, what the effects are even though we don’t have access to a lot of life cycle models that are applicable at this time.”
The panel requested a list or critical unknowns and to identify the key areas of uncertainty; this list is now included in Appendix 3.D, Monitoring and Research. “In appendix 3D we’ve also identified a whole list of monitoring and research needs that are already identified and we’ve tried to link that list into our effects analysis. We’ve tried to be specific about what exactly is needed to be better understood and hopefully you’ll find that’s clear both in chapter 5.5 and with the addition of this appendix,” she said, noting that in addition to identifying the change that is being predicted, they also tried to be clear about the level of certainty of that change and its importance.
There was a table summarizing net effects on terrestrial species included in the previous draft that the panel had asked if the same format could be used for aquatic species. That proved to be impossible, Ms. Pierre said. The conclusions are often complex and require an explanation, so instead they revised the presentation of the net effects for the species to include a summary at the end of each species section that articulates the full conclusion. “I think it’s a more comprehensive way of presenting the information,” said Ms. Pierre. “Of course the net effects tables for fish are also a good visual summary, but a lot of this information is incredibly complex. We are talking about 25 or 30 attributes across four or so life stages per species in various areas; it’s very difficult to summarize all of that in table format.”
Since the panel’s last review, the environmental baselines have been further defined. “We have full species accounts now in Appendix 2A, and we’ve also included summaries in the beginning for each species in chapter 5 itself,” said Pierre. “In section 5.2, which is our methods section, 5.2.3, we’ve also better identified what is the baseline, what are the assumptions we’re making, and what is included in what we’re comparing to. I think in chapter 5 itself, we’ve better bracketed our starting point.”
Habitat conditions are better characterized, both quantitatively with the Habitat Suitability Index analysis in Appendix 5E and qualitatively in Appendix 5E, Attachment B, she said.
Adaptive management, baseline studies, and other research will be used to establish baseline understanding and measure BDCP changes. “There is unfortunately a lot of information that we don’t understand yet about the Delta, and the BDCP is going to be funding and implementing baseline studies to better understand certain key things to get a better grasp on what our starting point is, so there’s a series of avenues that BDCP offers to start to answer those questions as we start this process,” said Ms. Pierre.
The conservation strategy is laid out in Chapter 3, so the panel has been advised to look at that chapter as understanding the conservation strategy will help in the review. “We’ve tried to map out a better sequencing and in fact the sequencing for restoration became a lot more aggressive in July of 2012 as part of the announcement by the Governor was to front-load as much of the restoration as was feasible,” said Ms. Pierre. “Section 3.4 describes the restoration conservation measures which is part 3 through 10, and table 6.1 and 6.2 are great tables that show by habitat type and by year, the progression of what BDCP is requiring to be done, so those are great visuals for looking for over the 50 year planning period to see what we’re planning and committed to doing.”
Additional analysis has been done regarding potential adverse effects on species, and stressors such as Microcystis and invasive clams . “There’s a series of areas that we have tried to hone in on what could be the potential adverse affects. They have their own levels of uncertainty, but they also are captured in the attributes and scoring and so you’ll see in the tables that are presented for the fish that there are some negative numbers, which indicate an adverse change, associated with some predicted or judged level of certainty, so we did try to capture that.”
Previous versions didn’t include much on sedimentation, but a new attachment has been added that tries to predict changes in sedimentation as well as changes in turbidity in various locations in the Delta. “This is a very difficult task. We continue to work on this,” said Ms. Pierre. “I did want to point out that the analysis does show that the north Delta intakes or the operation of them could cause an 8 to 9% reduction in sediment entering the plan area. So we looked at changes on the San Joaquin side and changes on the Sacramento River side, and the net change is captured at the ecosystem level in our analysis, as well as for those species that this might have an effect on. Unfortunately, the restoration opportunity areas are vague areas, so we have tried to predict might they become sources or sinks of this material, and we have tried to outline that, but again that’s an area that’s difficult to predict but to the extent that we can understand this effect, we’ve incorporated it.”
Restoration uncertainty is discussed in the habitat restoration appendix which details what is understood and not understood, the uncertainties and the basis of those uncertainties, including potential adverse effects of invasive clams and aquatic vegetation, she said.
Food web analysis has also been an area of great interest, and with the selenium model, they tried to better look at benthic organisms and how they would interact, as well as what the changes in selenium distribution in the Delta would be. “We did update the selenium model to be more relevant by using the species that are covered that would actually be affected by that,” she said. “We’re not really seeing adverse effects from the project, and we’re not seeing any significant changes from what was presented before.” She also noted that the food analysis in Appendix 5E has been substantially expanded.
Hydrodynamic modeling has been used for modeling the south Delta, and that revision resulted in stricter operations of the south Delta facilities, which is why models predicted reduced entrainment across all species, she said. North Delta bypass flow criteria continues to be evaluated as well. The DSM2 hydrodynamic model was used heavily in the effects analysis and to formulate new operation criteria, and the proposed operations have changed substantially since the last review, she said.
Ms. Pierre said another comment was received regarding the lack of an analysis of the effects on the San Francisco Bay. “There aren’t any effects really to describe in the Bay,” she said. “There’s nothing measurable that’s occurring in the plan area that would be transferred into the Bay and so we are planning to add more discussion about why in section 5.2, but for purposes of responding to this, I just wanted to point that out, that we have looked at the freshwater inflow, and we’re finding that has no potential to affect any of the covered fish species or terrestrial species that we’re looking at.”
Salmon runs have been broken down by population and life stage, with net effects conducted individually for each population, with conclusions made separately for each population and each attribute or stressor, she said.
Another comment from the panel was to maximize the use of the Yolo Bypass. “I’m not sure there is anyone who would disagree with that point,” she said. “We’ve definitely done a lot more analysis about the Yolo Bypass; I think this is one area where we just need to do it and then maximize it.”
We have used sensitivity analyses to the extent that we could, and included more modeling documentation so readers can better understand the model, said Ms. Pierre. The Delta passage model has been used extensively in the effects analysis relative to salmon. All of this is presented in the effects analysis, she noted.
Another comment from the panel was how can the plan get benefits that will immediately benefit declining populations. “I just want to remind everybody that the BDCP is multi-stressor especially for the aquatic species, so there aren’t any aquatic species that aren’t relying on reduced entrainment, improved habitat, improved flow conditions, etc, so all these things come together,” she said. “The CM1, the operational component of BDCP, doesn’t start operations until the new north Delta intakes comes online, so really the front loading of benefits from BDCP does come from the restoration. During that time we’ll be using a decision tree to test outflows and the relationships to fish abundance, but I think you’ll find in the chapter 6 tables and in chapter 3.3 that we’re trying to front load these benefits as much as possible.”
Next Steps
- The panel will meet again January 28-29 in Sacramento. There will be opportunity for public comment at that meeting.
For more information:
- Click here for briefing materials, supporting information, presentations, and the webcast video.
- Click here for more information on the Independent Science Review of the BDCP Effects Analysis.
