

Most of us remember learning about the water cycle, so we can understand easily enough that rain and snow are the ultimate sources of most of our water supply. But what most Californians might not realize is how vast the state’s water infrastructure is that irrigates the farmland and delivers the water to our faucets and how profoundly that infrastructure has remade the state as we know it today.
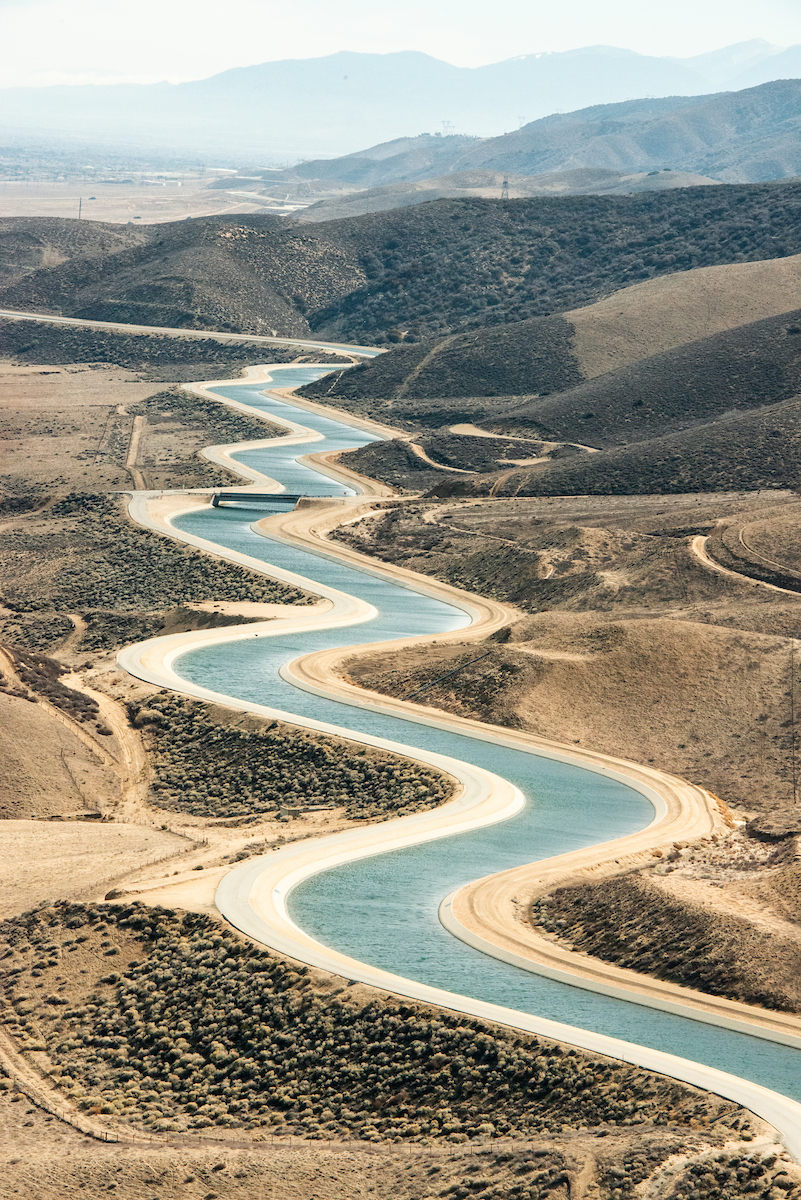
California has built a water delivery infrastructure that is likely the most extensive anywhere on earth, capable of moving a drop of water that originates near the northern border all the way down south to the Mexican border. Through the development of this infrastructure, man has rearranged California’s natural assets to meet societal needs, making the state unrecognizable from its pre-settlement history in the process.
Today, large urban centers exist where there are scant local resources to support their residents. There is cropland where once was a swampy marsh, manmade lakes where there once was desert, and even desert where there once was cropland. Some rivers have been completely dried up, some flow through mountains into other rivers’ beds, and some even flow backward at times. California, arguably, is the most hydrologically-altered landmass on the planet.
So while California’s water comes from precipitation and groundwater, where one’s water comes from depends on where they are in the state. In some places, water is drawn from local creeks and waterways; in others, the water comes from hundreds of miles away. Many communities depend on groundwater. Sometimes it’s a mix of all three.
So why did we do all this?

California’s highly variable climate
California’s climate has always been and will continue to be highly variable. In an average year, the total amount of precipitation is about 200 million acre-feet; however, the actual precipitation can vary anywhere from 100 million acre-feet to 300 million acre-feet, depending on whether it is a wet year, a dry year, or something in between.

About half of the precipitation will evaporate, be used by vegetation, or sink into the subsurface, salt sinks, or flow to the ocean; the remaining half, known as ‘dedicated water’ is what is available for use in cities, on farms, for the environment, or to be put in storage.
In fact, California’s precipitation is by far the most variable in the country. The chart below illustrates this with a color-coded system that measures how much rainfall and snowfall vary each year. Areas shaded in pink experience consistent weather patterns, receiving roughly the same amount of precipitation annually. However, as the colors transition from yellow to green to blue, the variability increases. California, shown in greens and blues, has the highest level of variability; simply put, California has more floods and more droughts than any other state in the nation.

California is also unique in that it has a Mediterranean climate, one of only a handful around the globe. Mediterranean climates are characterized by mild wet winters and warm to hot, dry summers. This is unlike much of the rest of the nation that receive some precipitation year round.

 Additionally, most precipitation falls in the mountains in the middle to northern half of the state, far from major urban and agricultural centers.
The map on the left shows that about two-thirds of all the runoff in the state comes off about 20% of the surface area, and about 90% of the runoff in the state comes off about 40% of the state’s surface area.
The areas shown in red represent 30% of the surface area of California and produce point .1% of the runoff.

California’s water use
The amount of water available to meet agricultural, urban, and ecosystem water demands starts with the state’s annual precipitation. On average, the state receives 200 MAF. Of that, more than half will evaporate, be used by vegetation, or flow to subsurface areas, saline sinks, or the ocean. The remainder, called dedicated water, totals approximately 80 to 85 MAF in an average water year.

However, not all of the dedicated water is available for human uses. Legislation enacted in the late 1970s precludes diversions from parts of the Trinity, Scott, Salmon, Eel, and Klamath rivers. Water from these rivers is now mandated mainly to the environment by law.
What is left is about 60 to 65 MAF in an average year, which is used to supply cities, industry, agricultural irrigation, and environmental uses, and stored in reservoirs and aquifers. In an average year, irrigated agriculture uses approximately 34 MAF or 54%; cities use about 9 MAF or 14%; and 20 MAF or 32% is mandated to meet instream flow requirements and wildlife refuge commitments.
Note: The data and graphic for this section were taken from the Chapter 3 of the Delta Stewardship Council’s Delta Plan.

California’s vast water infrastructure
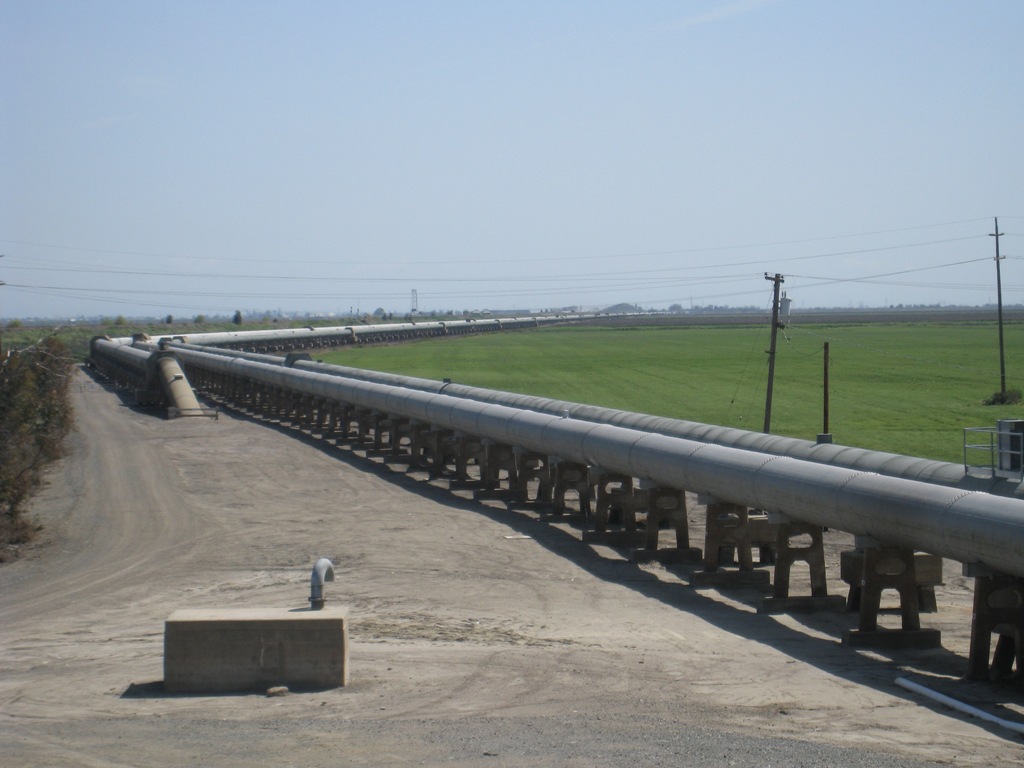
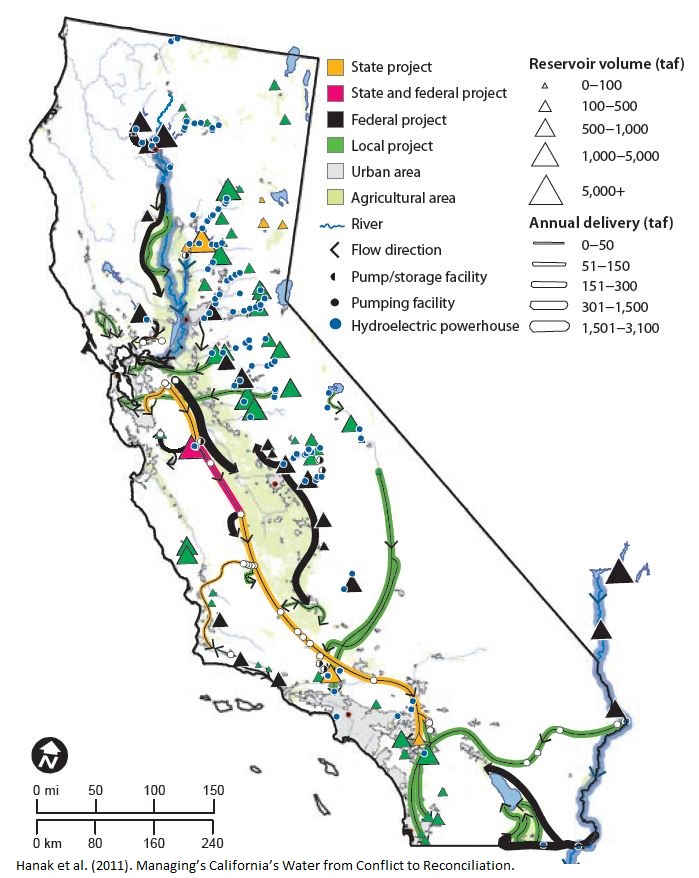 To manage the state’s water resources, California has built a vast network of dams and reservoirs along with thousands of miles of canals and aqueducts to move water from where it is to where it is needed. A patchwork of federal, state, and hundreds of local agencies owns and operates the numerous surface water systems around the state, which range from large to small. These water systems are operated to provide water supplies for cities and farms, provide flood protection for downstream areas, protect fish and wildlife, and generate hydropower.
Yet, the management of California’s water system is no simple task. It’s a delicate balancing act, juggling numerous competing demands. For instance, the most effective flood protection strategy involves keeping reservoirs empty to capture runoff from winter and spring storms. However, water supply managers have the opposite goal during this period-to fill these reservoirs to ensure a steady supply for the summer months. This is just one example of the complex interplay of needs, including those of fish and wildlife, hydropower, and recreation, which often conflict with water supply and flood control efforts. The real challenge for water managers is to find balance in this intricate web of conflicting objectives.
Here is a closer look at the California’s largest water systems:
 The Central Valley Project, the largest of the Bureau of Reclamation’s water projects, delivers on average about 7 million acre-feet for agricultural, urban and wildlife use, irrigating 3 million acres of farmland and providing water for 1 million households in Contra Costa and Santa Clara counties, as well as in the Central Valley.

The State Water Project, operated by the California Department of Water Resources, conveys 2.3 million acre-feet on average from Northern California to the Bay Area, the southern San Joaquin Valley, and Southern California, irrigating 750,000 acres of farmland and providing at least a portion of the drinking water for 23 million people.
For more on the State Water Project, click here.

The Los Angeles Aqueduct System is California’s very first water conveyance system, built in 1913. Owned and operated by the Los Angeles Department of Water and Power, the aqueduct system supplies about 200,000 acre-feet for use within the city limits.
 Owned and operated by the San Francisco Public Utilities Commission, the Hetch Hetchy system delivers about 330,000 acre-feet per year from the Tuolumne River watershed to the city of San Francisco, and parts of San Mateo, Santa Clara and Alameda counties.
Find out more about the Hetch Hetchy Water and Power System by clicking here.
 The Mokelumne Aqueduct, owned and operated by the East Bay Municipal Utilities District (EBMUD), supplies water to 1.4 million people and 35 municipalities in the East Bay, including Oakland, Berkeley, Richmond, and parts of Alameda and Contra Costa County.
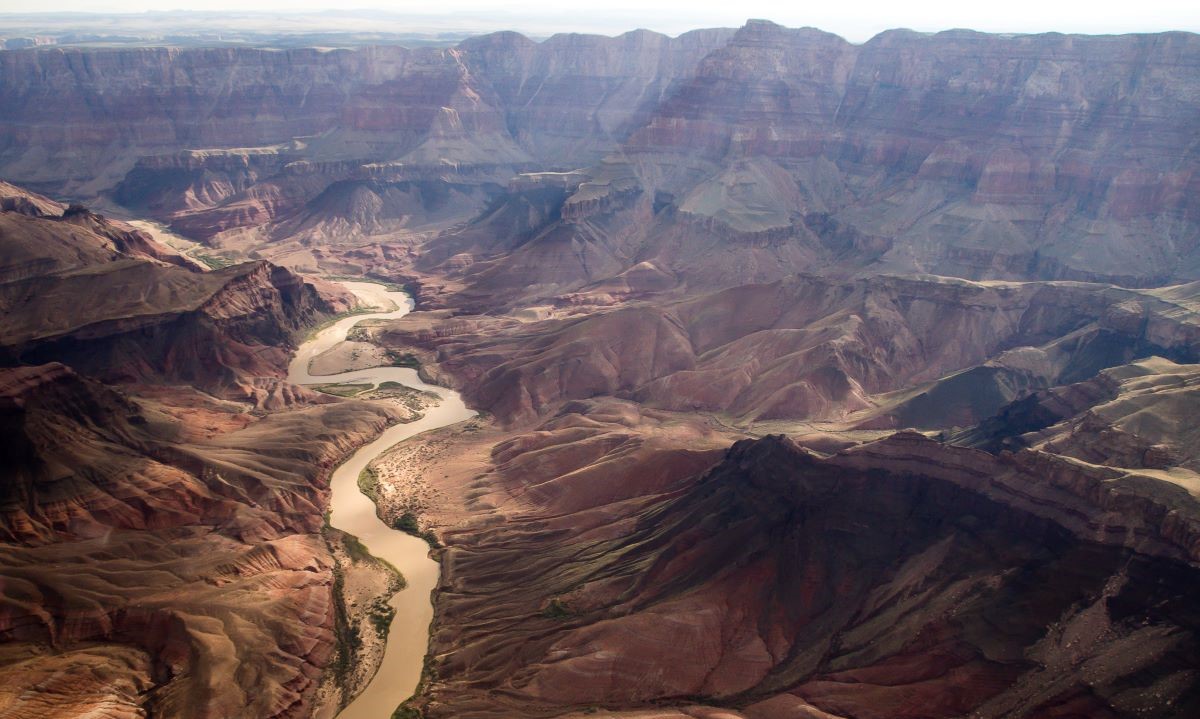 California hold entitlements to 4.4 MAF of Colorado River water which is delivered to the Imperial Valley, Coachella Valley, and Southern California by two systems: The Colorado River Aqueduct and the All American Canal.

The Delta: Critical water hub for the state

And in the center of it all is the California Bay-Delta, a critical water hub for the state, which presents a range of environmental and management challenges.
The Sacramento-San Joaquin Delta watershed covers more than 75,000 square miles, extending nearly 500 miles from the Cascade Range in the north to the Tehachapi Mountains in the south, bounded by the Sierra Nevada Mountains to the east and the Coast Range to the west. Nearly half of the water flowing in the state’s rivers and streams starts as rain or snow that falls within the watershed and flows downstream through the Delta. The Delta watershed is home to the largest estuary on the west coasts of the Americas, as well as the providing the primary source of drinking water for 25 million Californians and irrigation for millions of acres of farmland.
However, the Delta faces severe water supply conflicts, as demands from farmers, cities, and environmental mandates frequently clash. The ecological health of the Bay-Delta is also in jeopardy due to pollution, invasive species, and habitat destruction, leading to significant degradation of water quality. These issues severely impact local wildlife, including endangered species like the Delta smelt and Chinook salmon, whose populations have dwindled due to altered water flows and degraded habitats.
Balancing the needs for water supply, flood control, and environmental preservation in the Bay-Delta remains a formidable task for water managers, who must navigate a complex web of competing interests and pressing ecological concerns.
To learn more about the Delta, click here.

Groundwater is also a critical part of California’s water supplies
 Groundwater is also an important part of the state’s water supplies, comprising about 40% of water used in an average year, and 60% or more in a drought year. But groundwater is very much location dependent: some communities have no groundwater and rely solely on surface water while other communities may have only groundwater; other communities rely on a mix of imported water and groundwater, and even some rely solely on imported water.
To learn more about groundwater, click here.

Water development has fueled California’s economic growth but it’s a mixed bag …
The construction of California’s extensive water infrastructure in the twentieth century has transformed the state into one of the world’s leading agricultural producers, the most populated state in the country, and the fifth-largest economy in the world. The state’s largest urban centers depend on multiple water systems to support their populations, and California’s vast agricultural industry is also dependent on water projects, both large and small.

However, this intensive development has not been without its consequences: dams have blocked access to habitat for native species and altered the natural flow of water, wetlands have been drained, and invasive species have moved in, altering habitat. Populations of native fish and wildlife species have plummeted; some have gone extinct, and many more are threatened. Most of the state’s waterways are impaired by pollutants from agricultural, urban, and legacy mining sources.
Most of California’s water infrastructure projects were designed and constructed at a time when delivering cheap water to feed economic development was a goal, and ecosystem and species concerns were rarely considered.
Changing societal values have meant increased restrictions and regulations to protect endangered species have reduced the amount that can be withdrawn from our waterways and fueled political wars that have stretched on for decades as demands for water from agriculture, cities, and industry must be constantly balanced against the need for maintaining water quality and protecting fisheries and wildlife.
California’s water systems, at a glance
This page was updated on August 17, 2024.
