

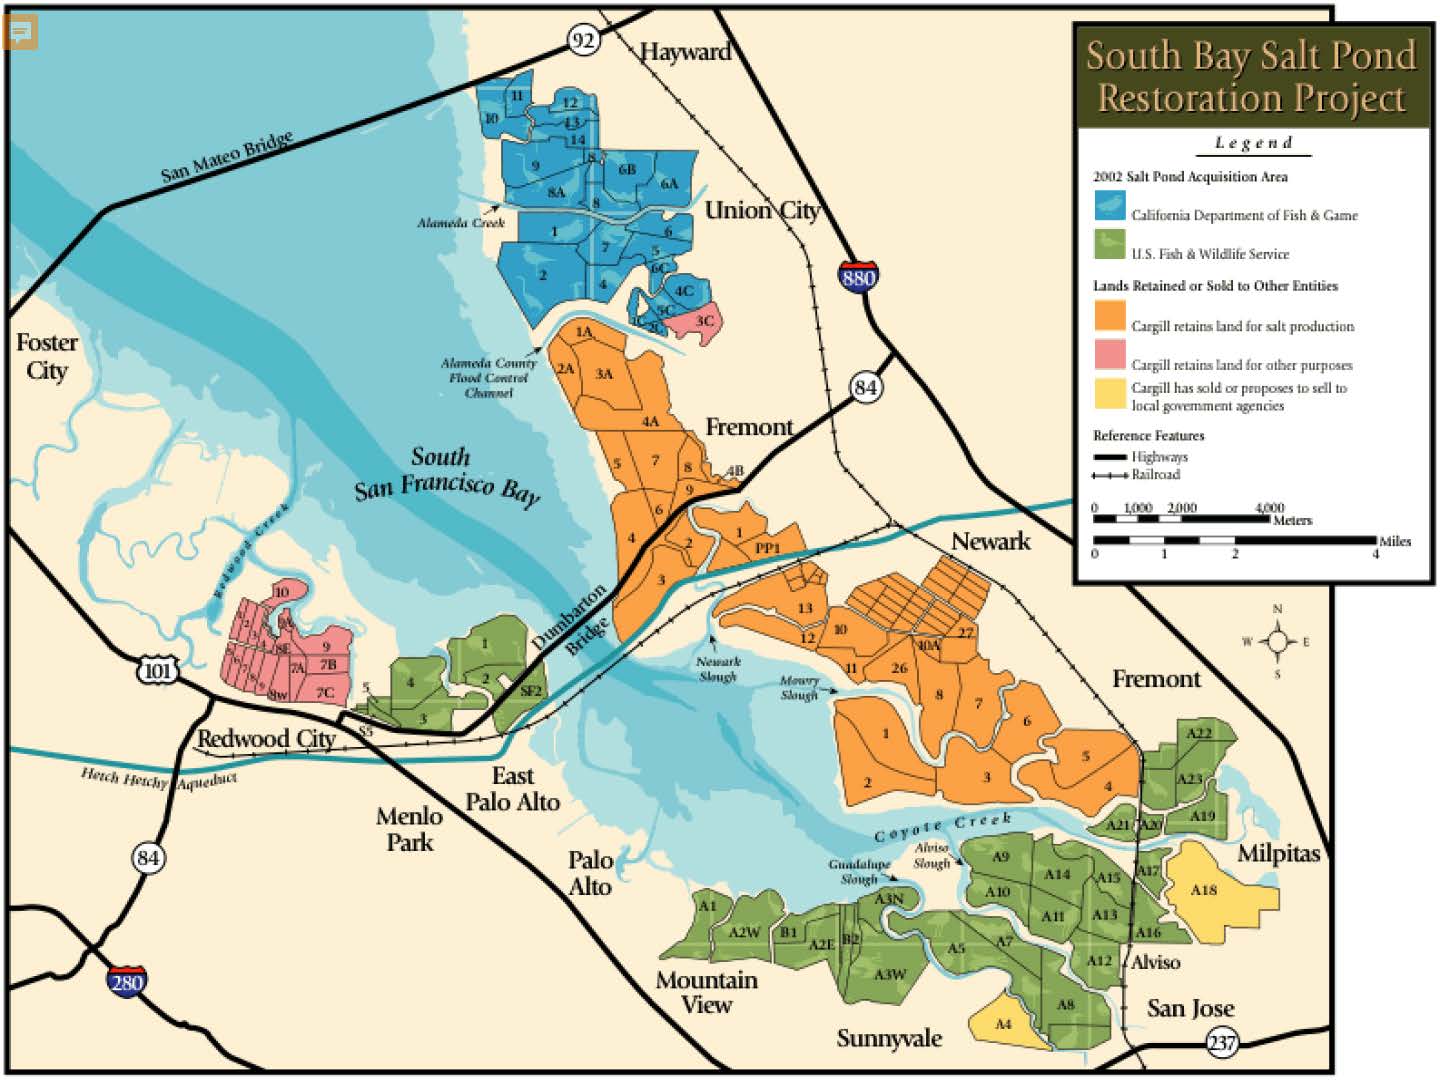
 The South Bay Salt Pond Restoration Project is the largest tidal wetland restoration project on the West Coast. When complete, the Project will restore 15,100 acres of industrial salt ponds to a rich mosaic of tidal wetlands and other habitats. The Project is intended to restore and enhance wetlands in South San Francisco Bay while providing for flood management, wildlife-oriented public access, and recreation. Restoration goals of the project are to provide a mosaic of saltmarsh habitat to benefit marsh species and managed ponds to benefit waterbirds throughout 3 complexes and 54 former salt ponds. It is estimated the Project will take 50 years to complete.
The areas in blue on the map are the lands inside the Eden Landing Ecological Reserve which is owned by the California Department of Fish and Wildlife; the areas in green will be part of the Don Edwards San Francisco Bay National Wildlife Refuge which is owned by US Fish and Wildlife Service. The areas shown in orange and pink are lands retained by Cargill for salt production and other uses.
In 2008, the restoration plan was approved; however, there were significant uncertainties with a project of such a large scale with a long time for completion, so project managers concluded that the best way to address these uncertainties would be to carefully implement the project in phases and learn from the outcome of each phase. So the project has a robust Adaptive Management Plan (AMP) that identifies specific restoration targets for multiple aspects of the Project and defines triggers that would necessitate some type of management action if a particular aspect is trending negatively.
The project has completed the first phase, and is in the process of getting ready for the second phase. At the 2019 State of the Estuary conference, Rachel Tertes, wildlife biologist with the US Fish and Wildlife Service, reviewed the lessons learned from the first phase and outlined the development of the second phase.
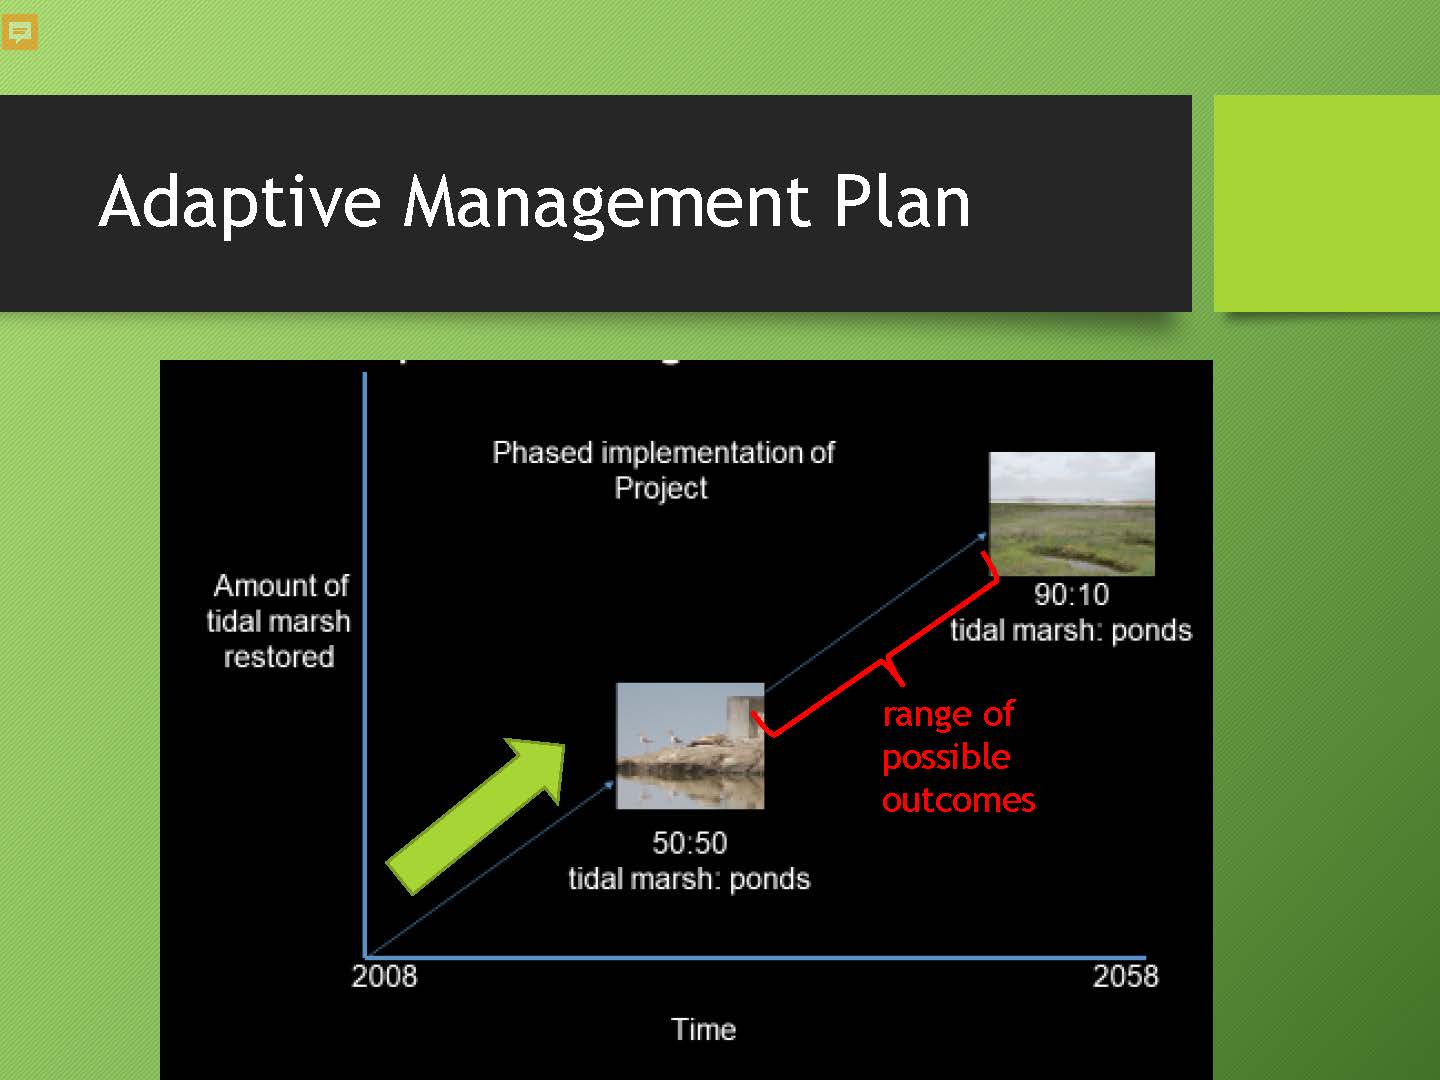 The adaptive management plan has a ‘restoration staircase’ approach depending upon what strategies are successful and which are not. Time is represented on the x axis and the y axis is the amount of marsh restored.
“As we go through this 50-year time frame, we move up this staircase looking at different scenarios,” she said. “A 50/50 scenario which is 50% marsh, 50% salt ponds, or managed ponds up to 90/10 which is 90% salt marsh and then 10% ponds. We don’t really know where we’re going to end up in that spectrum, so that’s what the red is – the range of possible outcomes.”
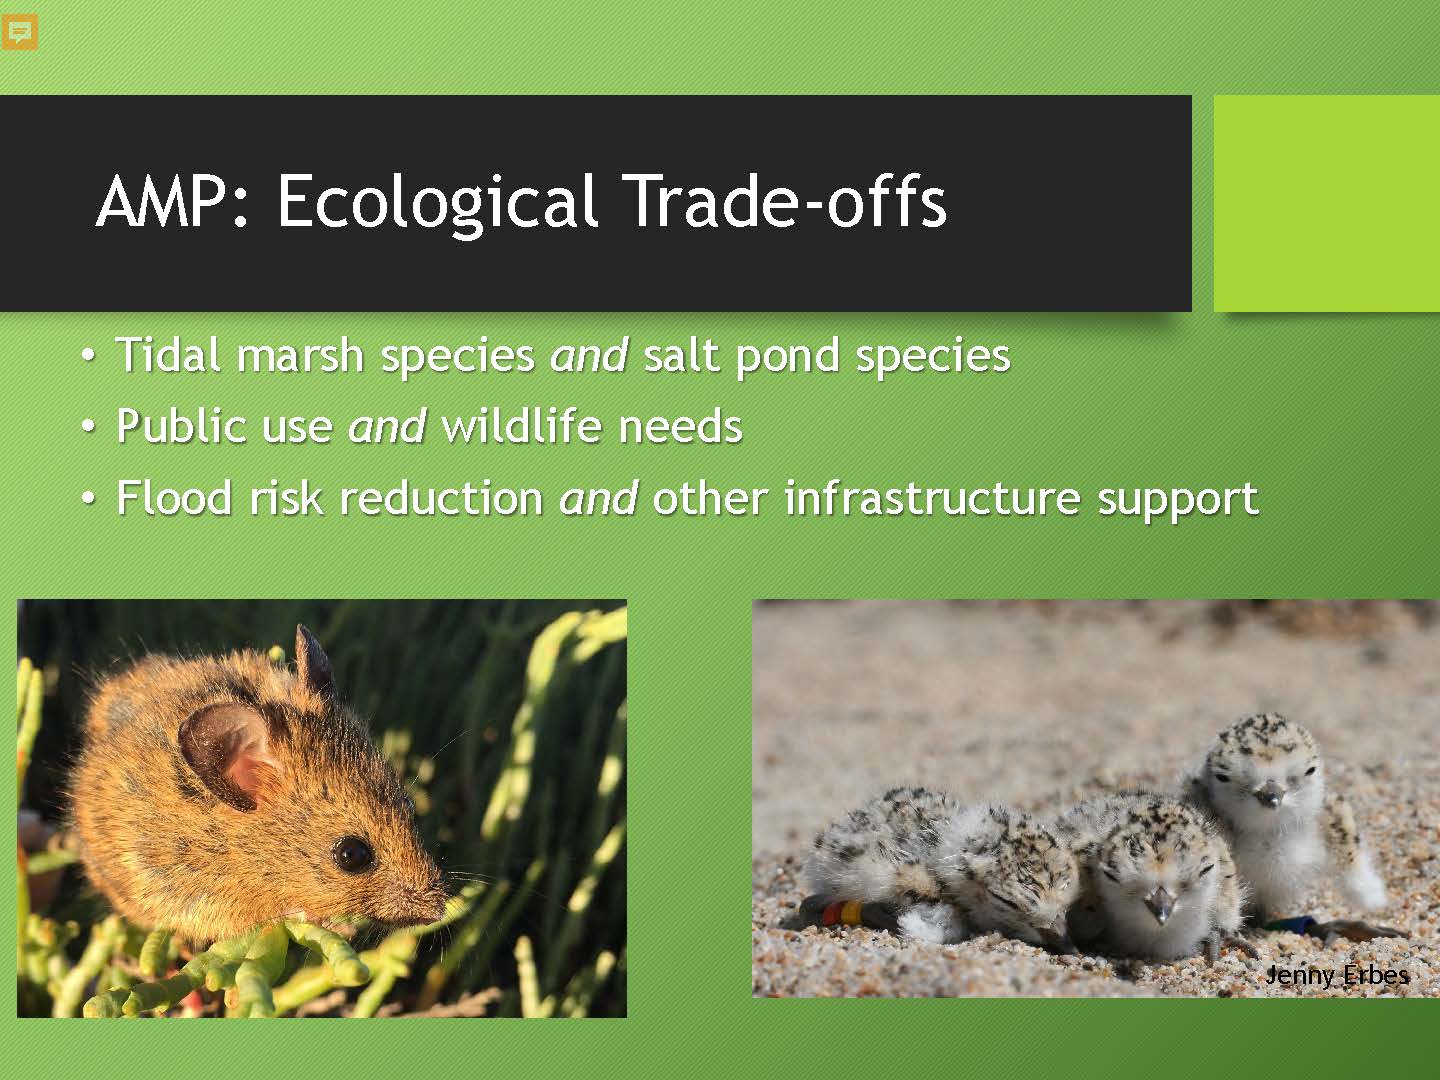 Restoration presents ecological tradeoffs between one cute animal and another: salt marsh harvest mouse and the snowy plover; tidal marsh species and salt pond species, as well as public use and wildlife needs, flood risk reduction, and other infrastructure support.
The adaptive management plan includes a thorough description of data gaps and uncertainties for the project, which include wildlife use of changing habitats, habitat evolution and sediment dynamics, mercury methylation, water quality, invasive species, sea level rise and climate change.
To undress these key uncertainties, Phase 1 included both applied studies and permit driven studies to address them.
An example of an applied study was a study that addressed the uncertainty of wildlife use of changing habitats for non-avian species. Hobbs et al in 2012 studied the response of marsh restoration on fish assemblages inside newly breached ponds and adjacent sloughs. The second example was an applied study where Fulfrost et al developed methods for mapping and tracking long-term changes to marsh habitat and mud flats.


An example of a permit driven study was the island pond restoration mitigation monitoring plan which had a requirement of more than 13 monitoring elements, such as channel network evolution, ground-based quantitative vegetative sampling, and wildlife surveys.
With the completion of phase 1, they have restored 1600 acres of tidal marsh, 1440 acres of muted tidal marsh, and reconfigured 710 acres of ponds, for a total of 3750 acres. They have also created 7 miles of new trails.
As they move up the restoration staircase with a long list of key uncertainties, they developed a stoplight approach for assessing if they are meeting their goals. Green means you’re meeting expectations, keep going and red means not meeting expectations and more data is needed.


“This expanded stoplight works really well with our adaptive management plan where green is the restoration target, orange is the management trigger, and red is our NEPA/CEQA threshold,” said Ms. Tertes. “It gave us a way to assess what is happening and where our data gaps might be, and where to spend our limited money.”
Phase 1 science products:
- South Bay Salt Pond Restoration Project: Restoration Tracking, one page scorecard https://www.southbayrestoration.org/sites/default/files/documents/stoplight_restoration_tracker_final_apr2018.pdf
- South Bay Salt Pond Restoration Project – Phase 1 (2006-2016): Tracking Progress through Adaptive Management, 7 page summary https://www.southbayrestoration.org/sites/default/files/documents/science_summary_for_the_public_final_apr2018_3.pdf
- Phase 1 studies summary of major findings of the South Bay Salt Pond Restoration Project, South San Francisco Bay, California, USGS Open File Report https://pubs.er.usgs.gov/publication/ofr20181039
With phase 1 completed, the project is starting phase 2. For most of the Phase 2, the final EIR/EIS was completed in 2016 and now construction has begun and dirt is moving. Eden Landing is a little further behind, having just completed their EIR in 2019; they are now starting the design phase. The Phase 2 restoration activities have already been decided, and by the end of phase 2, the project will be at about 50% tidal marsh and 50% ponds.
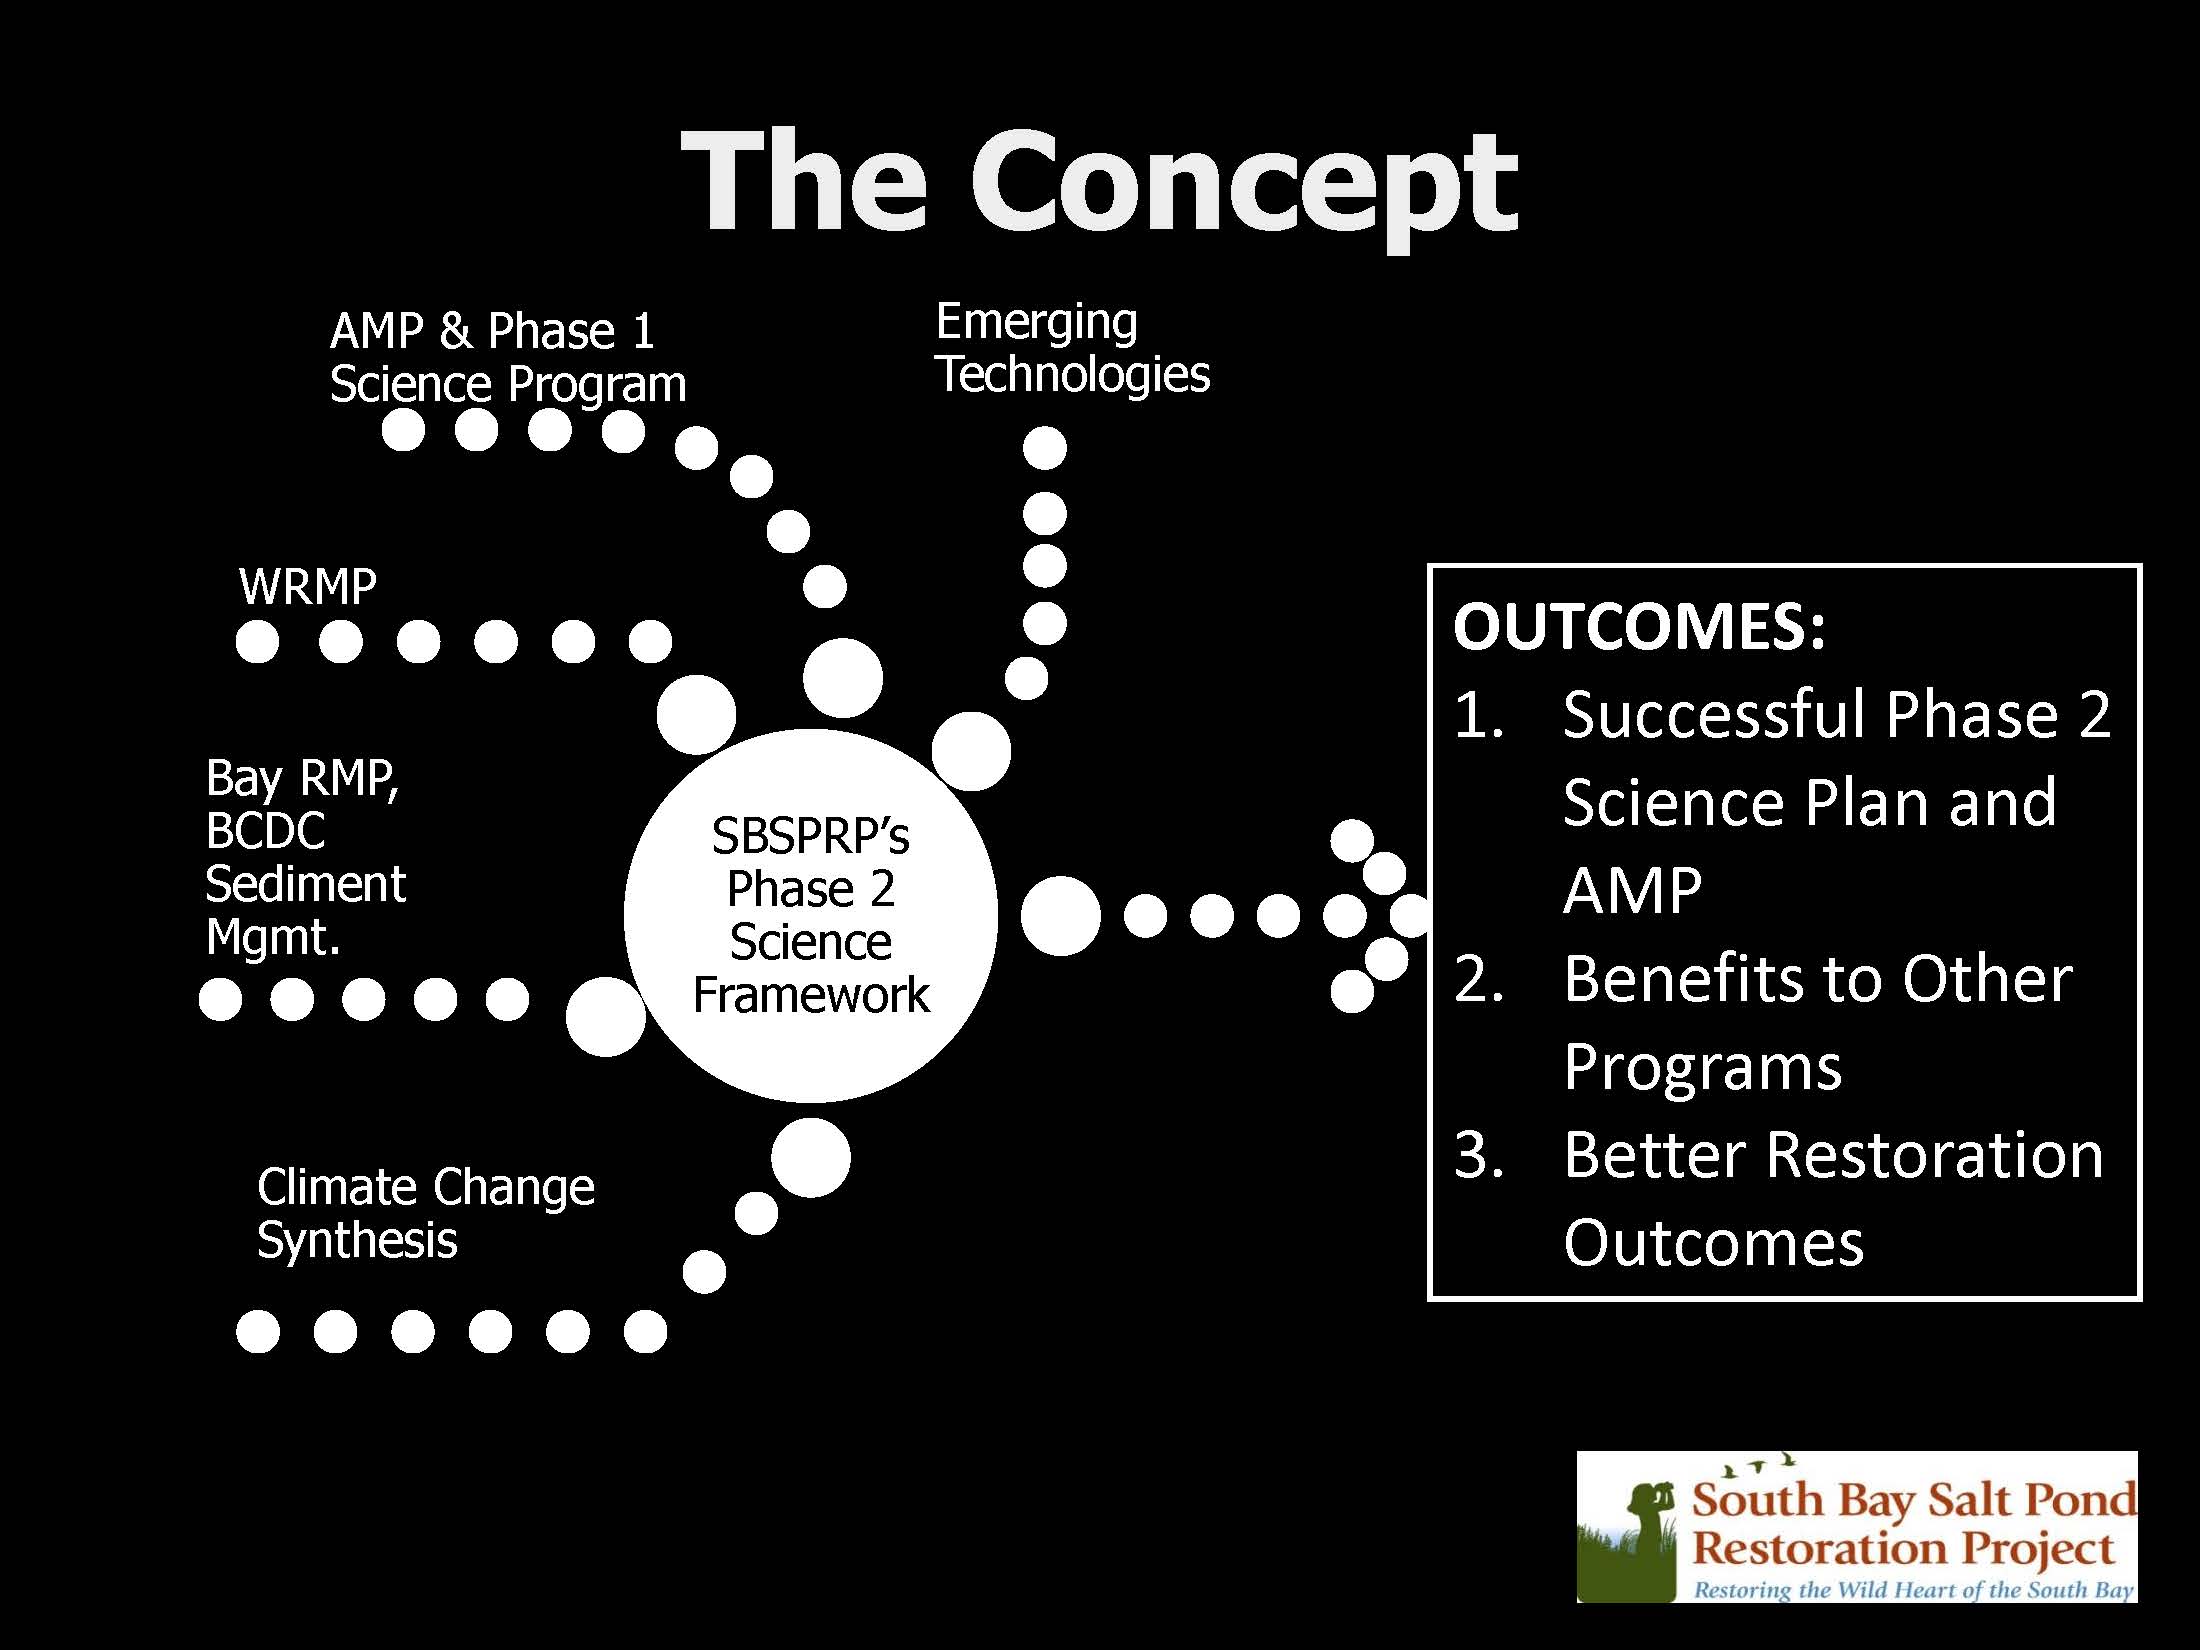
The project hired Point Blue Conservation Science to develop the Phase 2 science framework which has several parts. Step 1 is the science synthesis which covers the state of the science. Step 2 is the climate change synthesis which contemplates how climate change might prevent the project from meeting objective and what mitigation measures or adaptive management strategies for climate change could be used. Step 3 is to develop the Phase 2 science framework that will provide guidance for a set of studies and efficient data collection that will result in information that can be used to effect the adaptive management of the project as well as restoration projects in the estuary.
The project hosted a workshop in September of 2019 where the draft science synthesis was presented to participants, which included folks from not only the South Bay but also from throughout San Francisco Bay and the estuary. At the workshop, they discussed key uncertainties identified in the adaptive management plan, how better to share the science and be more collaborative, the data gaps that emerged from the completion of Phase 1; and emerging technologies that can increase efficiency.
The workshop had a ‘World Café’ setup where participants went around the room and contributed to the key uncertainties they were interested in. Ms. Tertes gave three examples:
 For marsh, mice, and rails, the project developed the site-specific protocol for secretive marsh birds, which is a standardized protocol designed to monitor progress towards the recovery objectives set forth in the US FWS Tidal Marsh Recovery Plan for project lands and beyond. For science beyond the project, a study by Nur et al identified site-specific characteristics of the transition zone to benefit marsh-dependent birds.
“We have a potential data gap,” said Ms. Tertes. “We have transition zones and it came up that we have been studying a lot on transition zones but maybe we’re focusing too much on birds so what about the other species, so small mammals or invertebrates or plants? So that is a gap that was identified.”
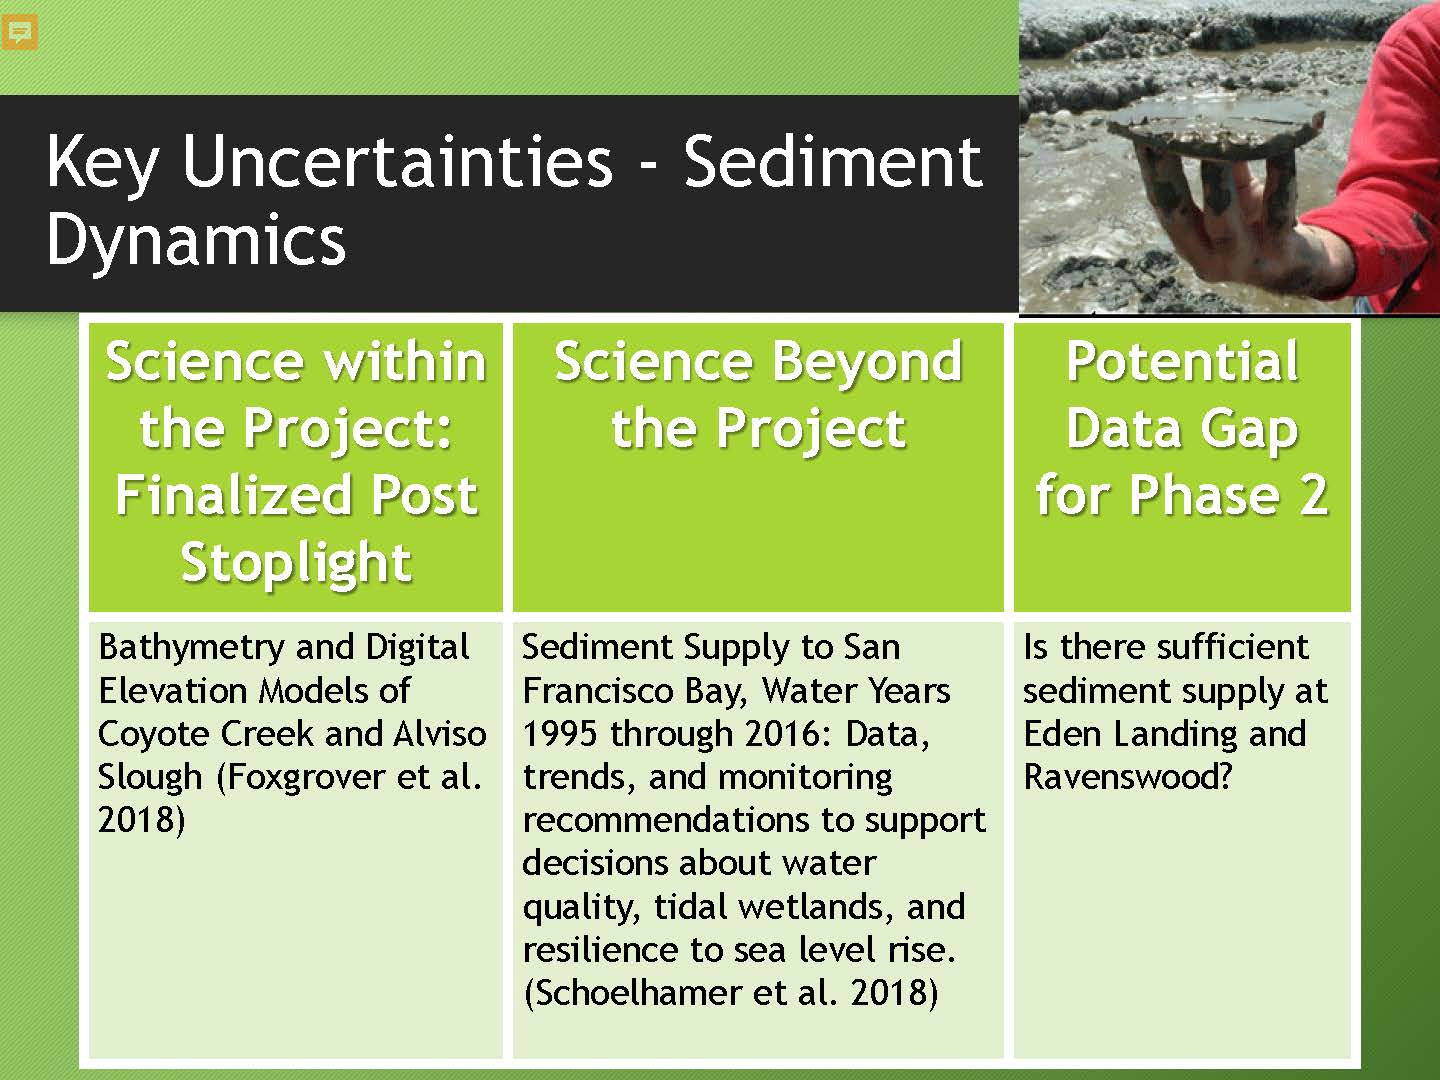 Regarding sediment dynamics, within the project, the study by Foxgrover et al used the 2010 baseline survey to monitor bathymetric changes in South San Francisco Bay as restoration progresses. Another study outside of the project was Schoelhamer et al. which looked at sediment supply from the Delta and local Bay Area watersheds a 20-year span, including flood control channels and addressing sea level rise scenarios.
“We still have this data gap,” she said. “Do we have enough sediment for Eden Landing and Ravenswood, which are the next two areas to be restored in phase 2? We know South San Francisco Bay pretty well and we’ve had good results, but sediment supply is a crucial aspect of tidal marsh restoration and adaptation, and filling the data gaps is a bay-wide priority.”
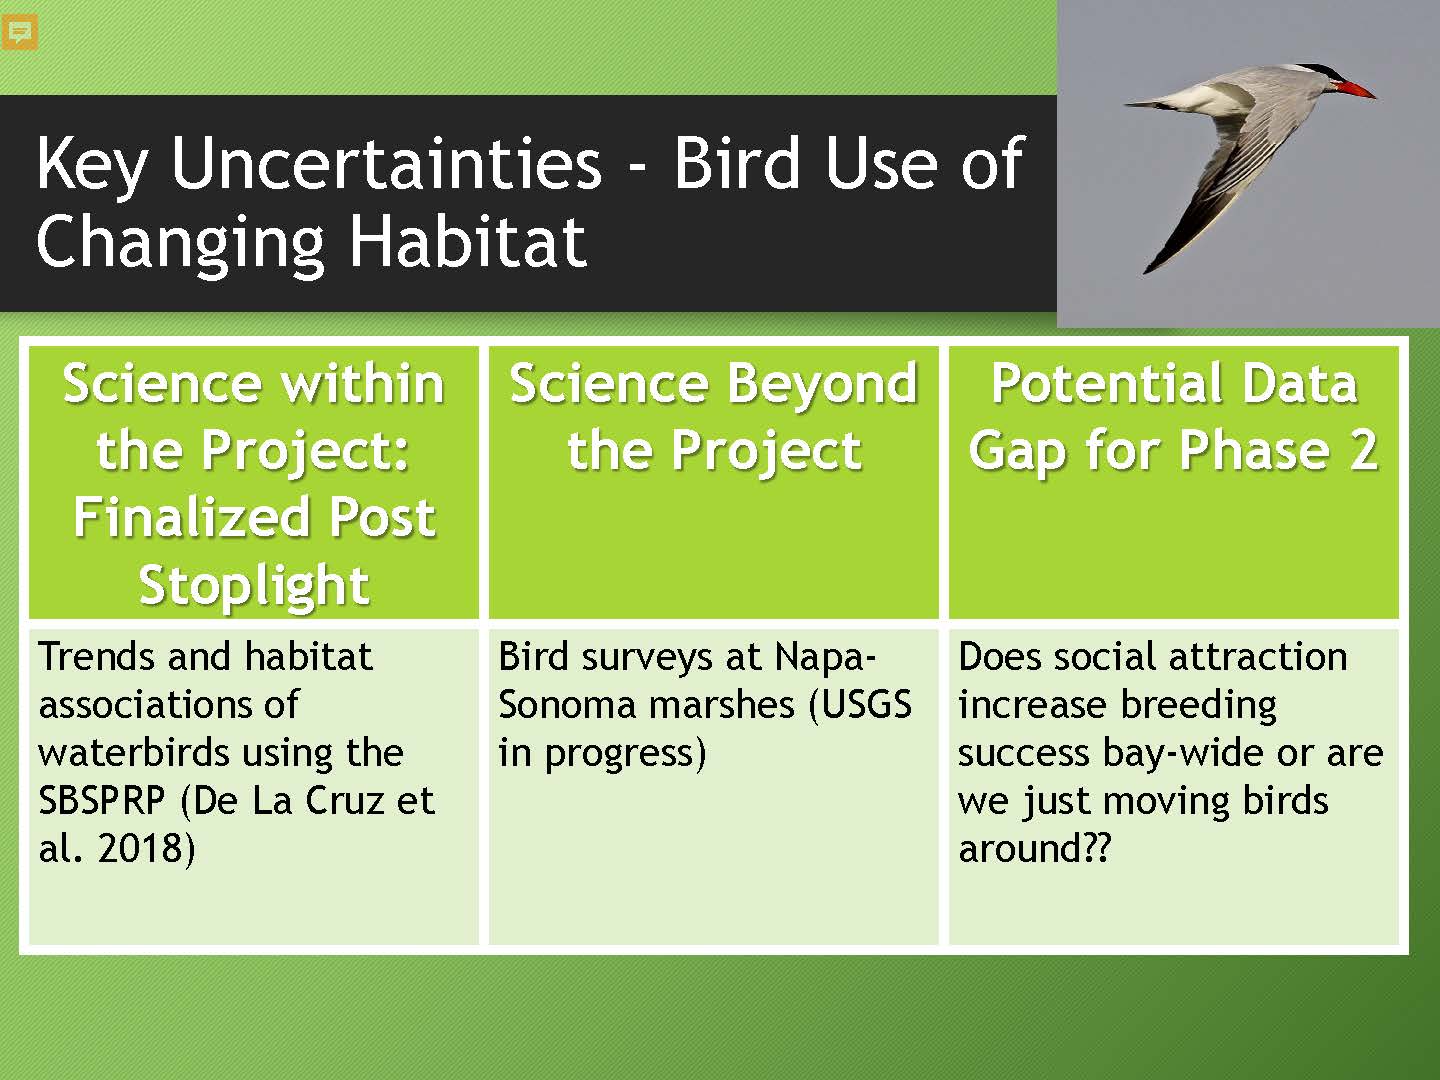 As for the birds use of changing habitat, the study by De La Cruz et al assessed the bird guild and species abundance trends through time starting at the beginning of the project which was published in 2018. Beyond the project, there’s a long-term dataset in the North Bay with the Napa-Sonoma marshes that they should be able to tap into and see how they are doing their studies and the results from the different habitats.
“The potential data gap here is does social attraction increase breeding success bay-wide, or are we just moving birds around?” said Ms. Tertes. “We’ve had success with Caspian terns and Forster’s terns using decoys and sound systems, but some of the early results are showing that we’re using more local birds, so maybe they aren’t coming from other places, we’re just moving them around, so that’s a data gap that we need to look at.”
As for next steps, the science synthesis report and the climate change synthesis report were expected be completed in December 2019. In March of 2020, they will be hosting the phase 2 science framework workshop, with the final phase 2 science framework due in April of 2020.
Integrating our Past and Future Monitoring in the South Bay Salt Pond Restoration Project
The South Bay Salt Pond Restoration Project’s Adaptive Management Plan requires monitoring and applied studies to inform decisions about current and planned restoration actions and about ongoing management practices, as part of meeting the Project goals and implementing NEPA/CEQA and permit requirements. Building on the insights from the project’s Phase 1 Science Program, they are now planning Phase 2 science.
 David Halsing has 12 years of experience in managing environmental restoration and enhancement projects in and around the SF Bay; he is now the South Bay Salt Pond Restoration Project Manager. In his presentation, he discussed how the Project has more science and monitoring needs than it can fund or conduct on its own, and how the Project can collaborate with other project and efforts across a wider area of the Bay-Delta estuary than only on Project lands.
The graphic depicts the concept of how different programs work together. “It won’t be just the successful implementation of our Phase 2 projects under the adaptive management program,” Mr. Halsing said. “It will actually benefit these other programs and hopefully bay-wide, region-wide we’ll have better restoration outcomes. When I say ‘better’ in that way, I mean that there are better chosen sites to do different things in and better methods for doing so, so that we get the kind of outcomes that we want sooner and with more certainty and less risk. If we learn more about them earlier on and can make these adaptive management adjustments on the fly before things really start to go sideways, that’s what I think is a better restoration project.”
 The slide shows the restoration staircase. At the end of implementing phase 2, the project will be near 50/50 in terms of tidal marsh versus ponds, and there will be decisions to be made. The adaptive management plan will be useful for that.
“The questions the adaptive management plan forces us to make and the process by which it makes us walk through the steps is really important,” Mr. Halsing said. “We started with the low hanging fruit, and we’re still trying to deal with lowest hanging fruit but that’s higher than the last batch of low hanging fruit, so we really are trying to get at more complicated questions that really only be answered with a more intensive regional data collection effort.”
The programmatic EIS/EIR listed 23 biological impacts; two more were added for Phase 2. Five of them are special status species, six or seven of are bird guilds that need a specific kind of habitat or that migrate through the area or that use it different ways. There are two on-point species and some migrating fish and native fish, and how do public access and recreational trail users affect sensitive species. All of these things have to be tracked, he said.
“The short conclusion that we’ve drawn from that is the monitoring needs are greater than our capacity, whether that’s time or money or staff or even physical access, either because we don’t own the land or because as restoration projects proceed, there’s more breaches and you can’t get everywhere you need to go,” he said. “So in order to get around that, we’re really going to have to do more collaboration, we’re going to have to get better at technology and get better at doing things in a more coherent unified way.”
Mr. Halsing then gave some examples.
The snowy plover and the migratory waterbirds seem to be doing pretty well at the end of Phase 1; the populations were holding the line or even increasing. The Phase 1 enhancements that were completed seemed to have worked to offset the loss of habitat area so the birds can do more in a smaller space, he said.


However, it’s the opposite answer for some of the nesting birds like avocets and terns. “We knew that was a risk as we were going to be taking away some of their habitats in converting some of these ponds to tidal marsh areas,” he said. “We tried to overcome that by building in islands and do some of these social attraction experiments and things like that to make the nesting more successful and in a smaller area. We had very mixed success with that; it worked for some, it didn’t work for others. I don’t think it worked to the degree we wanted and of course, predation by gulls and corvids particularly in these concentrated areas remains a management risk and a challenge for us.”
For all of these things, the significant thresholds in the NEPA and CEQA documents and even the management triggers built into the adaptive management plan are not bounded by the Salt Pond project area. “They say things like in the South Bay or in the whole bay or even up to the Flyway scale for some of these guilds of birds, so these are not question we can answer on our own. We have to look more broadly.”
For sediment, they have seen rapid success in the earliest implementations; the marshes have formed sooner and more broadly in the ponds that were breached and open to tidal flows than expected. “But what if that doesn’t continue, what if we’re wrong?,” he said. “Sea level rise is a risk, there are more restoration projects planned and that is going to increase sediment demand in other sites. We’re also doing things in parts of the bay that we haven’t done in tidal marsh restoration before, or at least that we haven’t done in it in before.”


This opens a lot of opportunities for synergy with a lot of existing programs, in particular, the Wetlands Regional Monitoring Program which recognizes that monitoring tidal wetlands can be burdensome and support regional objectives for wetland monitoring.
“The guiding questions [of the WRMP] are 100% relevant to us and we need those answers as much as you do,” Mr. Halsing said. “We can even help answer some of them for you and with you. In particular, this question of what are the external drivers of changes in the marsh and how can we balance marsh versus pond habitat and what are the keys to successful restoration projects? That’s absolutely what we’re trying to do.”
 The South Bay Salt Pond Restoration Project is a very large and very spatially distributed project that can be a case study or the location of one or more pilot projects to look at different kinds of things, he said. There are ponds, tidal marshes, and sloughs; there are sites that are perfect for benchmark sites, reference sites, and project sites spread all across the South Bay. They have a long record on accretion rates in their project and a long list of lessons learned on building and managing projects. Their goal is to share all of that with the larger restoration community in a more formalized way.
“These ponds are widely different sizes, they have different options for connections to creeks and channels, and they have different distances across the mudflats from deep water channels,” said Mr. Halsing. “There are a lot of opportunities for a lot of these comparative almost experiment approaches to how these different projects might work.”
“All the different programs have similar needs and opportunities,” he said. “We really want to look at beneficial use of dredge material. We included that in the Eden Landing EIR and we are hard at work looking at the feasibility and the cost of it, and the extent to which we can help fund and make that happen. We have lots of project sites at lots of initial depths and distances and everything like that.”
So how do we tie this together?
 For example, with respect to sediment and marsh restoration, the question of are all of the previous assumptions and examples of things we’ve learned about how sediment would go where it goes and how long would things take, are those going to hold? What if they don’t?
“Since the project’s inception, at the earliest stage of it, they went through and looked at certain ponds they knew would very unlikely ever to get to tidal marsh because they are too deeply subsided; those were set aside so that even in the 90/10 scenario, they are going to stay ponds,” said Mr. Halsing. “But if sea level rise is greater than expected or sediment availability decreases for one reason or another, we may have to pull some of those ponds that we thought might be workable for tidal marsh and make them into the pond category. But if some of these sediment management techniques can be more prevalent and more affordable and more efficient, then maybe we get to push them the other way. So we have to work with all of these different entities to get to answers to that question and figure out if we can keep moving up that staircase.”
 Another example is wildlife response. The project has to monitor phalaropes, a migratory bird that passes through the Bay Area for a couple of weeks every year. SFBBO does bird counts of a number of different species, one of those being phalaropes.
“The project knew that when they took over Cargill Salt Ponds and started reducing that residual salinity down to that of the ambient bay, that they were going to sort of reduce phalarope populations in the Bay Area and that happened,” he said. “What they didn’t know was going to happen was whether or not it would keep going down and it appears that it may have. Of course, because they are only here for a few weeks each year and we don’t know exactly when that occurs because it is kind of a noisy system, it’s possible we’re just missing the peak. So it’s possible they could be going somewhere else. They could be going to some other Cargill Salt Ponds and those are places we can’t easily or frequently get to.”
So what kinds of collaborations might help us get at that? Can we work with the land managers or the bird count people in other parts of the state where phalaropes tend to be before they come here and see if we can get a tipoff on when the best time to go look for them is? Can we get more people involved in regional bird count efforts so that we have a better chance with more people of seeing whether they are going to a new place or not, and that will inform this choice of are we really below that trigger line or worse yet, are we at or below the threshold of having a significant impact on that decreasing population? They are now working on planning some of those studies.
We need to build these collaborations and we need to find additional funding. “I have this idea that most of these projects and programs and efforts have to get their own funding, but what if there were added funding sources just for that little bit extra to facilitate their collaboration, to plan some experiments and studies together, to look at ways to share data or equipment or staff. Those things are not often or easily included in grants and other funding mechanisms, and I think it would be clever to look into that.”
Two great ideas came up recently. One was the idea of this sandbox where picking a pond or group of ponds or the sloughs and marshes around that, then directing teams of scientists working on different projects, directing them to that place and trying to coordinate their work and see if there are efficiencies again in staff, equipment, mobilization, and data management, such as making sure things are done at the same spatial or temporal scales that the datasets can be easily interwoven and used together. The other idea was that when remote sensing satellite imagery is being collected, other scientists are out in the field doing their work at the same time so there is a coherent data set that’s collected.
“There are opportunities for cost sharing for larger, regional studies,” Mr. Halsing said. “How are we going to do this with our Phase 2 science framework? To pull that all together, Point Blue is going to finish their work, we’re going to look at that, that’s going to give us a lot of new info on the science, and we’re going to start with what we must do. We have certain things we have to do for permits or under our adaptive management plan.”
“Then we need to think about what are the applied studies or other data analyses that we can do from existing data that are necessary to inform our decisions about the next best steps up that restoration staircase. And we have to weigh the available funding against the existing funding and try to get a lot more, then finish building these bridges with these other programs and implementing our plan.”
FOR MORE INFORMATION …
- Click here for the South Bay Salt Pond Restoration Project webpage.
- Click here for the South Bay Salt Pond Restoration Project’s Adaptive Management Plan.
- Click here for the Eden Ecological Reserve webpage.
- Click here for the Don Edwards San Francisco Bay National Wildlife Refuge webpage.

