

 In September of 2018, the Department of Water Resources released the latest economic analysis for the California Water Fix which was prepared by Dr. David Sunding, a professor of natural resource economics at UC Berkeley. At the October meeting of Metropolitan’s Special Committee on the Bay Delta, Dr. Sunding was on hand to give an overview of the report.
Dr. Sunding was engaged by the Department of Water Resources to do an economic analysis on the California Water Fix project, specifically looking at the benefits from the project in relation to the costs. Dr. Sunding performed the analysis from three perspectives: State Water Project urban contractors, State Water Project agriculture contractors, and then potentially other water users, particularly Central Valley Project South of Delta Contractors.
In order to do the analysis at that level of detail, Dr. Sunding had to make some assumptions about how costs and water supplies will be allocated between project participants. He stated that his assumptions for this analysis were that 6,000 CFS of the 9,000 CFS of capacity would be paid for by the State Water Project Contractors in proportion to their table A Contracts; Metropolitan would pay for 3,000 CFS of capacity above and beyond the 6,000 that it would then have or be able to use.
 He also assumed that if other agencies, such as Central Valley Project water users or even other State Water Project contractors, were to use Metropolitan’s capacity, they would pay a wheeling rate equal to variable cost plus an equal share of capital repayment costs. He made the assumption that Central Valley Project water users or State Water Project contractors would pay the same, so every unit that would pass through the 9,000 CFS would effectively pay the same in that period. Also, there would be no wheeling charges paid in the years where the facilities were not used.
“That is not my recommendation,” he said. “There are certainly other ways that access could be charged for, but that was an assumption that I made to complete the analysis.”
He also made an assumption that water transfers would be allowed. For example, if a State Water Project agricultural contractor did not have a willingness to pay for the project, it could relieve itself of the cost of the project, as well as transfer the water supply and the other benefits from it; Dr. Sunding assumed the those would be picked up by the State Project Urban Contractors.
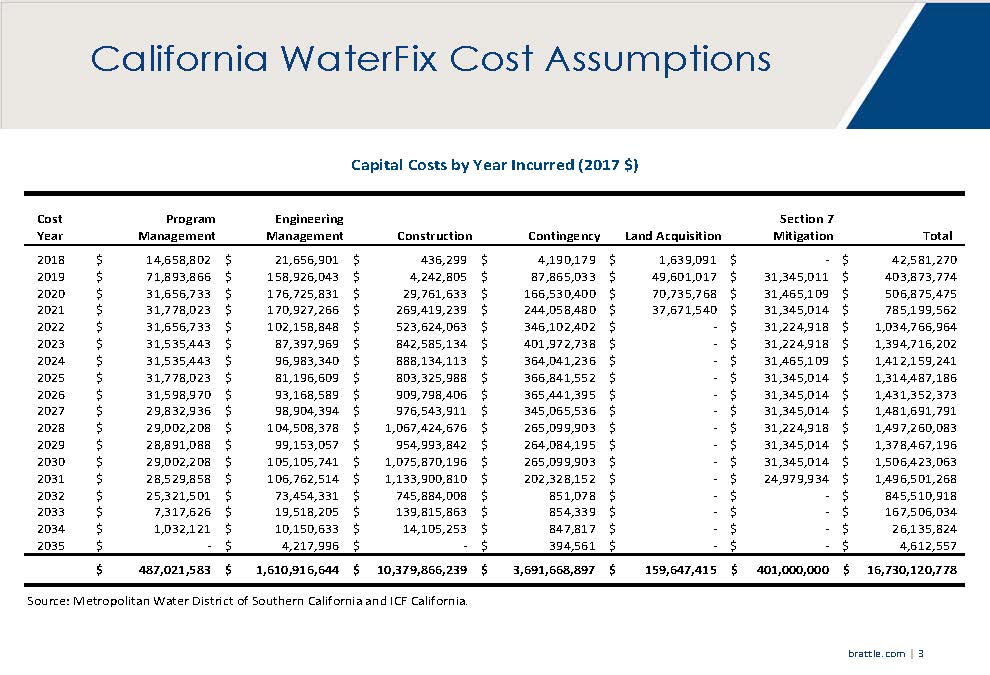 Dr. Sunding presented a slide with a spreadsheet of numbers, explaining that this is the information he was given by DWR and other folks involved with the analysis. The spreadsheet shows the construction costs, management costs, land acquisition, a contingency, and Section 7 Mitigation for a total of $16.7 billion, in 2017 dollars.
 To do the analysis, Dr. Sunding started with defining the project benefits; ultimately, what are water consumers in the Ag sector and in urban areas getting through their investment in this project?
“One aspect of what they’re getting is some water supply benefits that I had to quantify in some detail to be able to write this report,” he said. “The slide shows an exceedance curve … It shows water deliveries with and without the project so the framework of analysis is either you invest in the project and you get a certain water supply profile, or you don’t and you get another. I’m not comparing a 9,000 CFS facility to a 3,000 or 6,000 or some other variation; It’s 9,000 as compared to not doing the project.”
The blue line shows deliveries with no tunnels (the no project case); the orange line on top is if CVP users participate; and the dashed line is if it is only a State Water Project project. “You can see those two are very close, but water supplies are somewhat higher if the CVP participates,” he said.
The hydrologic modeling was developed using the Cal-Sim model; the information was given to Dr. Sunding by the Department of Water Resources. “My role in this analysis was in framing what the no project case look like,” he said. “It’s important to know that the no-project case anticipates continued declines in water supply over time and roughly speaking, the two lines up on the top that occur in these exceedance curves with the project are close to what exists at present. So, it’s accurate to think about the Water Fix as preventing future declines in water supply. It’s not the big increase over the status quo. But, if the status quo were guaranteed to persist for decades, I don’t think there would be a lot of attention paid to Water Fix. That’s kind of the point of it.”
 Dr. Sunding then presented the yield assumptions in average annual yields for the early long-term, with and without the project. The analysis was broken down into three groups of users: State Water Project urban contractors, State Water Project agricultural contractors, and CVP agencies. The table shows yields with the proposed project, yields without the tunnels, and incremental yield, which is the difference of the two. “Think of the incremental yield as being the amount of water that’s saved through investment in the Water Fix,” he said.
For State Water Project urban contractors, the proposed project yields are just under 2 million acre-feet; without the tunnels, yields are about 1.547 million acre-feet; the incremental yield (or the difference between the two) is about 444,000 acre feet. For the State Water Project agricultural contractors, the incremental yield is about 240,000 acre feet; for Central Valley Project agencies, if they decide to participate in the project, it would be just over 300,000 acre feet.
“For the State Water Project contractors, if you add up agricultural and urban yields under the proposed project, or if you add up the 1.992 million acre feet with the 719,000 acre feet, what that implies is around a 64 percent level of reliability on the State Water Project,” he said.
 With the facility remaining the same at 9,000 CFS, but considering the case that the 3,000 CFS that Met has invested in on its own can be used for its own account or by other State Water Project urban or agricultural contractors other than the Central Valley Project, the proposed project yields are somewhat higher; the incremental yield for the urban contractors is about 543,000 acre feet and for the agricultural contractors, it is just under 300,000 acre feet, he said.
“The total incremental yield is somewhat smaller than if the Central Valley Project participates but the incremental yields to the State Project Contractors are higher, which, I think makes sense,” said Dr. Sunding.
So with the cost information and with the hydrology analysis thus explained, Dr. Sunding then turned to the economic modeling.
He considered four categories of benefits to agricultural and urban contractors:
- Water supply;
- Water quality (adding a northerly point of diversion reduces salinity and provides benefits to both urban and agricultural contractors);
- Reduction of seismic risk;
- Mitigation of sea level rise
Dr. Sunding noted that at the recent California climate summit, new research was rolled out. “The assumptions that I made about sea level rise, the magnitude and the timing are almost certainly on the very conservative end, certainly conservative with respect to the research that DWR just rolled out at the Governor’s recent climate summit. So I think the climate mitigation benefits could be much higher than what I portray here.”
Mitigating the effects of sea level rise has been included in his previous economic analyses of the project, but only in qualitative terms; this is the first time that these benefits have been monetized, he said. The benefit analysis for sea level rise relies on hydrologic modeling done by DWR where they were able to parse out the overall effects of climate change on water supplies, such as in terms of changes of precipitation patterns as opposed to sea level rise. Dr. Sunding said he used the marginal effect of sea level rise to calculate the benefits for this analysis.
 Adding up benefits and costs under the cost allocation assumptions, the hydrologic assumptions, and then the economic modeling for the four benefit categories, Dr. Sunding put together a base case scenario. He noted that there are a number of assumptions embedded in it: He assumed that there is some transfer of water supply benefits, all the financing for the project is done at market rates, and that the CVP ultimately decides to participate.
“Under those assumptions, the benefit cost ratio is around 1.3 to 1, which means for every dollar invested in the project, there’s a return of 1.3,” he said. “The numbers are much higher for the State Project Urban Contractors and that’s because the investment is higher and the corresponding benefits are higher. But the project, in my view, definitely passes the benefit cost test for each of these three major groups in the base case.”
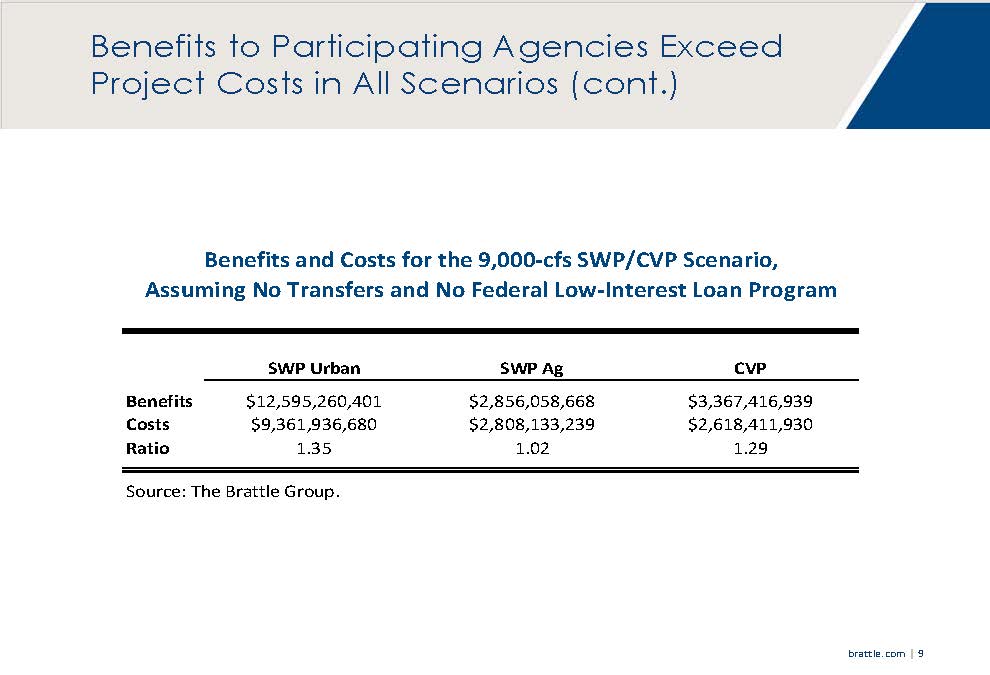 Dr. Sunding then considered what the analysis would be if transfers of project benefits and costs are not allowed. “The economics of the project are improved by allowing transfers from agencies that don’t have a high willingness to pay for water supply reliability to those that do,” he said. “Remember, the transfers are voluntary; no one is forcing these to happen. It should be the case that benefits go up. Costs remain the same, they’re just transferred from one group to another. But if you’re transferring from an agency that has a low willingness to pay for a liability to one that has a high willingness to pay for a liability, benefits should go up, and that’s exactly what happens.”
He pointed out that for the State Water Project agricultural contractors, the project barely pencils out if transfers are not allowed. “The reason is that certain entities like the Tulare Lake water users, for example, don’t have much of a need for this project; they’ve been pretty clear about it. It’s reflected in our economic modeling. If they can shed their costs and shed the water supply benefits by reallocating it to another agency, that’s a win for both parties and that’s what’s reflected in the modeling.”
Dr. Sunding then presented the results if transfers are allowed, but there are no Central Valley Project users. “Suppose you’re not able to close a deal with them and they end up not participating, what would the economics of the project look like for the state project contractors, both urban and ag?,” he said. “It turns out in this case that the project still passes a benefit cost test although it is not quite as favorable as it was before. For the urban users the economics deteriorate a little bit. For the ag users, they deteriorate more but it’s still positive.”
“This is an important result, because from what I understand, it’s uncertain if Central Valley Project contractors will participate,” he said. “It’s interesting to know that even if Central Valley Project participation doesn’t materialize, the benefits of the project to the State Water Project users are still an excess of costs.”
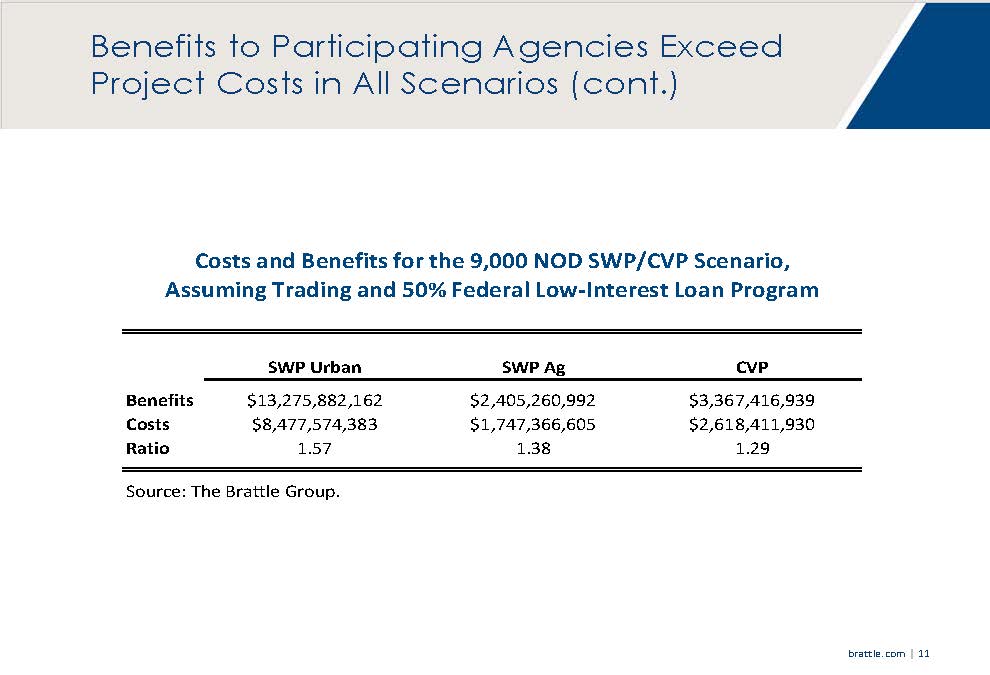 The last analysis assumed that 50% of the project’s construction costs are financed with a low interest federal loan. “In this case, the economics of the project definitely improve because the present value of costs is lower with the lower borrowing cost,” he said. “For state project urban contractors, the benefit cost ratio now goes almost to 1.6 to 1; for agricultural contractors it goes to roughly 1.4; and for the CVP users I made the assumption that their costs would remain the same, so they stayed at 1.29.”
CONCLUSIONS
Dr. Sunding then gave his conclusions:
“In terms of conclusions, the modeling in this report is based on a consideration of four different categories of benefits: water supply benefits, water quality benefits, seismic risk reductions, and then the newly monetized benefit category of mitigating the effects of sea level rise. In my view, benefits exceed costs in all scenarios considered, but in particular in the base case, which I intended to be the most likely case. Certainly things might turn out differently than that, but in the base case, in my view, benefits definitely exceed costs.”
“It’s also important to note that transfers of Water Fix water supplies increases overall benefits. I think that’s an especially important feature of the current structure for the State Water Project agricultural contractors. Importantly also, the California Water Fix passes a benefit cost test even without Central Valley Project participation which is certainly unclear at the moment.”
“Finally, I think we are the point now where it’s reasonable to include quantification of these types of effects mitigating the impacts of sea level rise, which can have a very large effect on Delta exports, and is a significant component of the benefits. When I started off in this kind of work 20 years ago, that was always something that was way, way far off in the future, very uncertain, going to happen a century from now. That is not the current thinking. Things like sea level rise are impacting even current decision making in California, which I think is sensible.”
“I’ll leave it there and I’m happy to answer any questions.”
DISCUSSION PERIOD
Director Fern Steiner noted that in order for State Water Project water to be maximized, more storage is needed. Sites Reservoir is one of the places we’re looking at. In your analysis, is there any component of storage cost in your calculations?
“The water supply benefits that I used here as part of this analysis are entirely based on existing infrastructure, but you raise a very interesting point,” said Dr. Sunding. “I’ll go back to the exceedance curves. If you look at what happens with the Water Fix, what it’s doing essentially is preserving a lot of water in average to wet years, and that means that storage is a complimentary investment to the Water Fix. Whether it’s groundwater storage, Sites Reservoir, or other potential projects, storage works very well and would help to maximize the benefits from Water Fix. This analysis is based on current infrastructure. I have done other analyses that are not part of this report that look at combinations of investments together.”
“As you suggest, Water Fix makes the economics of something like Sites Reservoir or groundwater storage more attractive and vise versa,” he said. “So the storage and Water Fix very much work together.”
Director Steiner asked if he considered any component of costs related to groundwater, in the Metropolitan area or up in the Central Valley area?
“I did,” said Dr. Sunding. “I have certainly groundwater costs in Southern California. I should point out that for the agricultural analysis for both Central Valley Project users and for the State Water Project agricultural contractors, I assumed implementation of SGMA (Sustainable Groundwater Management Act). We’re not to that point yet in reality, but I made a number of assumptions about sustainable yield in different groundwater basins around the state. And one thing I will tell, having delved into the numbers at a pretty great level of detail, I don’t believe the project would pass a benefit cost test in a non-SGMA environment. Implementation of groundwater pumping restrictions in dry years has a very large impact on the willingness to pay for surface water, which makes sense. They are substitute commodities and if farmers are not able to extract huge quantities of groundwater in dry years anymore, it puts a premium on surface supplies. So I can tell you qualitatively, and I write about this in the report, SGMA has a very important role to play in determining the benefits here.”
Director Larry McKenney notes that the report has been out now for a while. What are one or two criticisms you’ve heard?
“I’m probably not the best person to summarize that, but I’ll give you as fair a representation as I can,” said Dr. Sunding. “This has come up before about the way that I constructed the no project case; sometimes we refer to this as the declining baseline. I did not use the status quo as being the no tunnel alternative for the simple reason that there has been a continued deterioration in Delta exports that’s gone on for the last 20 years or so and there are potential future regulations that could be imposed on South of Delta operations … this declining baseline, and the fact that it deviates from the need but no action alternative, that has definitely gotten the attention of some opponents of this project.”
“Now, I don’t think that’s unusual,” he continued. “I can think of other examples where something like that is done, and I can say that NEPA has very strict guidelines about the construction of the no action alternative. In economic analysis, when you’re evaluating an investment, what you try to do is say, “What is the most likely future scenario with and without the project in place?” And that’s in all honesty what I tried to do here was forecast out what the world would most likely look like without this investment in place, and that defines the declining baseline.”
Director Steiner notes that there is presently the potential that those strict guidelines can change, considering the recent Trump memo as well as the memo from Secretary Zinke. There is also the State Board and its efficiency standards and the big battle going on between what rights does the federal have versus the state … this battle between which will win, the state law or the federal law. Where does that fit in to your scenario here?
“I have one no project scenario; it’s possible to define others,” said Dr. Sunding. “We might end up with another President in a few years, and then we might have another set of environmental restrictions entirely. The thing I can say is that the assumptions that go into the no tunnel scenario that I’m using in the report, those are pretty exactly defined; I lay out that detail in the report. It’s a future scenario, so the world might evolve in ways that are different than what I’m assuming here. It might be better in the sense that there might be fewer future environmental restrictions, it might be worse. But the way I’ve always described Water Fix from an economic point of view is it’s like an insurance policy. If restrictions do get tougher, yields are almost certainly better off with the project than without.”
“If you want to bet that there’s not going to be more future environmental restrictions, or if current environmental restrictions might get rolled back, that’s possible and there’s certainly some people who have that view, but that’s not what’s embedded in here. But from an analytic point of view, one could do other scenarios and see how rates change.”
General Manager Jeff Kightlinger points out that Dr. Sunding looked at seismic benefits as well as sea level rise, and those are not a matter of regulatory restrictions; those are two issues that Water Fix addresses regardless of what the regulatory climate is. Dr. Sunding agrees.
Director Fern Steiner notes there were two different wheeling rates, one with Central Valley Project participation and one without their participation, but in all of the analyses presented, he assumed someone would use that tunnel. What if there isn’t anyone who wants to wheel water through the tunnel, how does that affect the analysis?
“In the case where the Central Valley Project users do decide to participate, if you look at State Water Project urban and agricultural incremental yields, it’s about 440,000 acre-feet and 240,000 acre-feet,” said Dr. Sunding. “If the Central Valley Project doesn’t participate, incremental yields go up by about 100,000 acre-feet. Now some of that is Metropolitan and some of that is non-Metropolitan. So the non-Metropolitan State Water Project urban contractors would, in my model, be paying a wheeling rate. The agricultural contractors go from an incremental yield of 240,000 to 290,000. How do they get that extra 50,000 feet of supply? They get it by gaining access to Metropolitan’s 3,000 CFS capacity. So the assumption I made is that the State Water Project agricultural contractors would pay Metropolitan when they use the 3000 CFS project capacity that Metropolitan controls.
“But you’re assuming that they will take water,” counters Director Steiner.
“Yes. The goal would be to maximize state water project deliveries,” said Dr. Sunding. “That would necessitate using part of Metropolitan’s 3,000 CSF of capacity.”
Director Tim Smith asks about the wheeling rate. So you’re assuming that with th water fix project, we’re increasing the supply from the delta. That’s the 440,000 acre fee, plus the other ones, correct?
Dr. Sunding clarifies that it’s the result of a modeling exercise, so it’s not completely an assumption; it’s a result from Cal-SIM modeling.
Director Smith notes the wheeling rate of $686 an acre-foot to recover the capital plus maintenance costs over the 100 year period. So that includes all capital, fixed and operating costs?
“Yes,” said Dr. Sunding. “If someone passes a unit of water through metropolitan’s capacity, whether that’s Central Valley Project user or another State Water Project contractor, they would pay 100% of the variable cost allocated to that unit of water, plus a share of capital repayment cost that’s determined by the total volume of water that goes through the year. So it’s really an average cost. And again, that was an assumption that I made to close the model.”
Jeff Kightlinger points out that this is just a theoretical assumption as Metropolitan, at some point, will be adopting a rate to do that, and that would be something that would be set by the discretion of this board.
Director Smith notes that obviously it would have to consider more than just the rate to move the water. Wouldn’t there also be some sort of fixed connection charges into the Water Fix by those agencies?
“We would take a look at a number of factors and go through the normal rate-setting process,” said Jeff Kightlinger. “Then we would go do cost of service analysis and work all that through them, then eventually the board would adopt that for use of our capacity.”
Director Smith directs to slide 10. It appears as though you’ve done a sensitivity analysis if just the State Water Project contractors are using the water; however, his understanding would be that that number would only be 6,000, not 9,000. Director Steiner was saying, ‘let’s say no one else takes any water but State Water Project, there’s that other 3,000 that’s not going to be used.’ So you’d actually have different cost-benefit ratios if you used 6,000. Is that correct?
“I think that’s not correct,” says Dr. Sunding. “Remember, the project is 9,000 CFS. In my original base case formulation, the State Water Project contractors have 6,000 to use, and 3,000 is made available to the Central Valley Project contractors. In this sensitivity analysis, the entire 9,000 can be used by the State Water Project contractors, which is why their incremental yields go up a bit, relative to the case where the Central Valley Project participates.”
“But we don’t have that demand,” says Director Smith.
“I’m sorry, we do have the demand,” says Jeff Kightlinger. “The question would be is if people would decline to take water that’s available to them, and we don’t intend to decline water that becomes available to us. We intend to put it into our storage. So does Kern, and so do other state water project contractors that have storage available to them.”
Director Smith asks, from year to year, depending on what years are dry years, we’d be able to use all 9,000?
“Yes,” says Jeff Kightlinger.
Director Steiner asks if the benefits are parsed out by category, such as sea level rise?
Dr. Sunding acknowledges he should have put that in the presentation, but says he will provide a table that lays out the individual benefit categories. “One thing I will say is that the sea level rise mitigation benefits … I used 110 centimeters of sea level rise by 2100. State Water Project south of Delta deliveries go down by not quite half, but a lot, so it has a significant impact of benefits. That’s in the future. So, those savings get discounted back to present value.”
“As I recall, I’ll send you the exact numbers, the benefits from the sea level rise component for the State Water Project urban agencies were in the order of $4-5 billion in today’s terms,” said Dr. Sunding. “Even though these are very long term impacts, it now is close enough that considerations like sea level rise start to have a material impact on decision making, with respect to capital investments.”
Director Glen Dake notes that Dr. Sunding wrote that losses due to shortages and correspondingly the benefits due to avoided shortages are measured by computing the consumer willingness to pay to avoid the water service interruptions in each sector. How would changes in willingness to pay to avoid water shortages affect the 1.3 number that you showed?
“Absolutely,” said Dr. Sunding. “When I measured benefits to State Water Project urban contractors, for example, I’m not measuring the benefits to the water utility, because they’re a pass through -they’re a non-profit. So what I’m measuring is benefits to all of your customers. How does this project benefit their lives, the way they live? They have to pay something for it and that gets reflected in rates. But then they receive benefits, primarily in the form of less severe and less frequent water shortages or periods of short-term rationing. That is a very large component of the 1.3 benefit-cost ratio for the State Water Project urban agencies. The fact that you have, with the Water Fix in place, even given the current storage infrastructure, less frequent and less severe water shortages.”
Jeff Kightlinger adds that he thinks it’s always been assumed that these benefits were primarily urban and that it was not a big ag issue, because they can pass a year or two dry years. “But with a strong push into permanent crops in the Central Valley, that’s changed. In 2014 and 2015, almond farmers and pistachio farmers willing to pay $2,000 per acre foot; Metropolitan just stayed out of the market, instead relying on storage and other assets. That was an example of how things have changed on the willingness to pay for those, and the change in the demand in the two sectors.”
“As Jeff points out, not only are average values in agriculture high, but there’s been considerable demand hardening that’s also taken into account in my modeling,” said Dr. Sunding.
Director Jerry Butkiewicz asked if the recent legislation increasing water use efficiency would impact the urban demand assumption in the report and if so, how would that change the benefit-cost ratio?
“The urban water demand assumptions that are embedded in my analysis are the same as in the last version of the IRP,” said Dr. Sunding. “So if there have been changes incremental to that, that might have some effect.”
“Thank you, Dr. Sunding,” said Chairperson Peterson. “Appreciate you coming to talk to us, we’ve had a good discussion. We’ll move to the next agenda item … “
FOR MORE INFORMATION …
- Click here to read the full report from Dr. Sunding.
- For the opposite point of view:
- Quick Reaction to the Latest WaterFix Economic Analysis, from Dr. Jeff Michael at the Valley Economy Blog
- New WaterFix Economic Analysis is Even Worse Than I Originally Thought, from Dr. Jeff Michael at the Valley Economy Blog
 Sign up for daily email service and you’ll never miss a post!
Sign up for daily emails and get all the Notebook’s aggregated and original water news content delivered to your email box by 9AM. Breaking news alerts, too. Sign me up!
