

Chinook salmon have long thrived in California’s variable climate, including prolonged drought periods, by utilizing the historical Delta’s vast habitat mosaic and their adaptable life history. However, changes to the estuary from reclamation and development as well as climate change threaten the long-term survival of Central Valley chinook salmon.
While surveys and geochemical tools have provided crucial insights for salmon populations in California, these data were collected after significant population declines and the construction of dams that blocked access to a significant portion of their historic habitat. As a result, these data and tools may miss key aspects of potential salmon life history.
 At the 2021 Bay-Delta Science Conference, Dr. Malte Willmes, a postdoc at UC Santa Cruz and NOAA Southwest Fisheries Science Center, presented the findings of a study where researchers applied a suite of morphological and geochemical tools to chinook salmon otoliths collected from an archaeological site predating the Delta’s development. The study showcases the potential for archaeological fish remains to provide unique insights into past salmon populations to guide future conservation, management, and recovery.
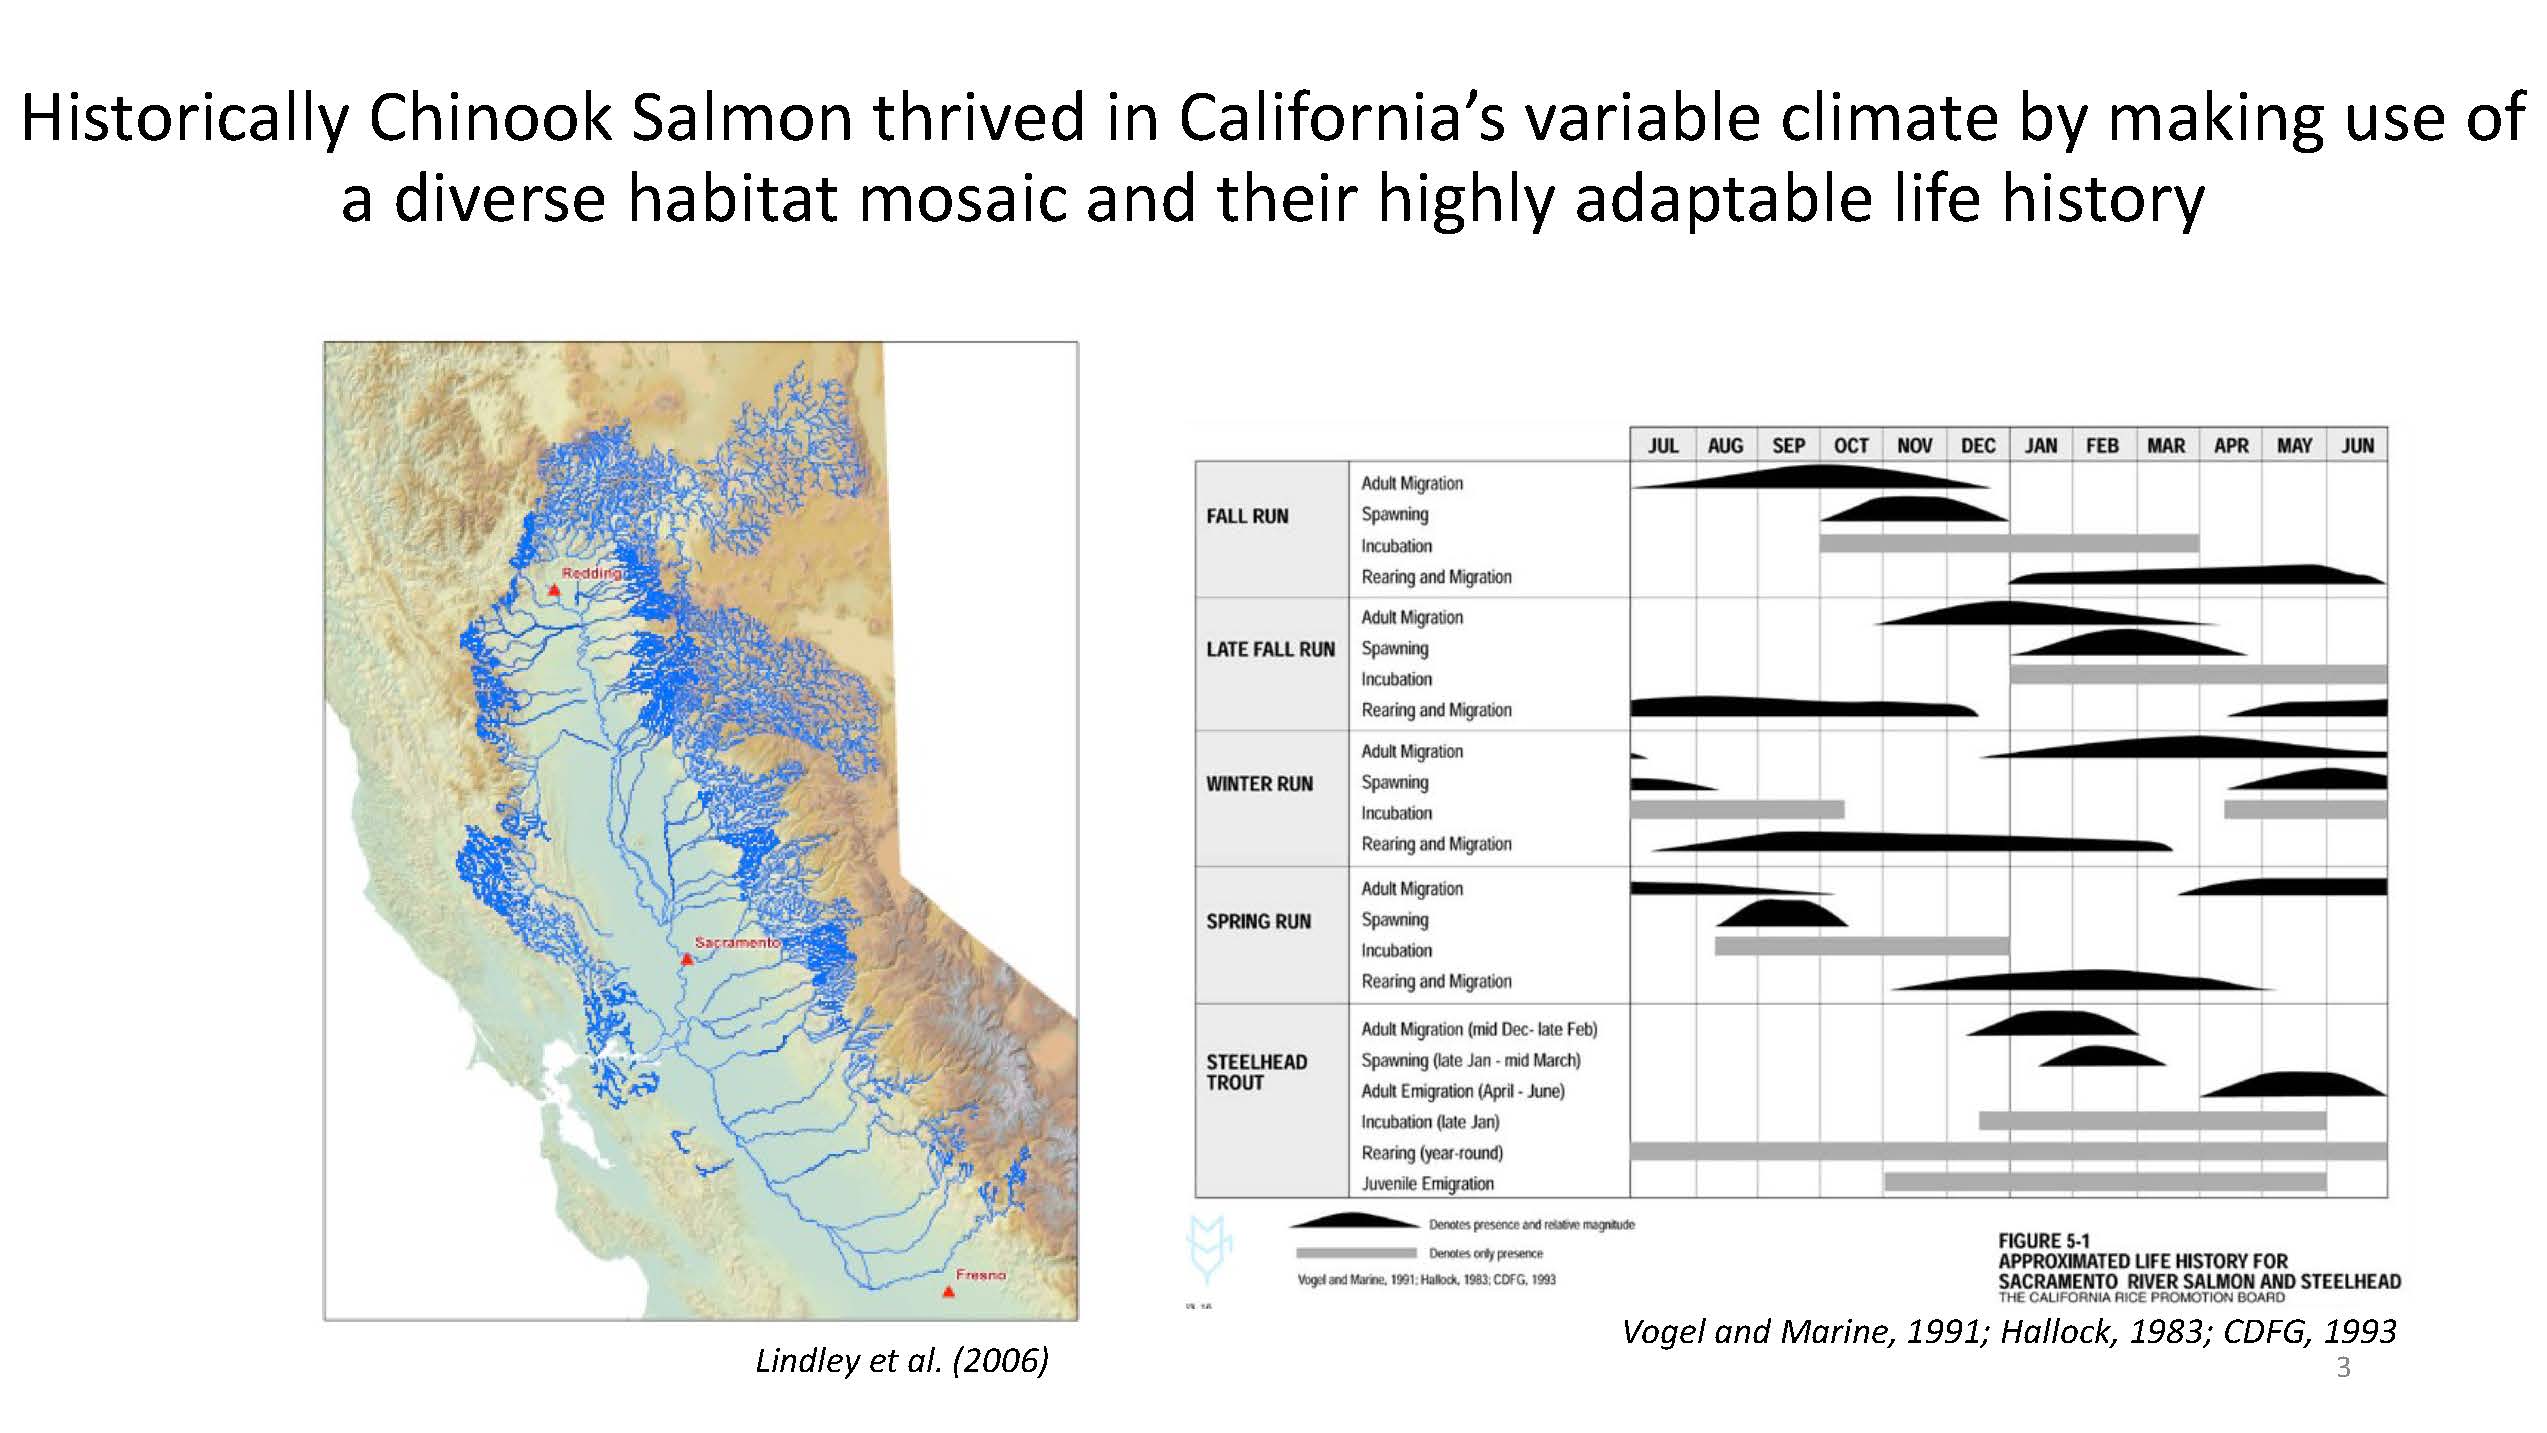
Despite the state’s conservation and management efforts, many salmonids in California are struggling and are facing an uncertain future. Historically, Central Valley chinook thrived in the variable climate using a diverse habitat mosaic and a highly adaptable life history. However, habitat loss and simplification, water diversions, and climate change threaten their long-term survival.
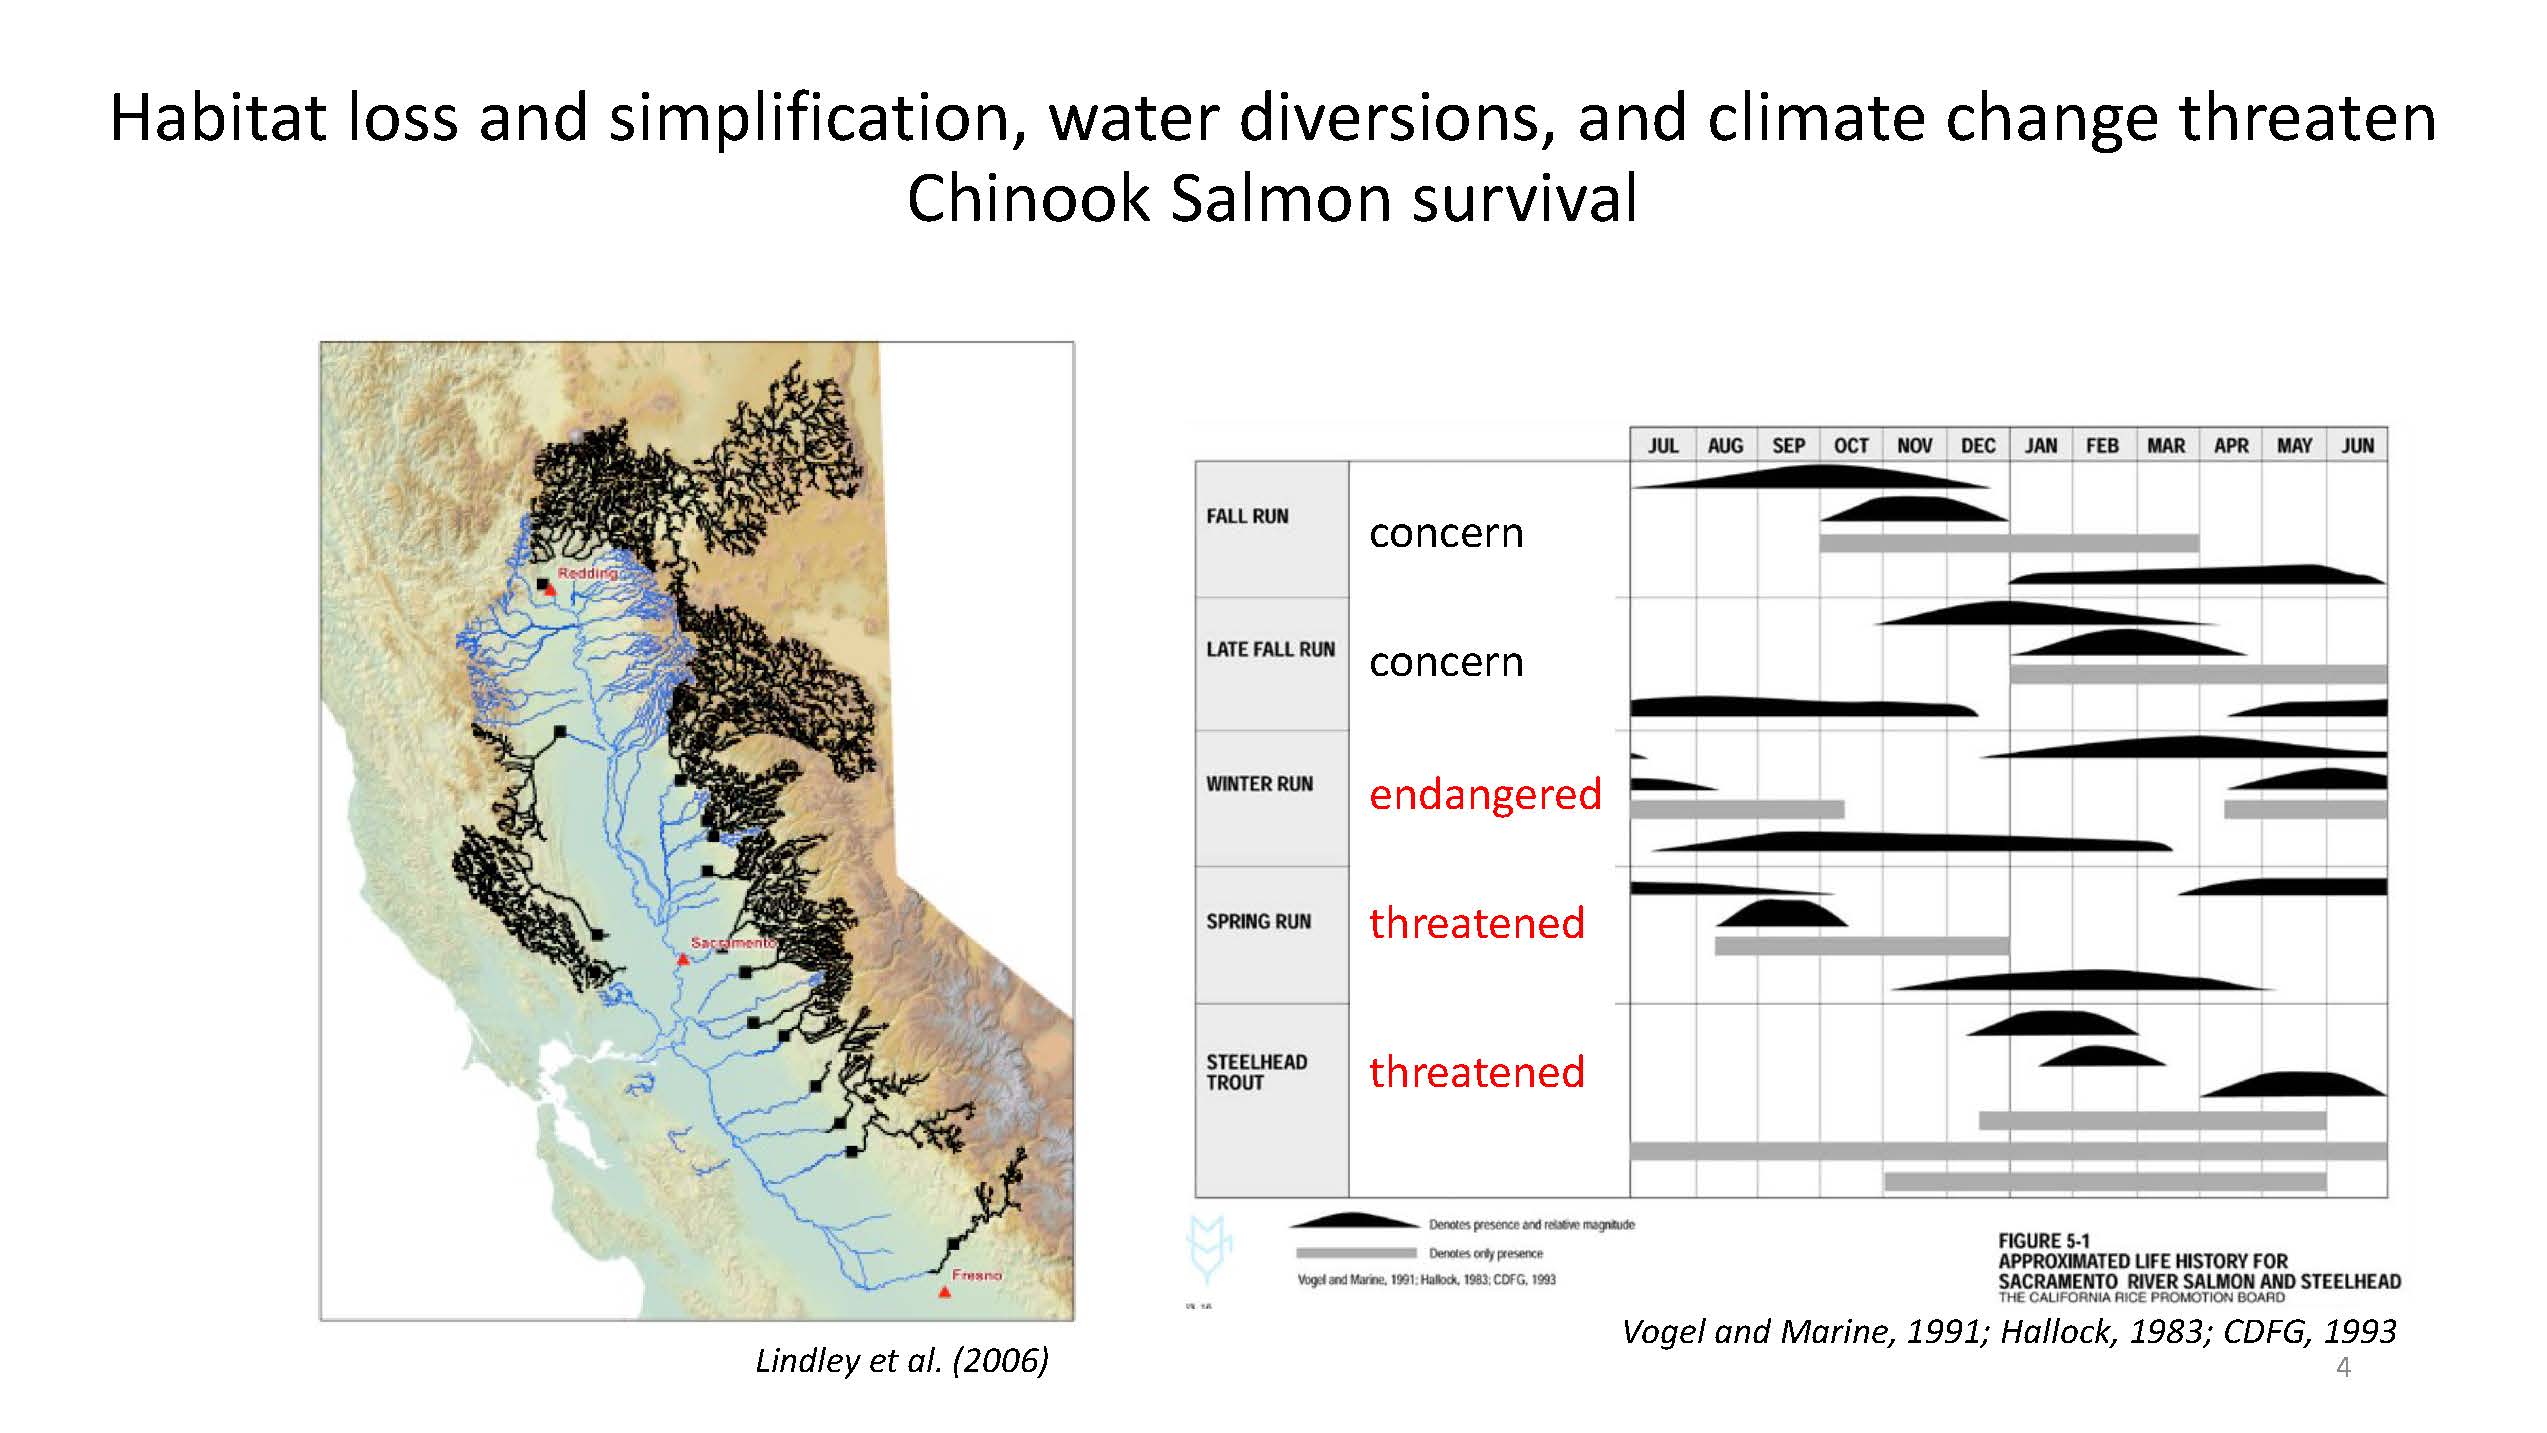 The slide shows all of the habitats that are not accessible to salmon due to the construction of dams. However, many other potential rearing habitats in the Delta and Bay have been lost, as shown on the slide on the upper right; the Delta of the early 1800s had lots of available habitat in green, while the modern Delta has very little.
“We’ve disrupted the ability of Chinook to respond to environmental changes by drastically simplifying and reducing their available habitat,” said Dr. Willmes.
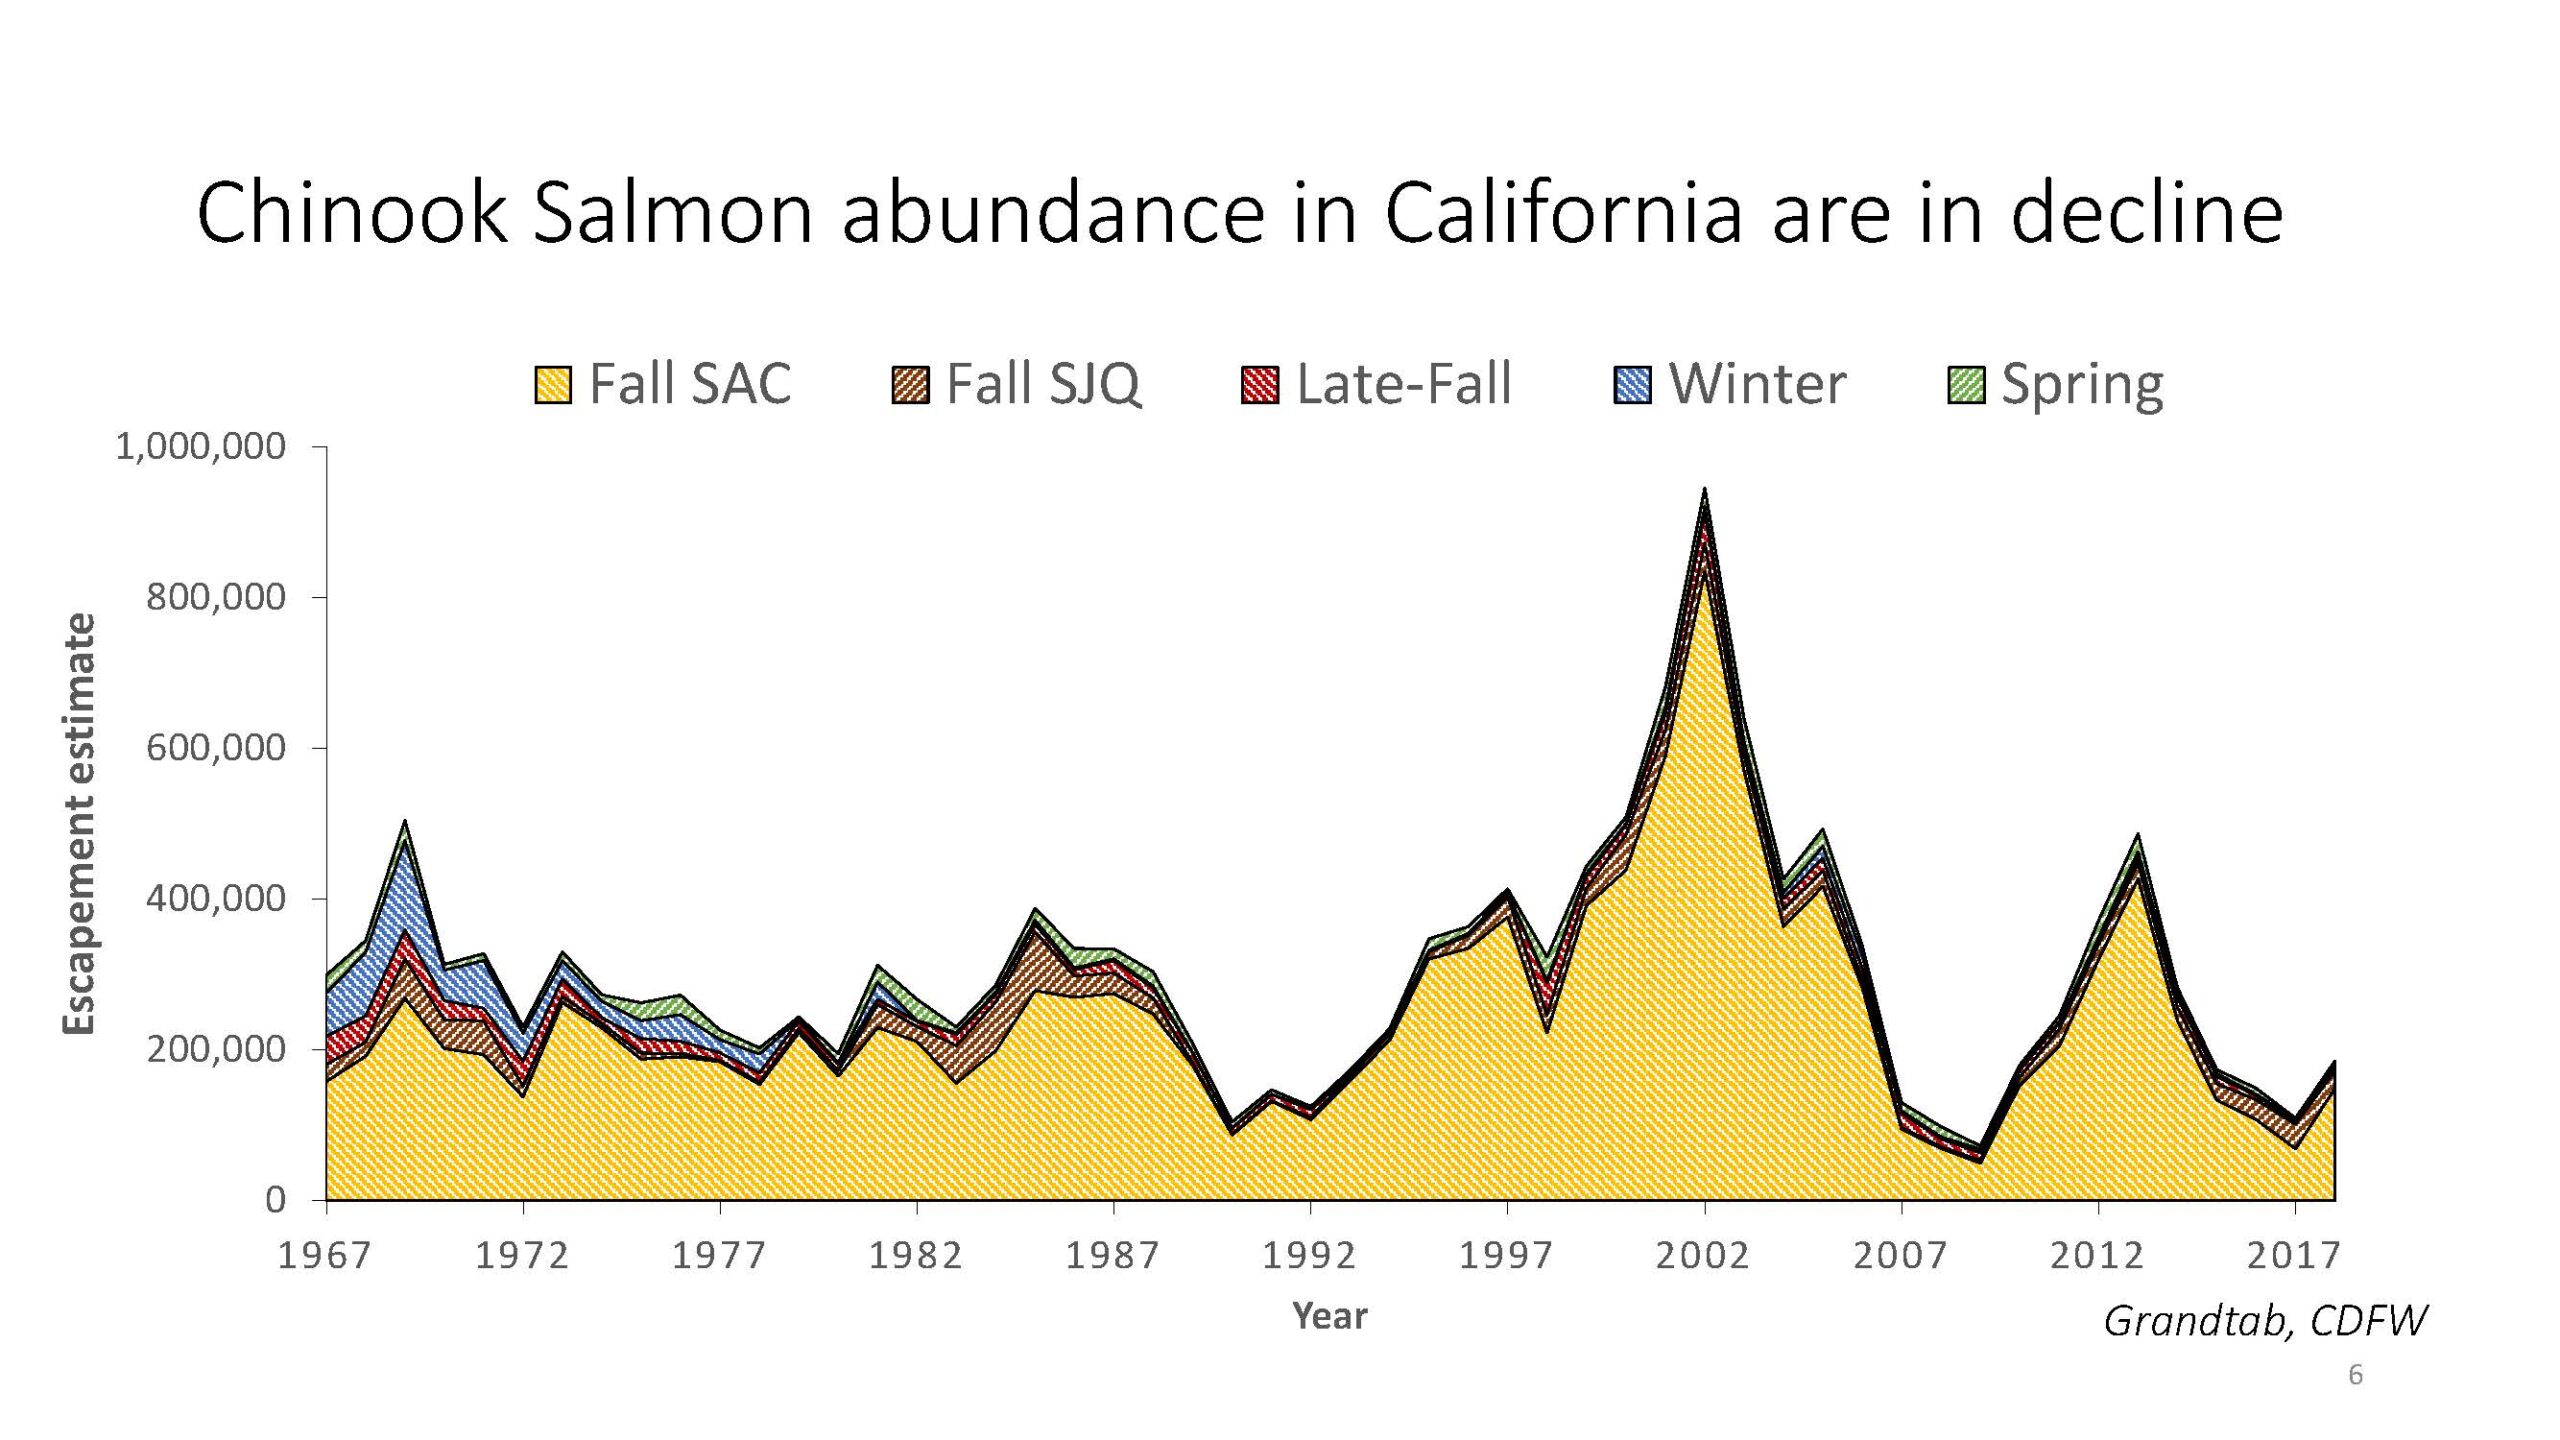 This graph shows the abundance of the Central Valley chinook returning to streams over the last 50 years, illustrating the long-term decline.
“When looking at the proportions that each run contributes to the population, we can see that some runs’ populations are drastically declining,” he said. “Both winter and spring run now exist at much lower levels and a much smaller geographic range, while for fall runs, this is mainly due to our hatchery releases.”
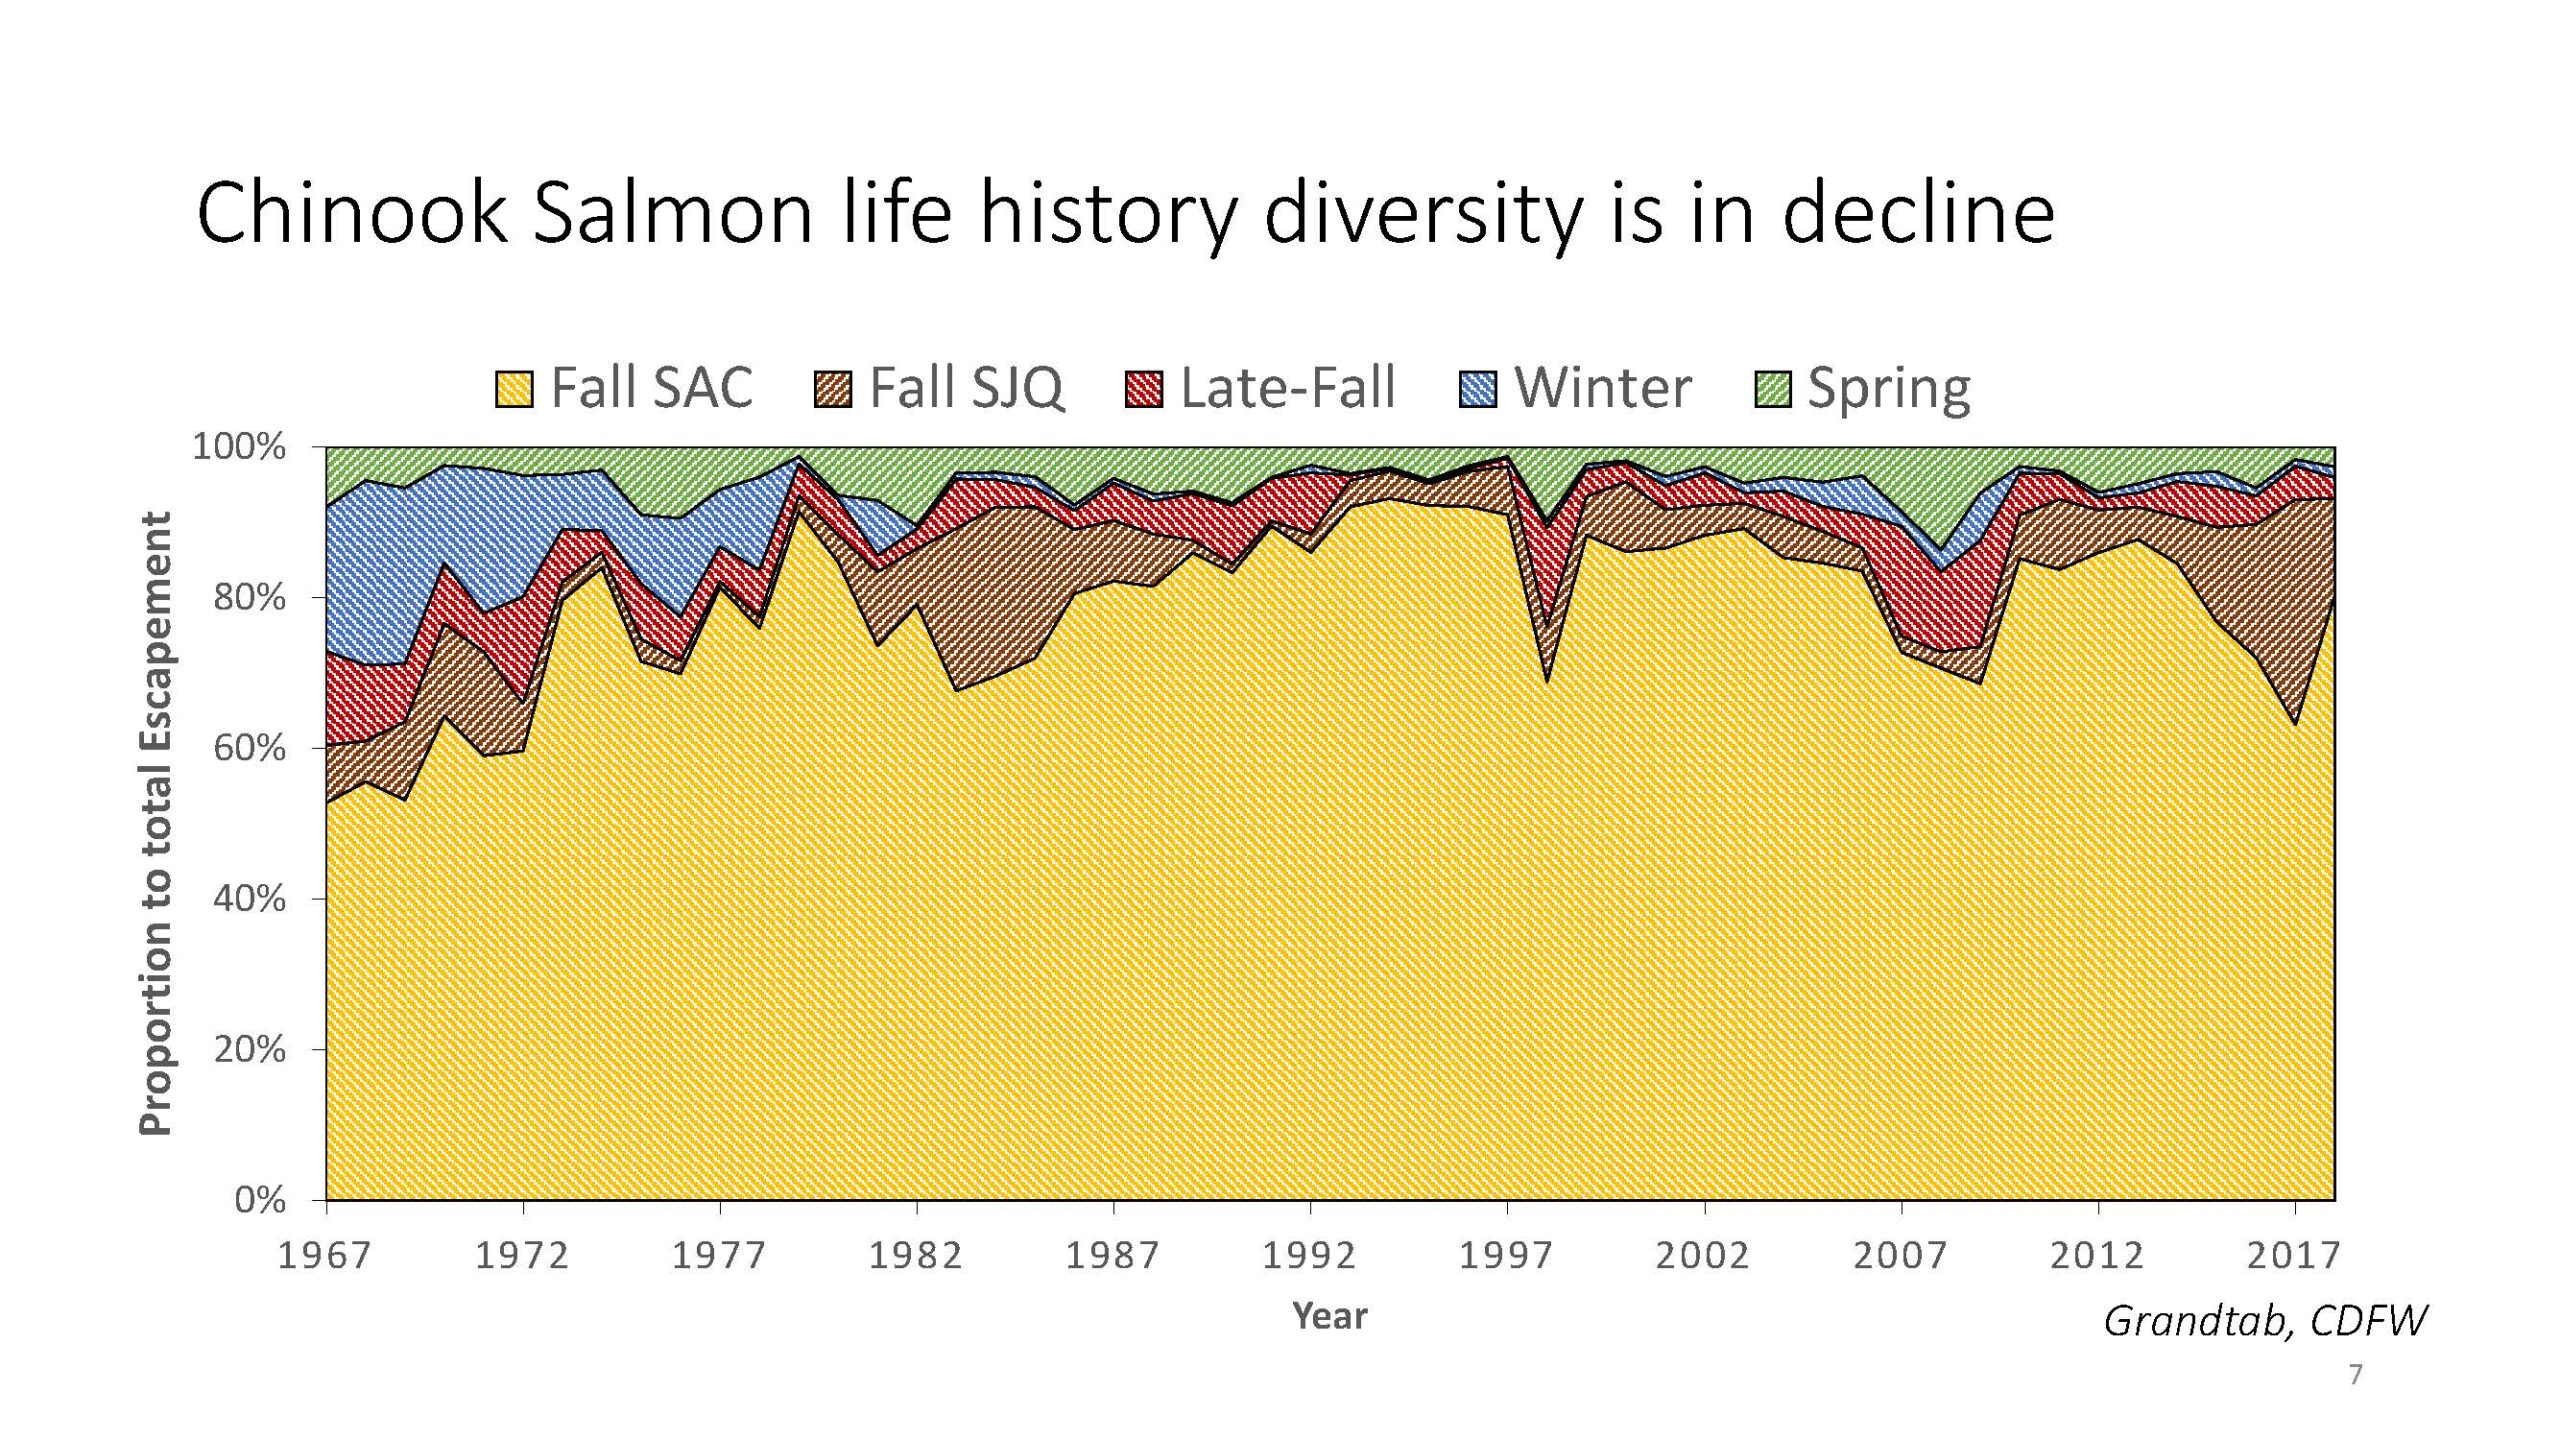 Not only is the abundance of Chinook salmon declining, but also we are losing life history diversity.
“That loss is reducing the ability to adapt to future environmental changes, and we’re making our salmon stocks less resilient,” he said.
Chinook salmon have been part of the Central Valley watersheds for the last 10,000 years or longer, but our detailed monitoring only covers the past 50 years. Papers have been published that look into historical records, such as fishery reports, that show a long history of native fishing for salmon. And after the colonization of California, there was commercial fishing in the Delta and, later on, in the ocean.
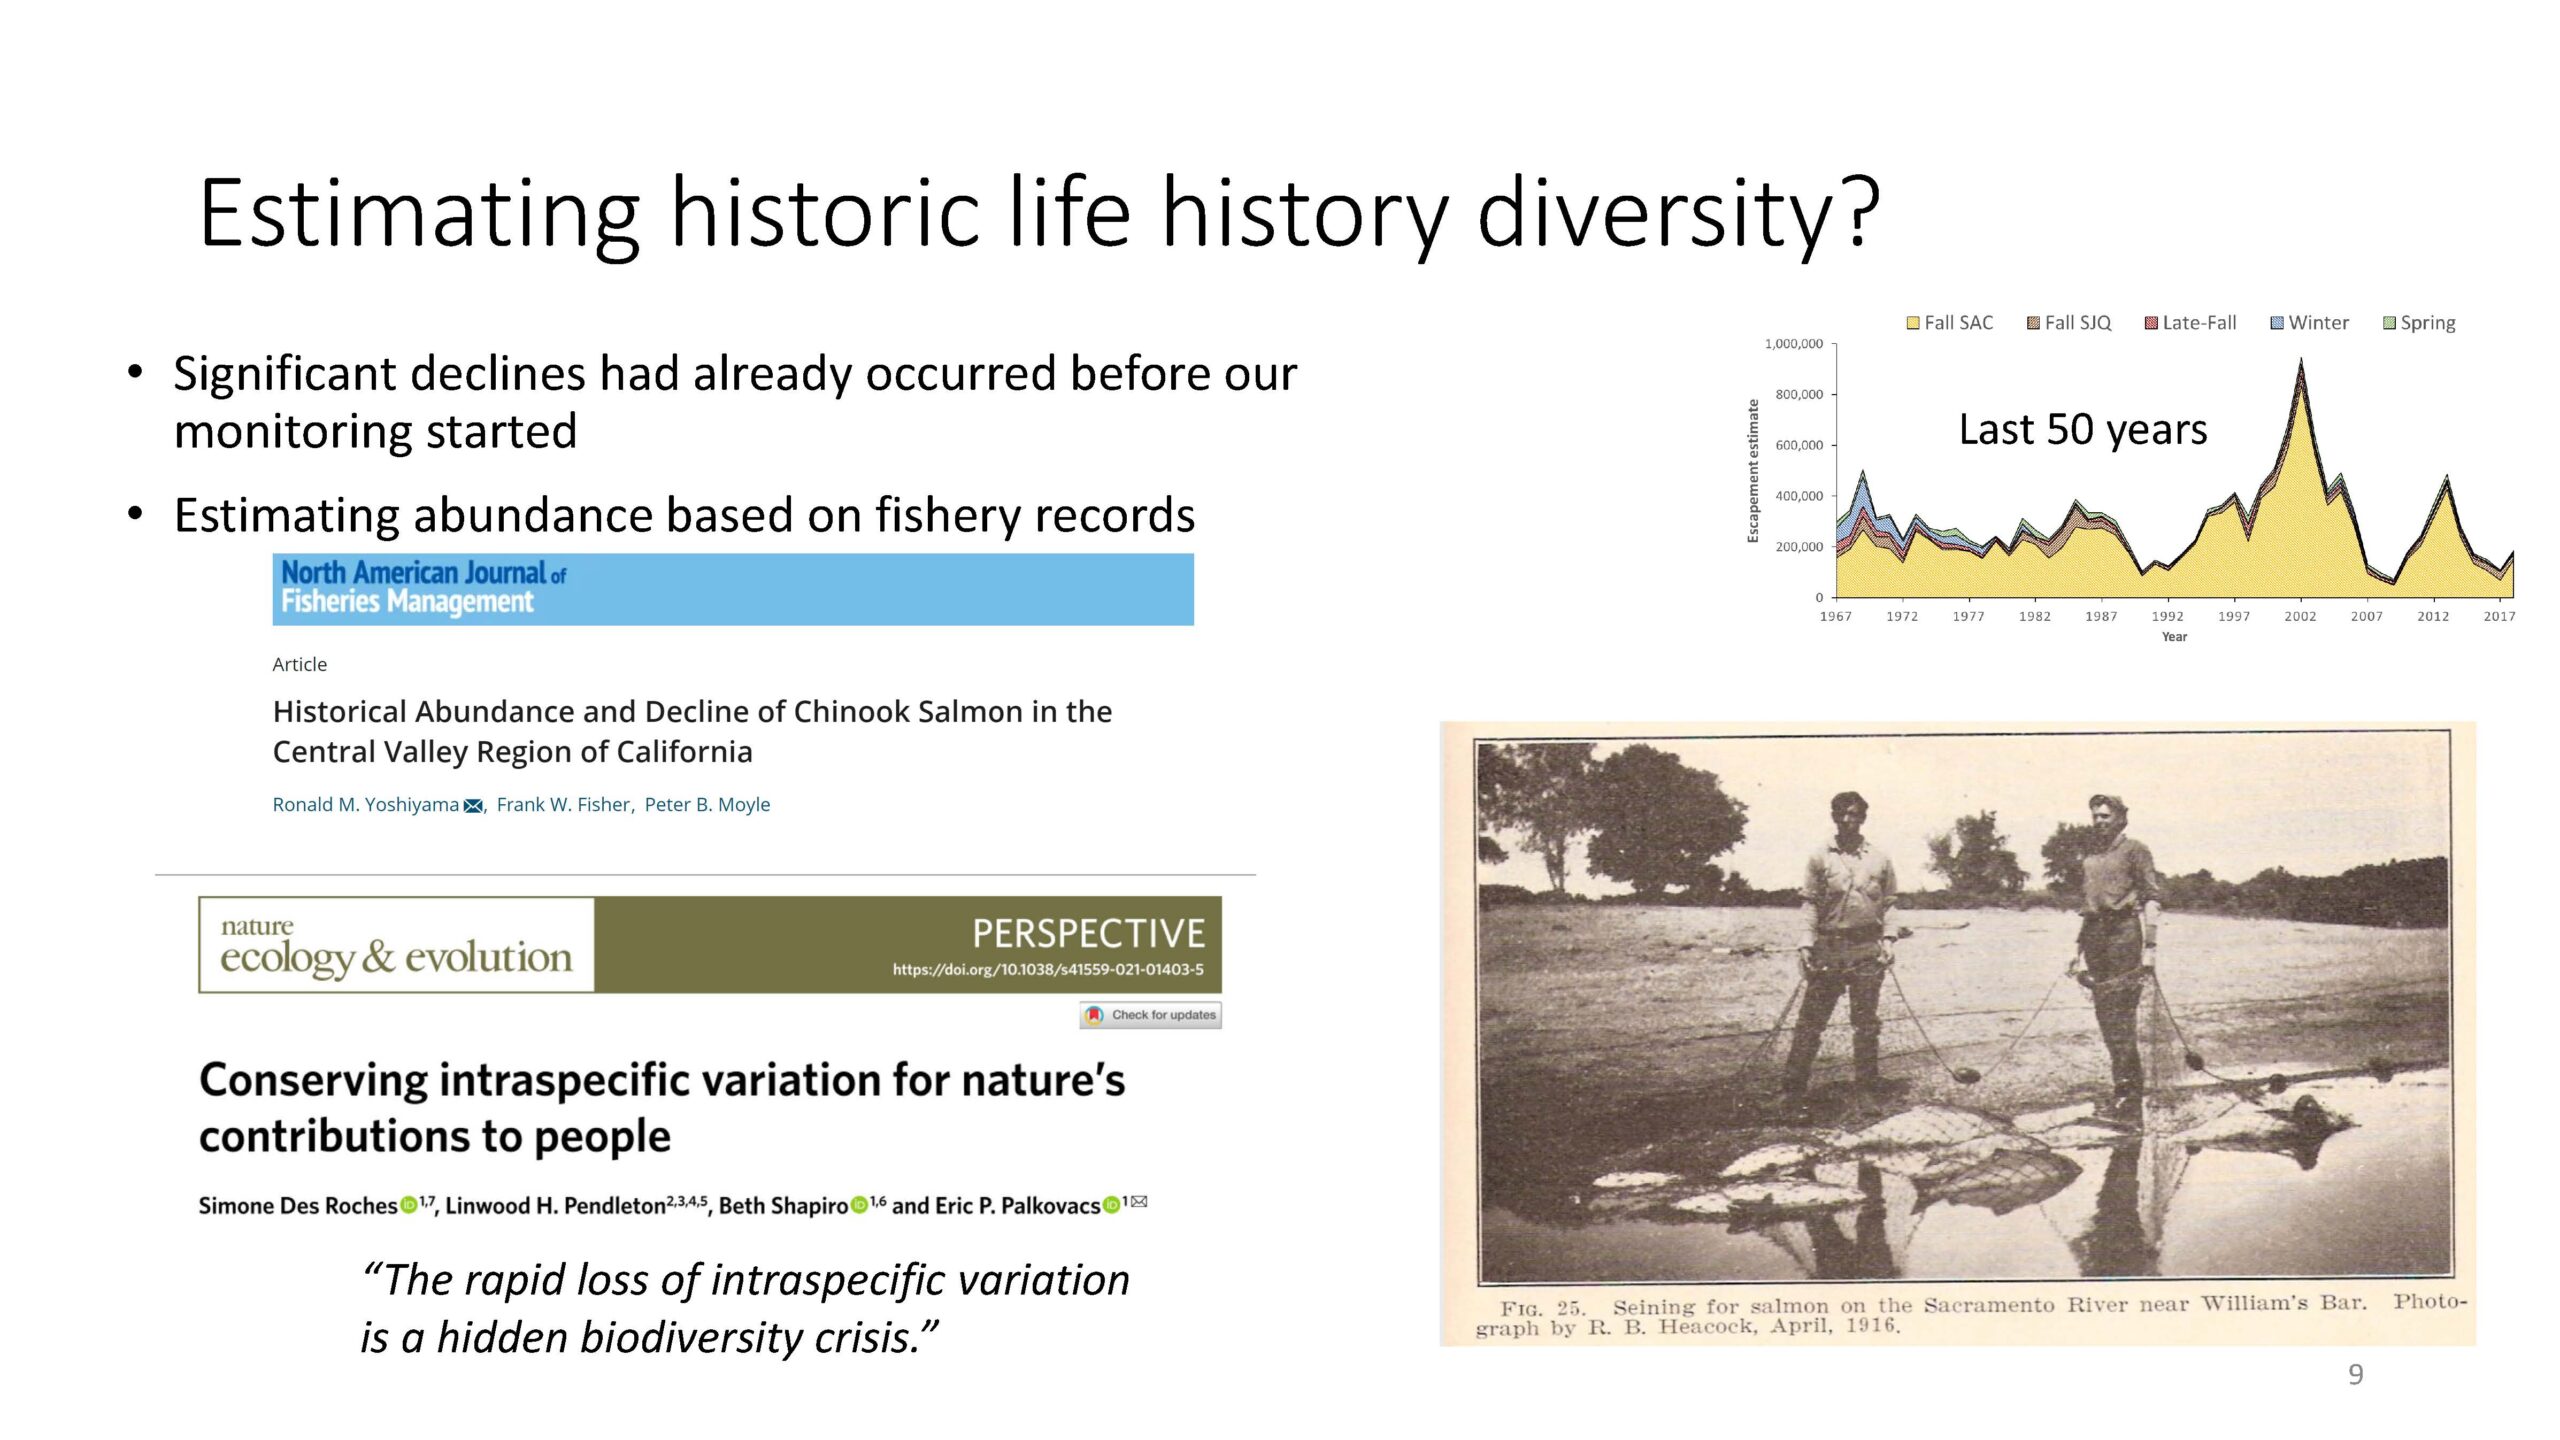 “While fish cards are not the same as abundance, we can learn a lot from these records,” Dr. Willmes said. “We can learn that there have been significant population declines before our modern monitoring that occurred in the late 1800s during the Gold Rush period and in the 1940s. Trying to estimate life history diversity this far back in time is extremely tricky. But I think it’s crucial if you want to improve our current management and conservation efforts because life history diversity can really drive resilience in all our salmon stocks.”
Examining historical life diversity
Researchers wanted to know the life history diversity of historic chinook at key time points in history, and they wanted to evaluate a shifting baseline. What do we expect chinook salmon to be able to do? How did they respond to environmental stressors? So the study combined fish ecology, geochemistry, and archaeology.
The study looked at four key life history metrics: age, size, natal origin, and habitat use.
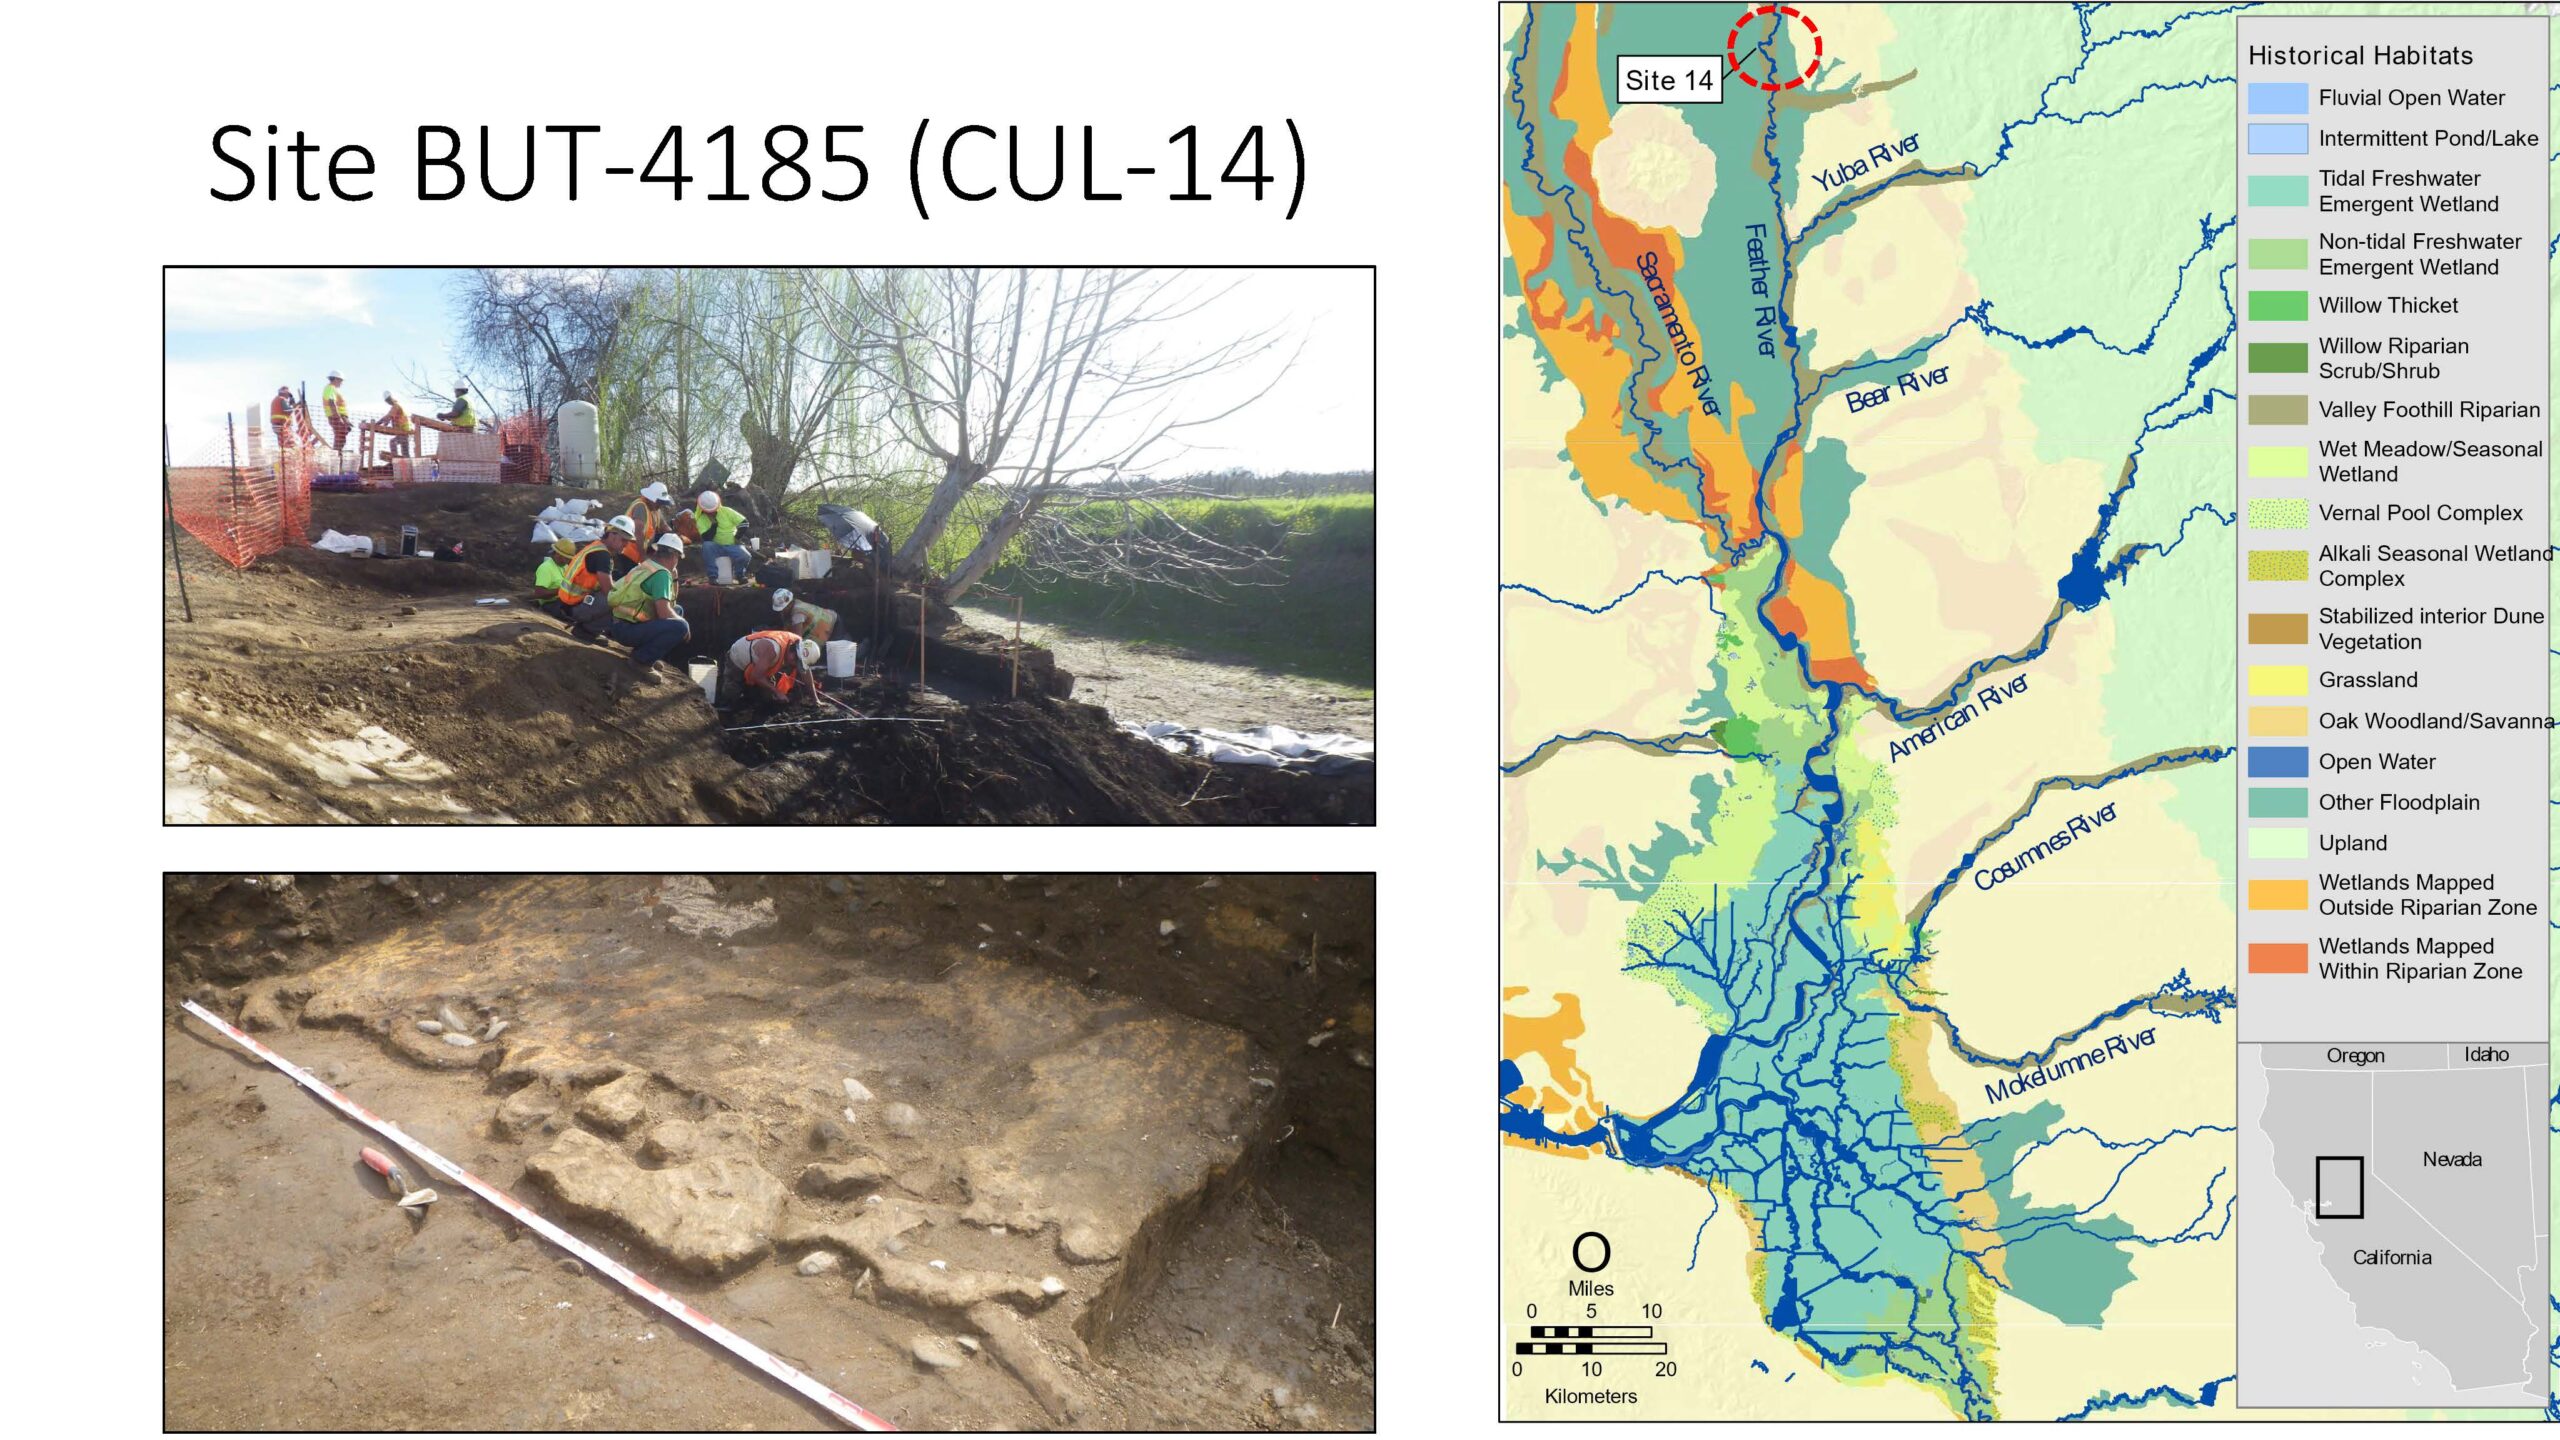 The archaeological site, a Maidu village dated to the mid-1800s, is located on the Lower Feather River near the town of Gridley and upstream of the confluence with the Yuba River. The mid-1800s was a time of intense change in California, with the Gold Rush bringing 300,000 people into the state. Mining practices at the time caused rapid changes to the watersheds, such as hydraulic mining drastically increasing sediment loads in rivers. The climate was also much wetter, with several large flooding events.
“This is a very different Central Valley than what we are experiencing and what the salmon are experiencing today,” Dr. Willmes noted.
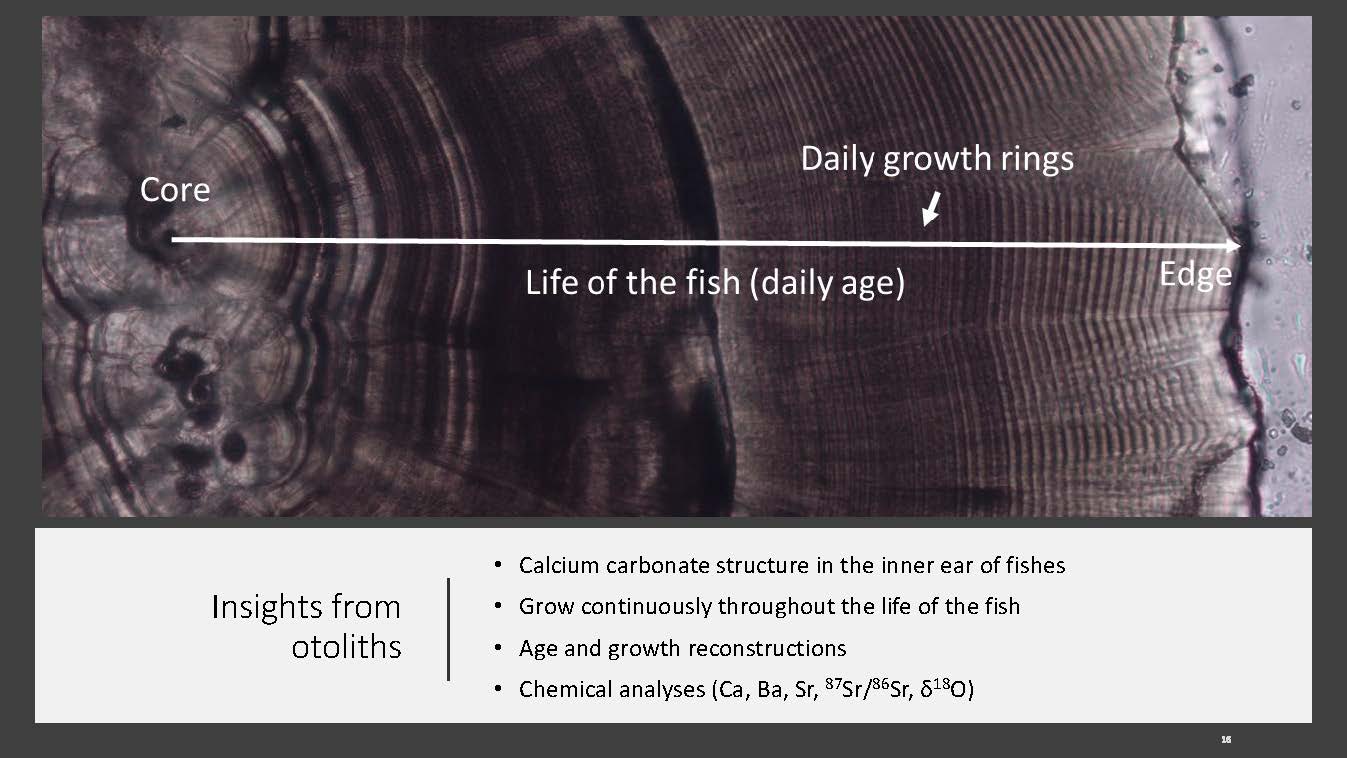
At the site, over 14,000 fish bones were recovered; over half of those were associated with salmonids. In addition, over 50 salmon otoliths were recovered; otoliths are calcium carbonate structures located in the ears of fish; they grow continuously throughout the life of the fish, putting down incremental layers, which makes it possible to use them to estimate age, reconstruct growth, and reconstruct the time-resolved life history movements of individual fish.

In freshwater systems, geochemical tracers make it possible to pinpoint movements among rivers and steams. In the estuary, because of the mixing of the Sacramento River, the San Joaquin River, and the Pacific Ocean, they become a tracer of salinity. So while they don’t relate to geography, he said they can represent different salinity habitats with the estuary.
“This salinity tracer is pretty accurate below three PSU and works really well still below 10 PSU or so,” said Dr. Willmes. “However, once we are reaching 10 PSU, we lose resolution. That means we cannot distinguish fish moving from 10 to 15 PSU or from 10 to the ocean, so that provides an upper limit of what we can do with this isotope tracer.”
The objective of the study was to apply the otolith tools to historical samples from the mid-1800s focusing on age, size, natal origins, and habitat use. However, they first needed to assess the integrity of the samples.
The picture on the slide on the bottom left, from Miller et al. in 2011, shows pristine otolith from modern times (A), and then three otoliths from 500-year-old Chinook salmon, showing various degrees of alteration and changes (B, C, D). Dr. Willmes noted that this can happen with samples buried in an archaeological site; it affects the use of otolith tools to reconstruct life history metrics.

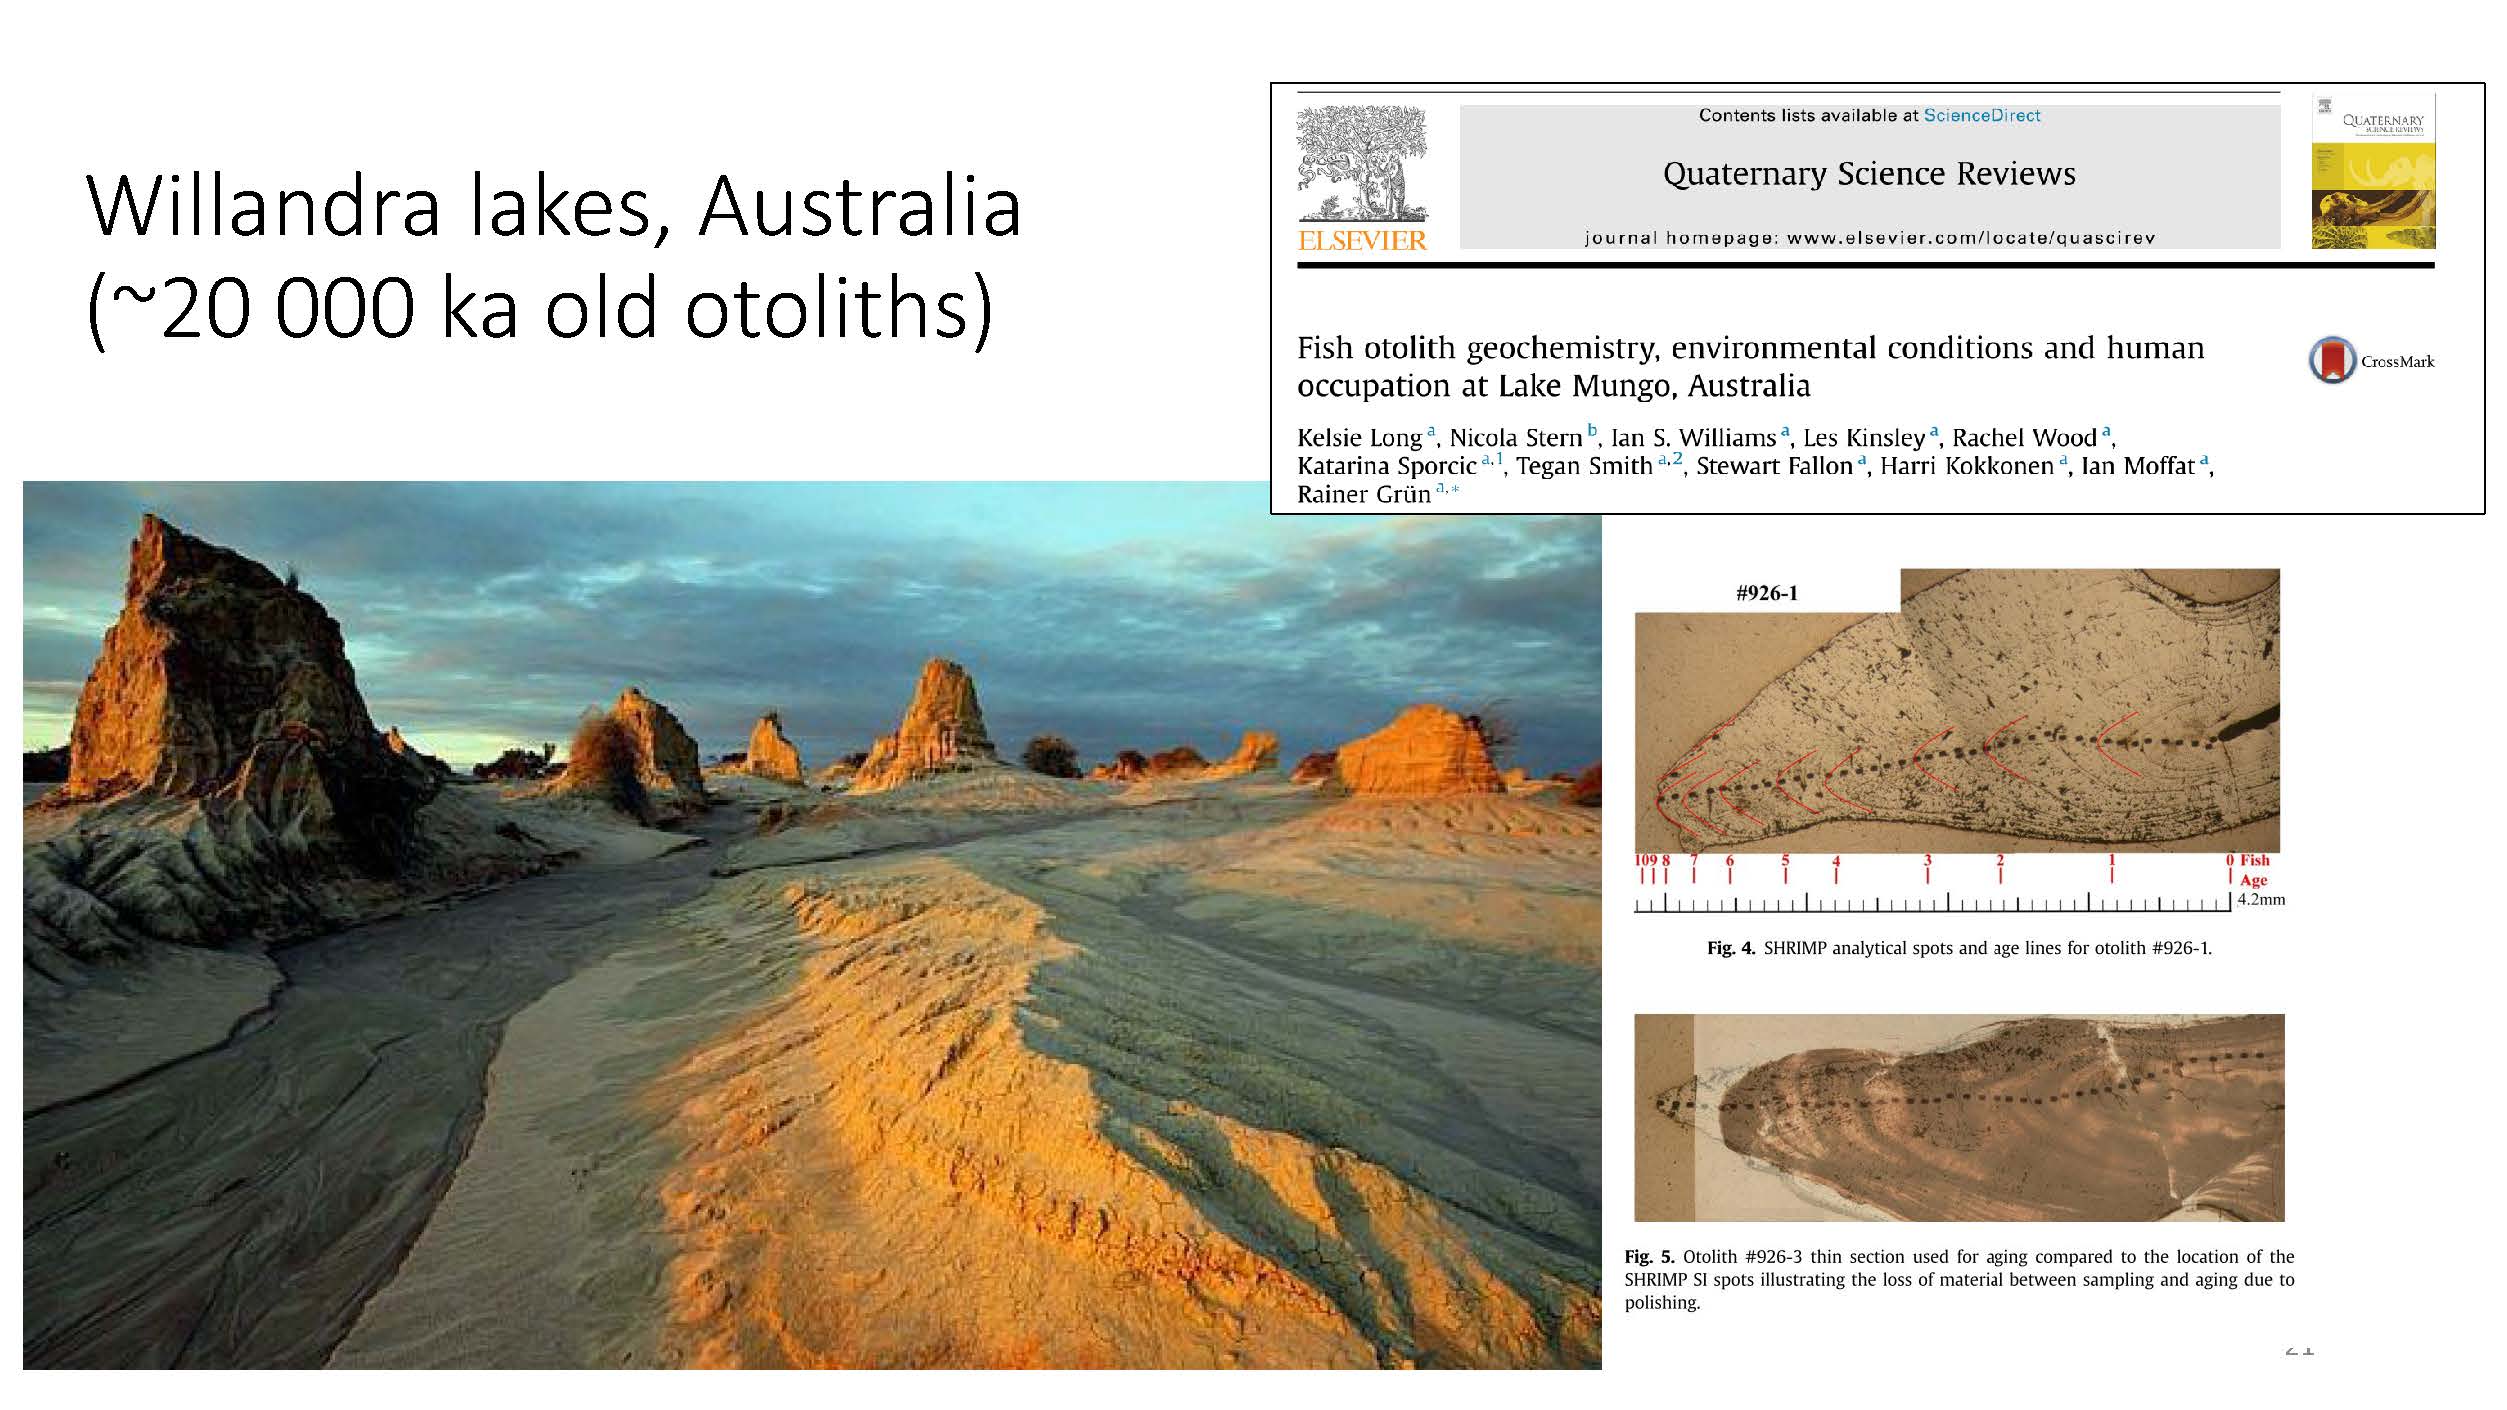
Another example is a set from the Willandra Lakes, a dry lake bed in Australia, shown on the upper right. Otoliths over 20,000 years old were recovered here in pristine conditions and were very well preserved. This illustrates that time alone doesn’t always predict how well preserved the sample is; it also means each otolith must be assessed on a sample-by-sample basis.
The researchers selected 49 samples they identified as suitable based on visual analysis. Then, further analysis was performed to look for alterations. In the end, they were left with 43 samples that were deemed suitable.
What they found
Before discussing the results, Dr. Willmes noted that all samples come from one single archaeological site on one single river in the Central Valley. “That presents a very narrow snapshot of past Chinook salmon life history, and human fishing behavior is mixed into the whole story of this as well.”
Age
They first did age reconstructions and found many three, four, and five-year-old fish. To compare the results to modern fish in the local watershed, they used a 2018 paper that studied the modern population on the Feather River. They used the Regional Mark Information System for the broader Central Valley, containing the ages and sizes of chinook returning to the Central Valley.

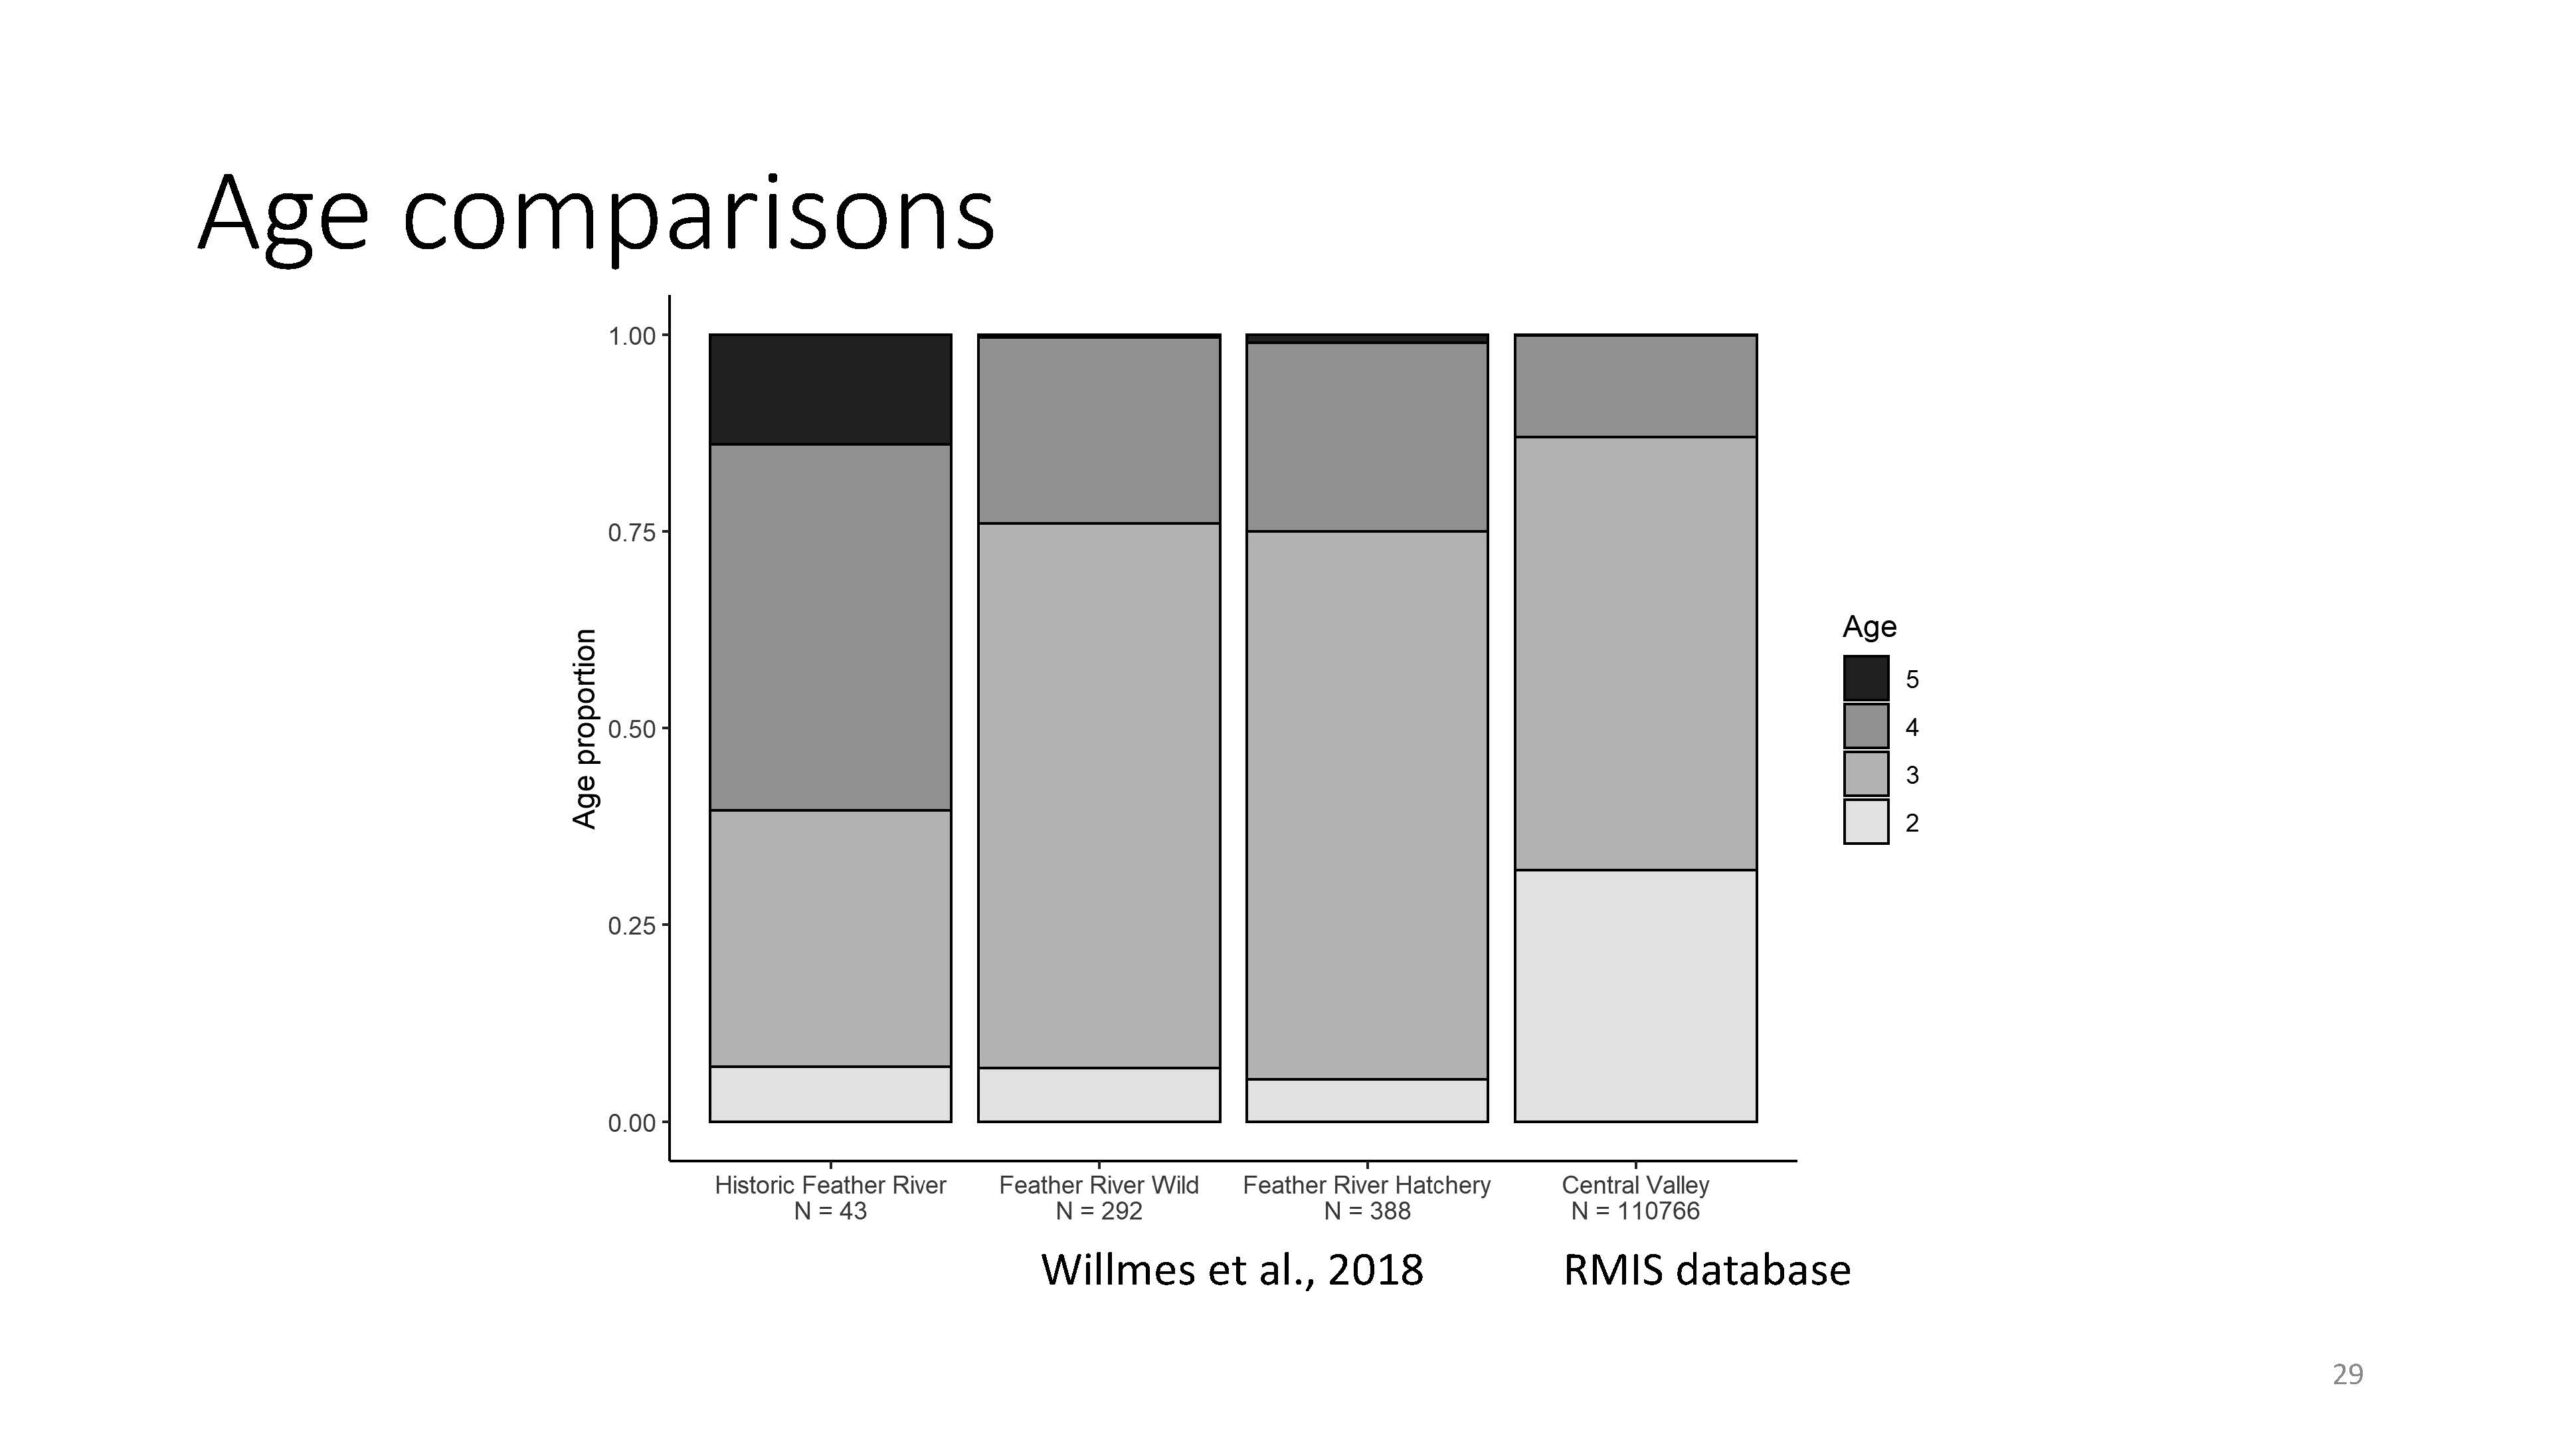
In this comparison, both in contrast with local watersheds as well as wider Central Valley, the historic samples had a much wider age distribution with a lot more four or five-year-old fish.
Size
Next, the researchers wanted to reconstruct fish sizes based on the otoliths. Dr. Willmes said there is a species-specific allometric relationship between the growth of an otolith and the somatic growth of fish, but it can vary between species and even within species. So using the Feather River study, they constructed a linear model that they applied to their historic otoliths.

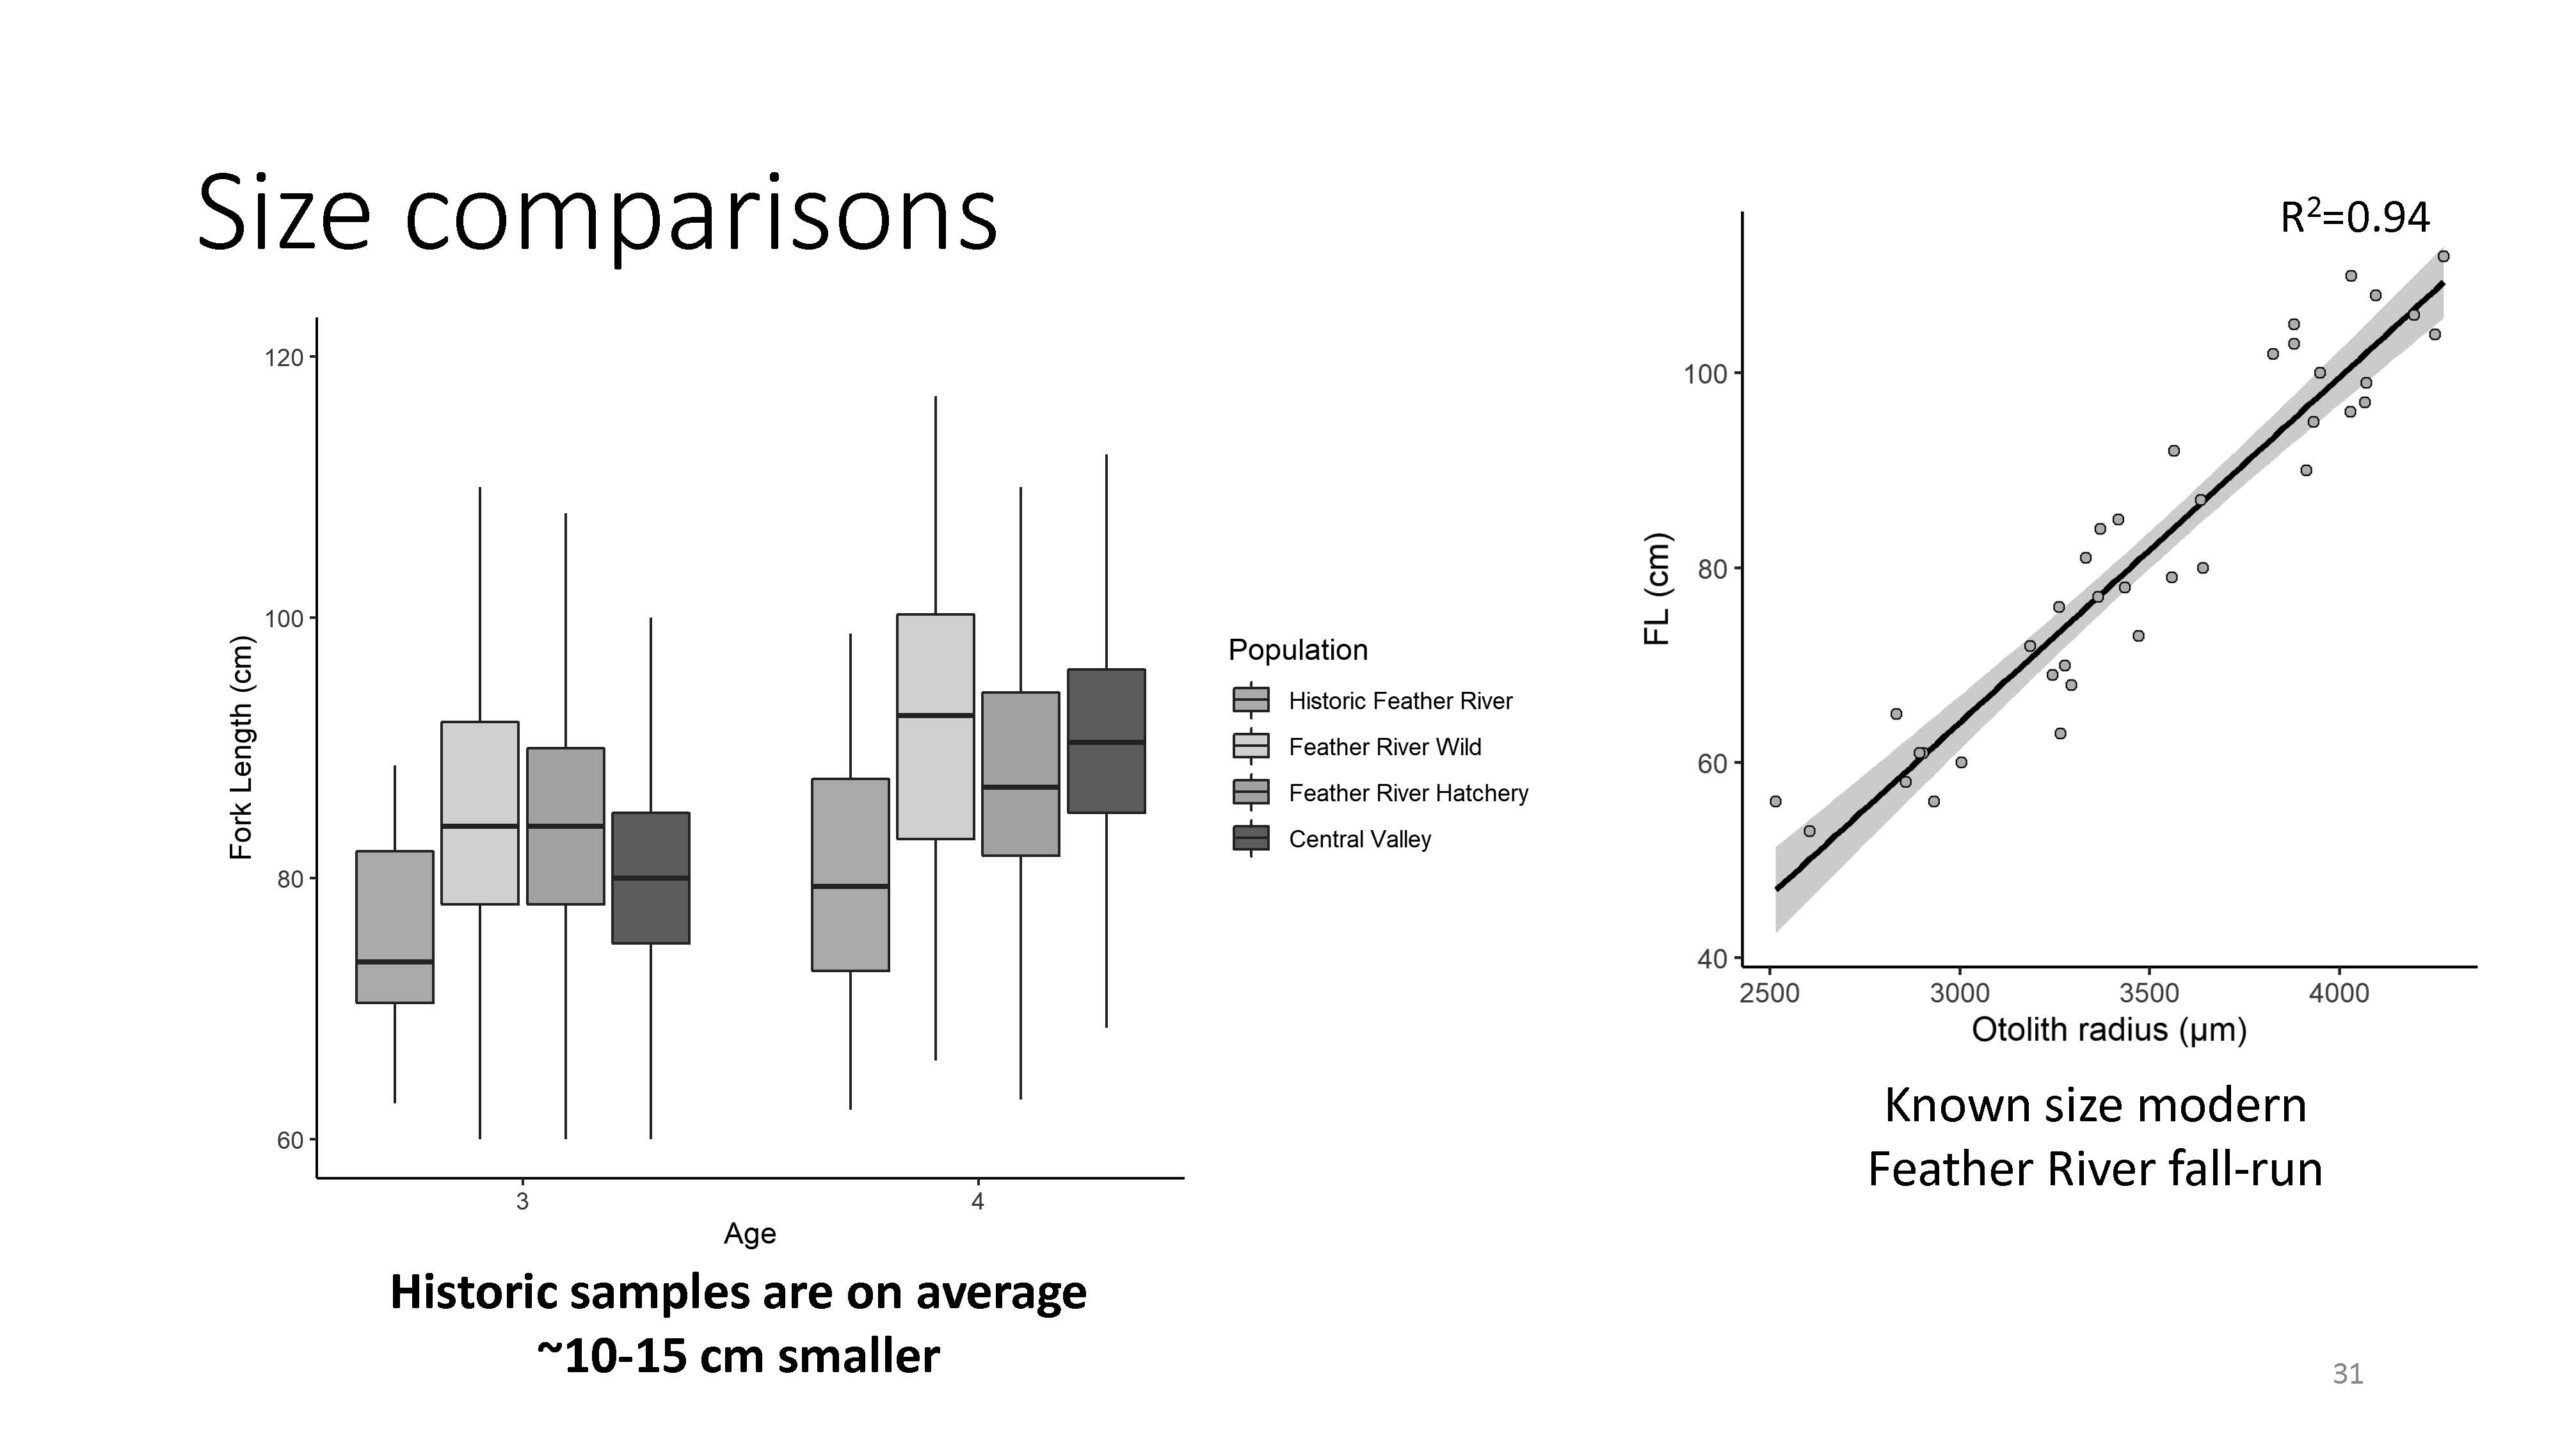
“We can compare this again to the local feather River watershed and our modern samples from the wider Central Valley,” said Dr. Willmes. “We find that independent of age, the historical samples were generally 10 to 15 centimeters smaller. That was a surprising finding.”
Natal origins and habitat use
They next looked at natal origins and habitat use. The time the fish spent in freshwater before moving out can be evaluated using geochemical tools by looking at the time and life history profile indicated by the red circles.
“By far, most of the fish in our historical data sets come from the Feather River,” said Dr. Willmes. “But there’s a contribution of some Yuba River fish and some unknown strays that could either come from other Sacramento River tributaries or smaller tributaries from the Upper Feather River watershed that are not present on our modern landscape.”


He noted that, of course, there’s no hatchery fish in the historical example, so it’s interesting to see that even though the site was upstream of the confluence of the Yuba River, both in a historic and modern sample, there’s some connectivity between the Yuba River and the Feather River.
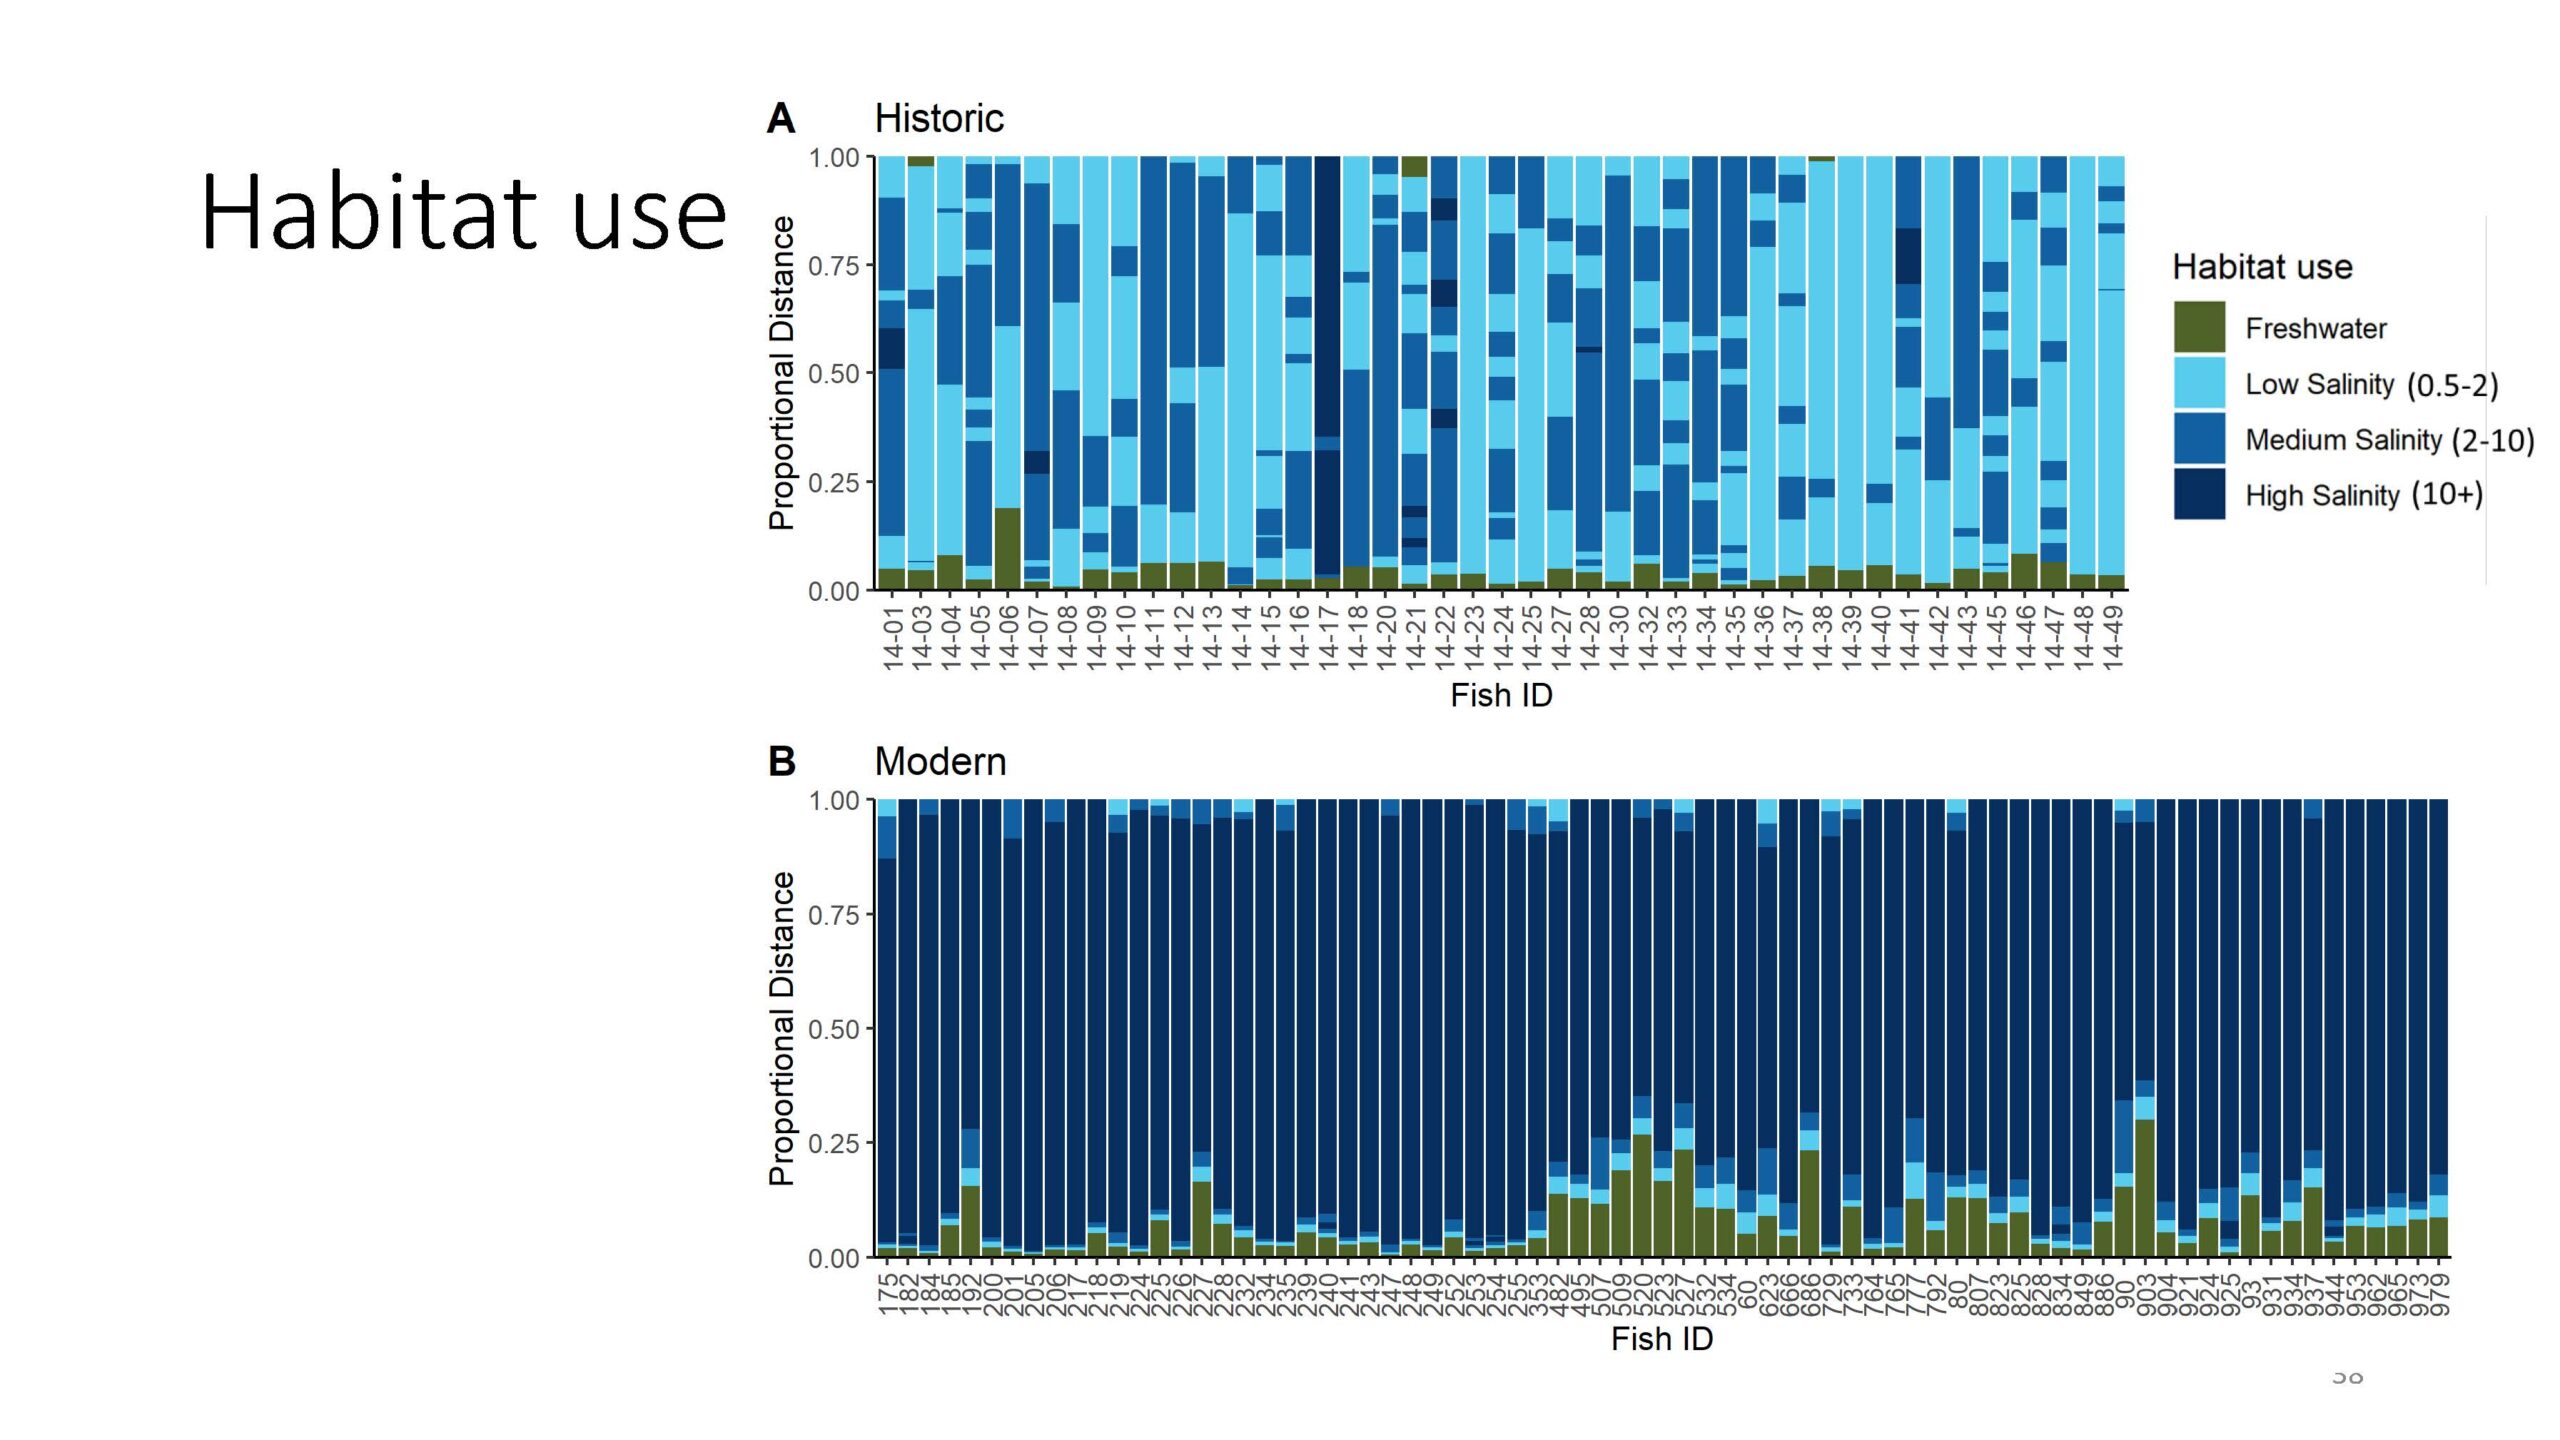 Finally, the researchers looked at lifetime habitat use, focusing on what happened to the fish as they moved out of the freshwater system. Each bar or column on these graphs represents an individual fish with the y axis representing their entire life; the numbers express the proportional distance from the core of the otolith to the edge. The colors represent different habitats. He noted the high salinity habitat is capped at 10 PSU, which is the resolution limit of the tracer.
“For the modern chinook [shown on the bottom graph], they spend varying amounts of time in freshwater; they move quickly through the low and medium salinity habitats of the Delta and estuary and then spend most of their life at high salinity in the Pacific Ocean,” said Dr. Willmes. “In contrast, our historic samples offer a completely different picture. It appears that these fish moved out into the low and medium salinities of the Delta estuary and not into the Pacific Ocean. They remained below 10 PSU for most of their life with the one exception here at 1417.”
This difference in the migratory strategy and habitat use between the modern and historical fish is clear in comparison. He noted that it is a surprising result, but it makes sense if one thinks about how different the Central Valley used to be and how the fish would have experienced it.
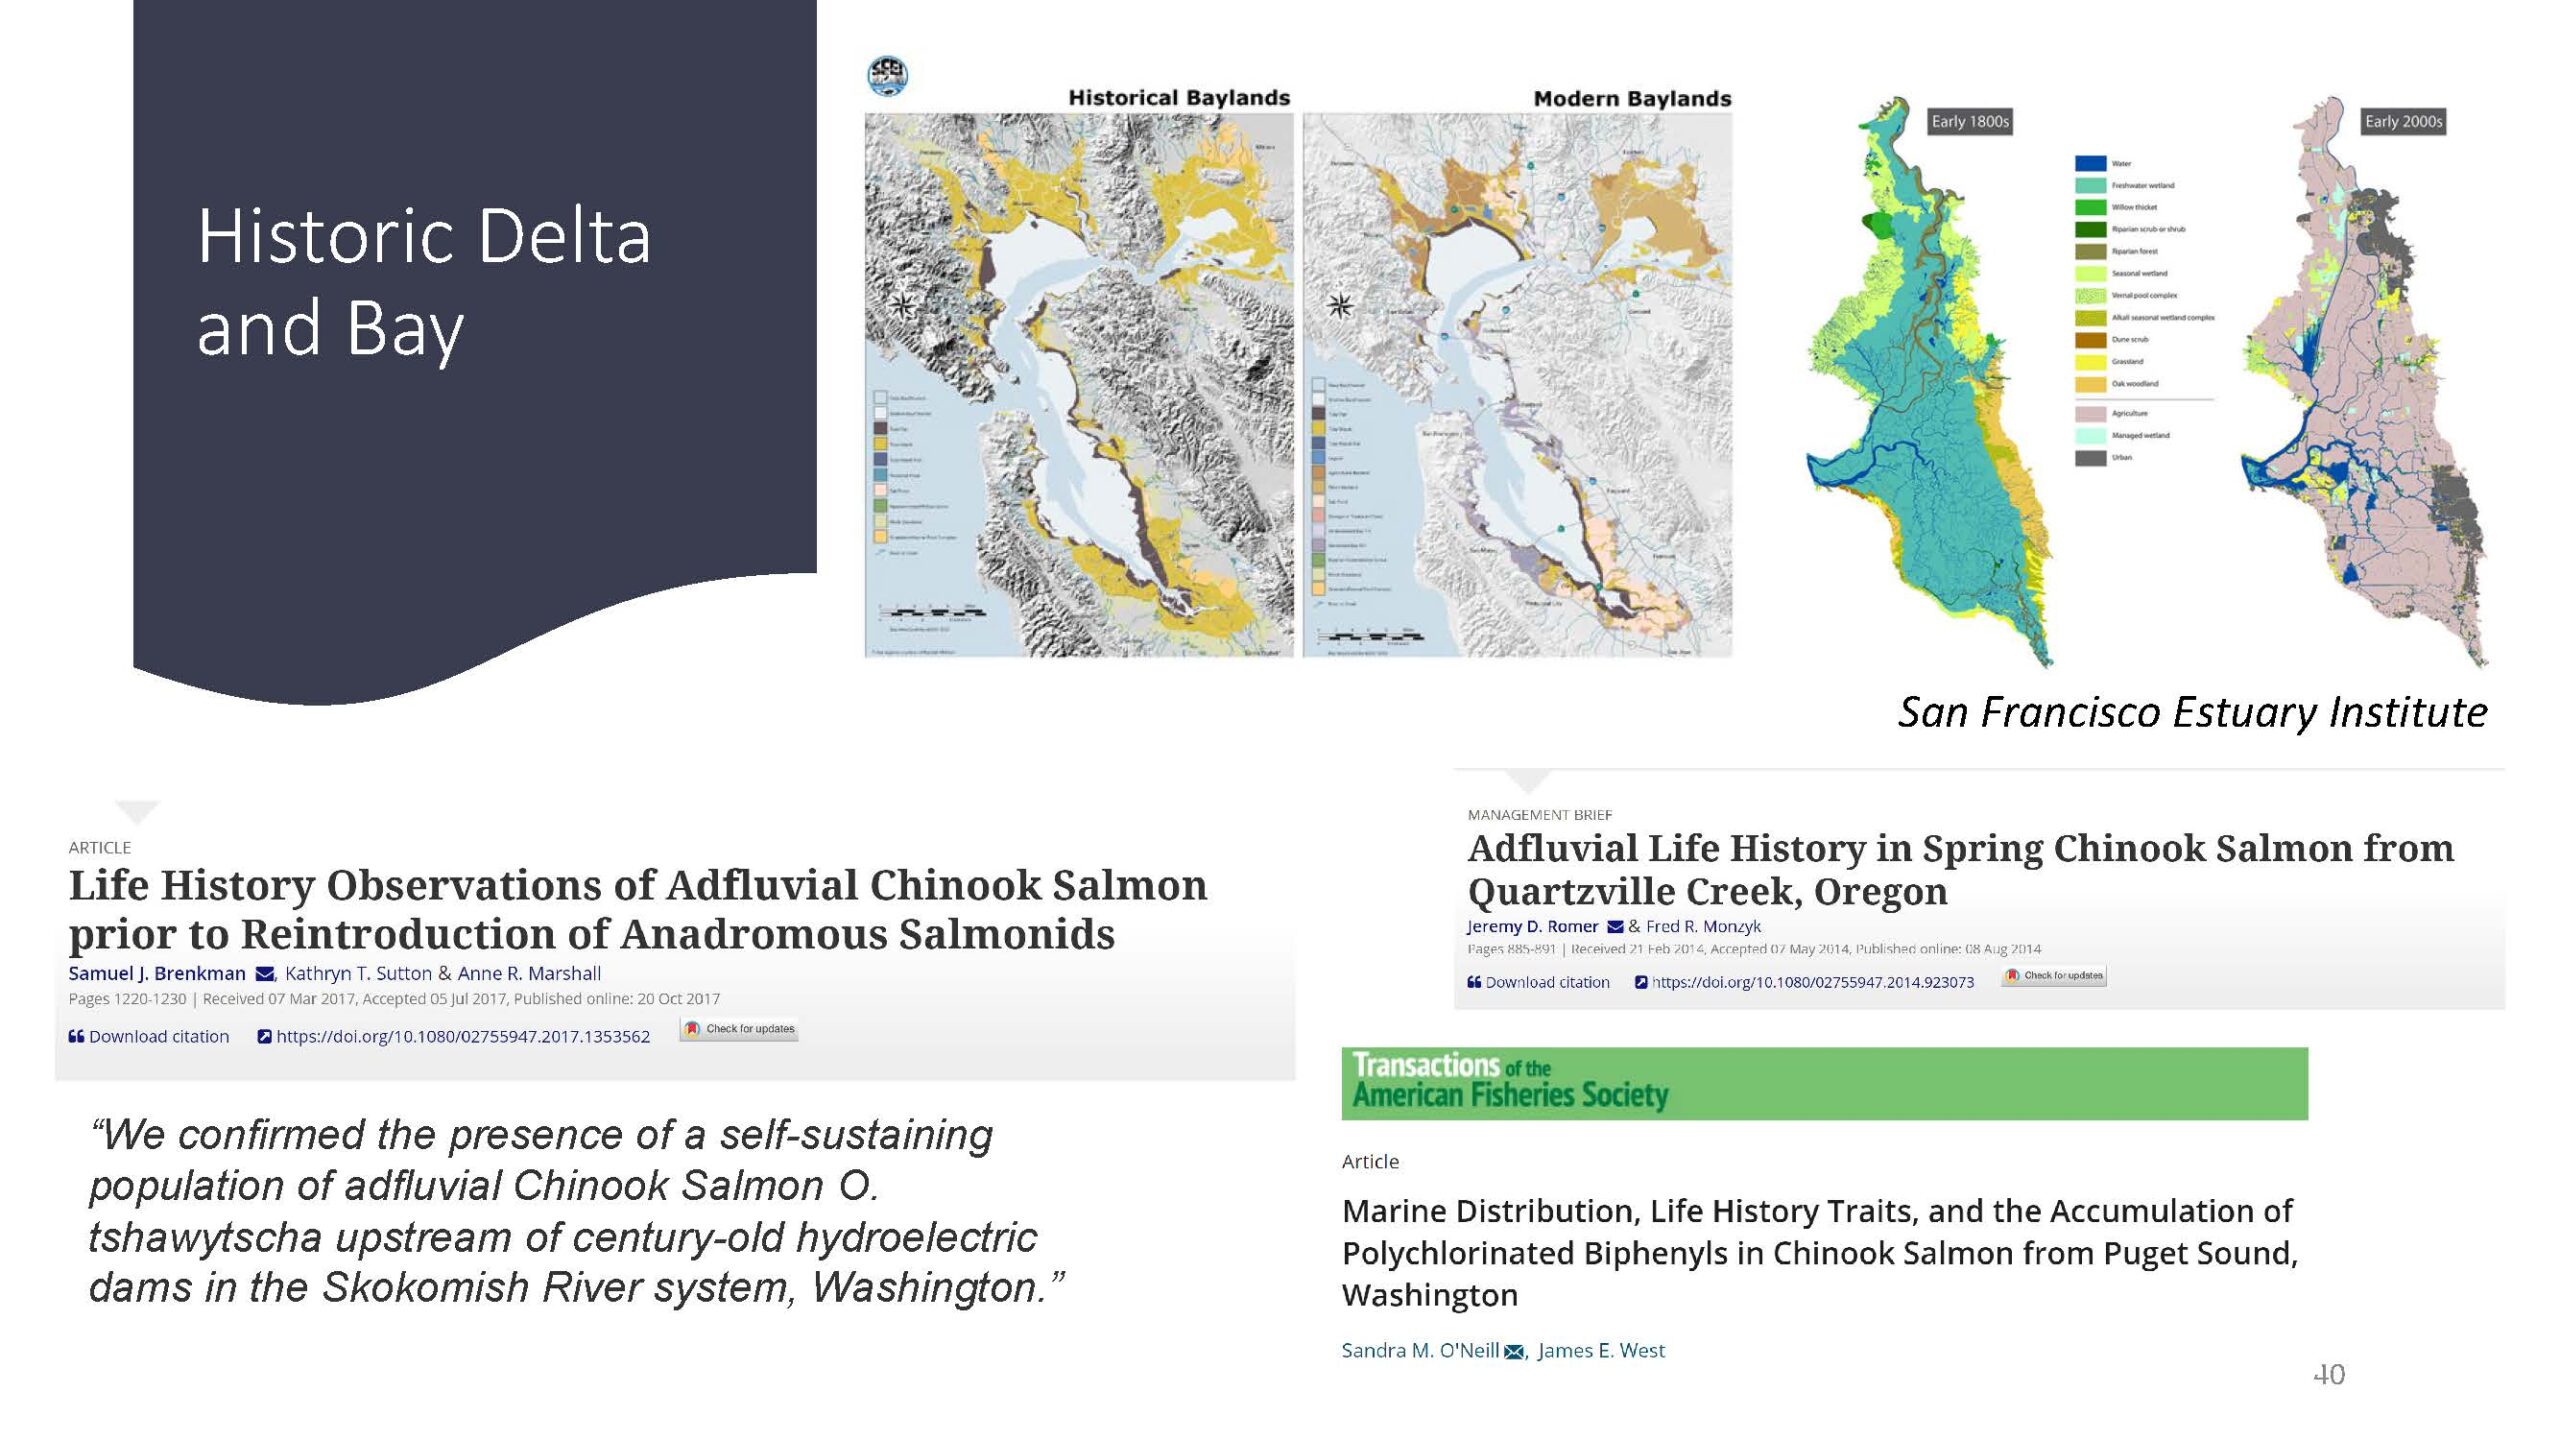 “The historic Delta and Bay used to provide lots of rearing opportunities for salmonids, especially in wet years, such as the early and mid-1800s, and high freshwater outflows and widespread flooding may have increased available habitat even further,” he said. “We also know that chinook trapped above dams, for example, in Washington and Oregon can use adfluvial life history strategies. They are highly adaptable. And we also know that chinook in Puget Sound can remain in brackish water habitats for extended periods of time before migrating out to the ocean.”
In conclusion …
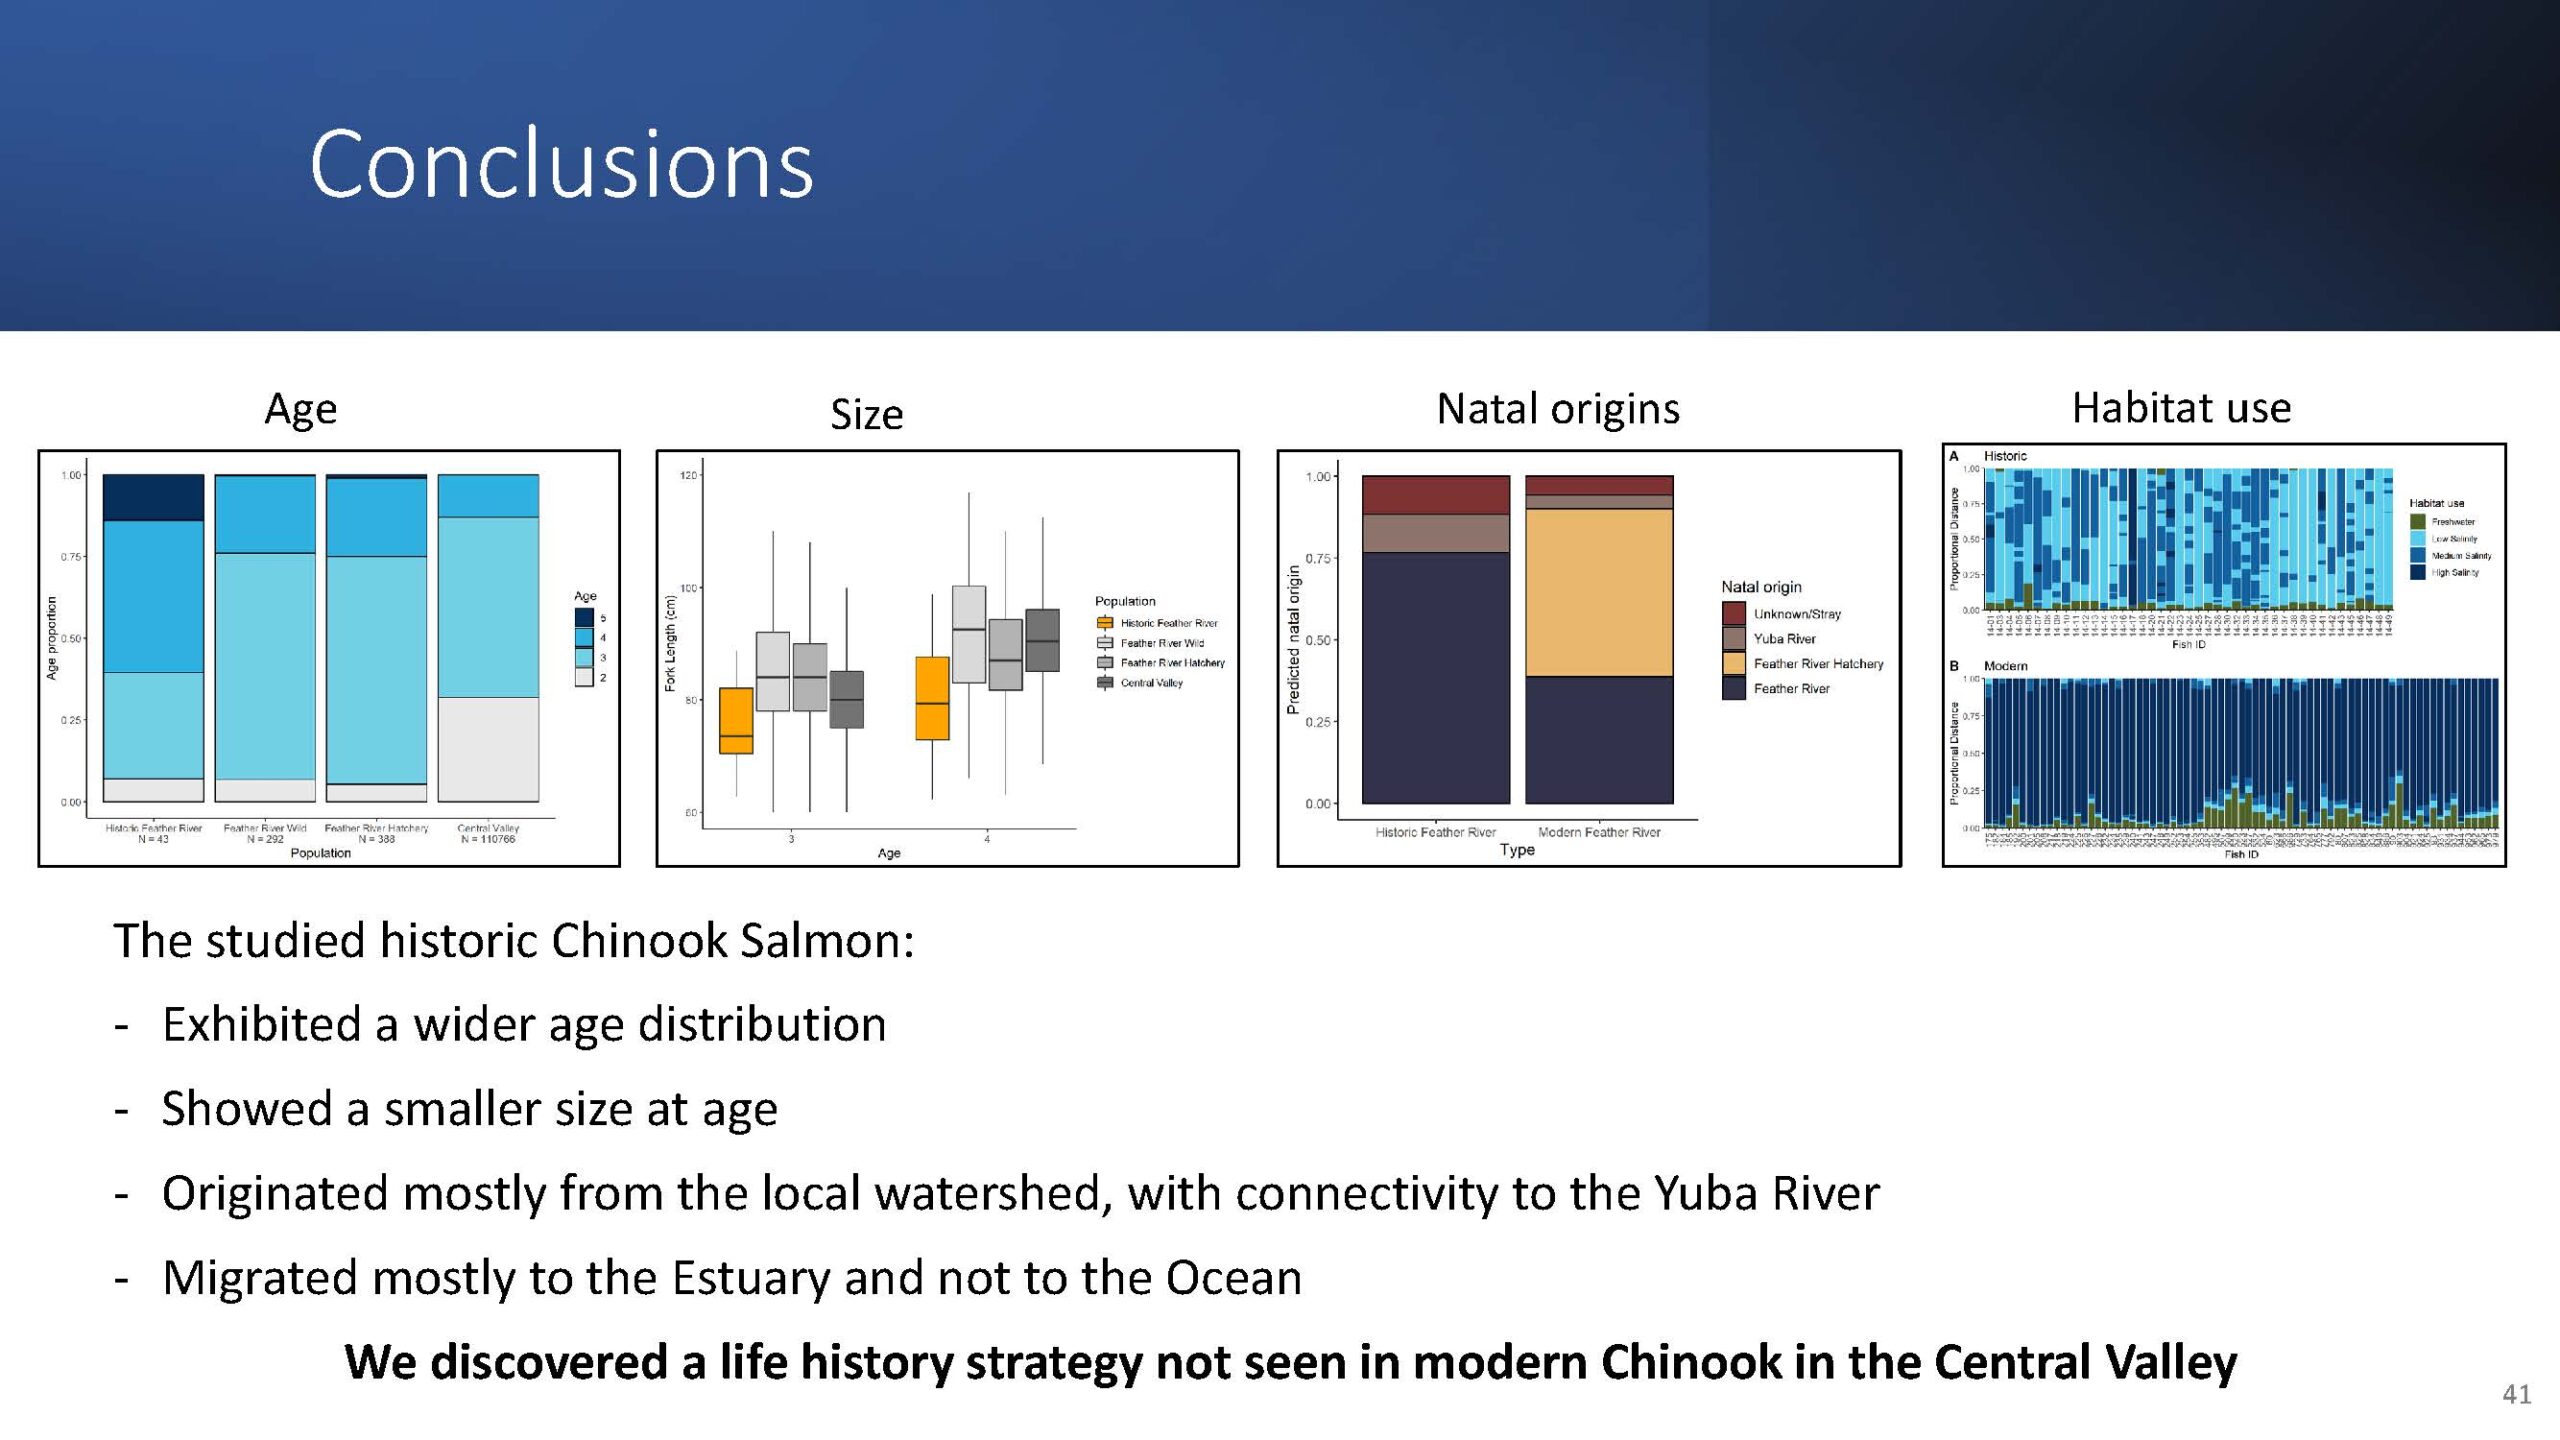 So in conclusion, the study found that historic Chinook salmon exhibited wide age distribution and were smaller sizes at age. They mainly originated from the local watershed of the Feather River with some connectivity from the Yuba river as well, and they mainly migrated through the estuary and not out to the ocean.
Dr. Willmes said it is worth noting that these results are all from one archaeological site, so it’s a very narrow snapshot of past chinook salmon life history diversity. “I think it’s fair to assume that most historic salmon went to the ocean just like their modern counterparts. But what I want to highlight here is that we think we’ve discovered a life history strategy that we do not see in modern chinook and the Central Valley.”
Next steps
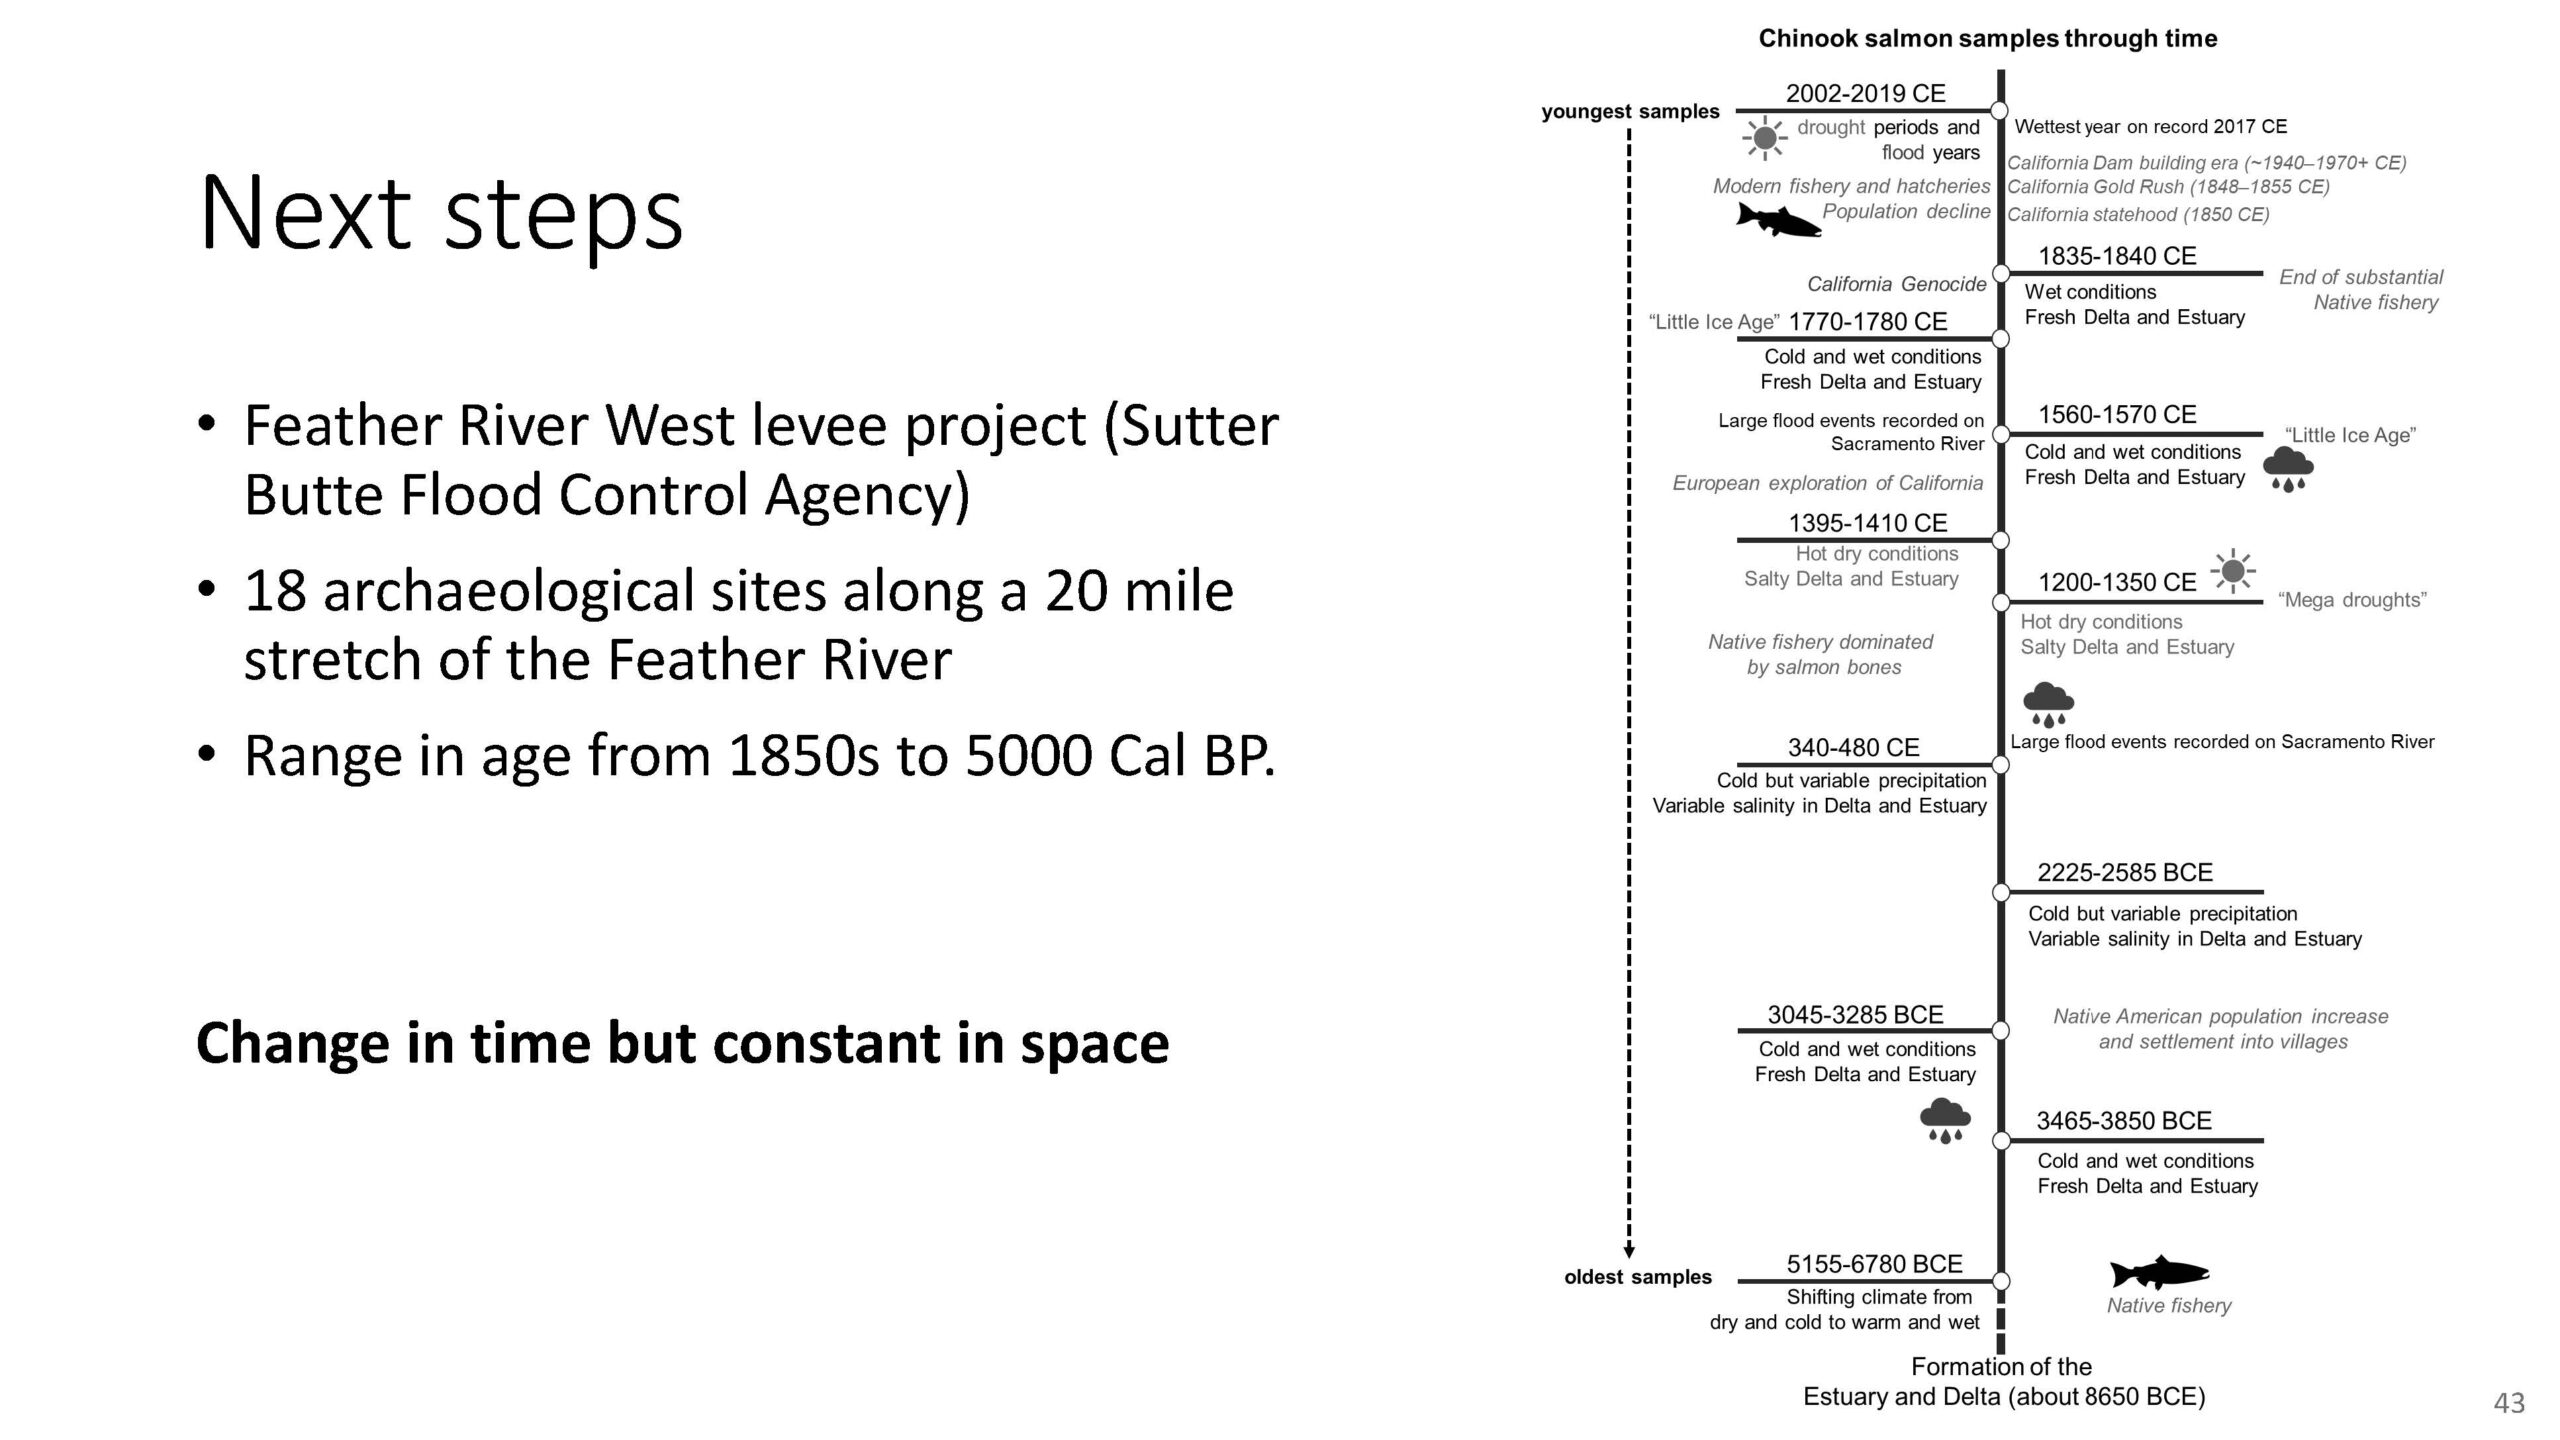 As for next steps, this is only the beginning of the project. There are 18 more possible sites containing chinook salmon otoliths that could be studied, ranging in time from the 1850s back to thousands of years before present day.
“What that means is, we’re staying constant in space, but we can go back through time,” said Dr. Willmes. “Normally, when working with archaeological sites, you’re changing both of these variables. So this is a really unique case.”
“It also means we can start looking at long-term climatic changes, such as investigating the megadrought periods or other climate extremes that are unparalleled with anything we see today. That means we can also look at what kind of salmon life history strategies were successful during this climate extremes, and what can we learn from this for modern management and conservation efforts.”
QUESTIONS & ANSWERS
QUESTION: Could you talk more about the size results you had? And if you think without the dams, there was some reason why they didn’t need to be as big or if they were more fecund in the past? What is your hypothesis there?
“That was one of the really surprising results in our study,” said Dr. Willmes. “Ancient salmon, historic salmon, they always bigger, right? They’re doing better. So seeing that our model say they turned out to be smaller, I think it might have something to do with their estuarine life history. Just not going to the ocean and not having to make that mass migration. And that could be a trade-off. It will be tricky to learn something about the fecundity of the historical samples, sadly.”
QUESTION: You mentioned some other examples like Puget Sound. I know that cutthroat have this kind of estuarine residency, but is there evidence that chinook did that in Puget Sound or anywhere else?
“There is, actually,” said Dr. Willmes. “Chinook salmon trapped above dams actually can do pretty well. There are landlocked populations in California, Oregon, Washington, and Idaho. And then in Puget Sound, chinook can move into the Lower Sound or the Inner Sound and spend multiple years there. They’re being caught in the estuary. I think the salinity in Puget Sound can vary quite a bit; it can go nearly to like 20 PSU or 25 PSU. So it’s not quite as low and not really that comparable, maybe to the estuary. But it’s still pretty interesting; there seems not to have this large offshore migration to the continental shelf, but staying close to shore.”
QUESTION: Is it possible that these fish were actually harvested in the estuary, so what we’re seeing is more of an effect of fishing techniques? And that’s why we see a lot more fish that have this low salinity life history? It’s just surprising to me that almost all your fish have that.”
“That was a really surprising result,” said Dr. Willmes. “We think they were harvested on the Feather River. Based on the other remains at the [archaeological site] and fishing techniques used on the Feather River, they were constructing low weirs and trapping salmon moving upstream. But you’re right … We are looking at human fishing behavior overlain onto the ecology of the fish. We also find salmon in some sites in the estuary. So people were fishing for salmon at that time. I would be interested in working on some of these as well. But the fishery studies, some of them are three or four years old. So even if they were caught in the estuary, they spent three or four years at these low salinities.”

