

No matter where you are in the world, you are in a watershed. The water flowing over the land and through the soil creates a complex network that connects the uplands, springs, wetlands, streams, and rivers of the watershed. A well-functioning watershed provides clean water for drinking and irrigation, healthy soils, flood protection, habitat for wildlife, and outdoor recreation opportunities. However, managing land and water for selected products or services has altered the conditions and functions in many of California’s watersheds, and so protecting and restoring watersheds is important for maintaining the resources that residents within the watershed depend on.
This post provides an overview of watersheds, the components of a watershed, water budgets, how to estimate runoff, protecting water quality, and watershed management. This post is based in part on a lecture given by Dr. Helen Dahlke at UC Davis as part of the UC Davis Shortcourse on Groundwater and supplemented with additional research.
What is a watershed?
Historically, watersheds were defined as the divide between two drainage basins that separates the rainfall runoff into one of the basins, but in recent years, the term has been come to be applied to the entirety of the basin and not just the divide. NOAA defines a watershed as the land that channels rainfall or snowmelt to creeks, rivers, streams, lakes, and eventually to outflow points such as surface reservoirs, bays, estuaries, and the ocean.
A watershed includes all the natural and man-made features, including surface and subsurface features, climate and weather patterns, geologic and topographic history, soils and vegetation, and land use. A watershed can be a small area or as large as the Sacramento-San Joaquin basin. Smaller watersheds are sometimes referred to as catchments; large river basins are sometimes called drainage basins.
 Watersheds are the source of surface water. When it rains, much of the rainfall is absorbed by the ground or the plants and then evaporates back into the atmosphere. Some of the rainfall can drain off the land surface and end up in lakes and rivers where it might even flow out to the ocean. And some of that water will percolate into the ground and accumulate in the groundwater basin.
“When you want to define a watershed on the landscape, it’s up to you as the user to define the point that you set as the outlet for the watershed,” said Dr. Dahlke. “What we often do is choose a point such as a stream gauge on the river because this would then allow us to relate measurements of flow that we take at that stream gauge to whatever processes that happen upstream in the watershed.”
 There are many different ways to define watersheds; generally topography is used because water follows gravity and flows downhill. One can use topographic maps, analyze digital elevation data with a geographic information system (GIS), or use established hydrologic unit maps.
The map on the left shows the hydrologic regions in the state that more or less fit the hydrologic watershed boundaries that are derived from the terrain. The largest watershed is the Sacramento and San Joaquin River watershed; there are parts of the watershed that do reach into Oregon. The Tulare basin and the San Joaquin Valley is well defined, but there are other areas like on the Central or North Coast that consist of many, many small watersheds that drain water to the Pacific Ocean.
The map on the right shows the major hydrologic regions in the United States that the USGS derived by using digital elevation models and terrain information. Each region has a hydrologic unit code; California is hydrologic unit region 18. Those hydrologic units have been further into 222 subregions, 352 accounting units, and 2,150 cataloging units. The hydrologic units were established to provide standardization for retrieving and exchanging hydrologic data.
Components of a watershed
There are many watershed attributes and processes that impact both water quantity and quality in the watershed. The relationship between the volume of water that enters a watershed and the volume available in the lakes, rivers, and streams is affected by the storage capacity and transport within the watershed, which in turn is determined by the evapotranspiration, percolation, losses to groundwater, and water diverted for human use.
Those components include:
Rivers and streams: Rivers and streams are usually described in terms of “stream order”, a designation of relative size. Streams can range from a first-order stream which are the smallest and have no tributaries to a 12th-order stream, which is the largest. There are a number of parameters that vary according to stream order, such as the relative abundance of species, nutrient and oxygen concentrations, the composition of the substrate, and velocity. Click here to learn more about stream order.
Lakes and reservoirs: Lakes and reservoirs are often used as water supply sources, receiving water from all other sources in the watershed, such as precipitation, runoff, discharges from tributaries, and upstream reservoir releases, and consequently, the water quality in the lakes and reservoirs is generally indicative of the condition of the watershed.
Topography: The topography is the physical surface of the watershed and includes both natural and manmade features. Topography is often described in terms of slope, aspect, and elevation which affect the movement, storage, and quality of water in the watershed. Topography also affects factors such as the intensity of solar radiation, the amount of precipitation and runoff, evaporation, sediment, and the type of vegetation present.
Geology and geomorphology: Geology is the composition, structure, and physical characteristics; geomorphology refers to the processes and mechanisms that created the geologic features. This is important for understanding things such as the relative composition of ionic constituents, conductivity, the permeability of the streambed, and sediment transport and deposition.
Soil: The composition of soil in the watershed determines how much rainfall or irrigation water will be retained in the soil gradually percolate downward, or whether it will add to surface water runoff and lead to increased erosion. Soil also influences the type of vegetation in the watershed.
Vegetation: Vegetation is important for intercepting runoff and allowing some or all of it to filter into the soil or return to the atmosphere through evaporation. Vegetation also improves water quality by stabilizing soils, absorbing nutrients, and filtering out sediment before the runoff reaches the river or stream.
Wildlife: The wildlife in a watershed can affect water quality and is sometimes associated with an increased potential for pathogens.
Land use: Land use can have a big impact on water quality. Land use activities include “working landscapes” or areas managed for agriculture or timber harvest; urban and residential areas; publicly and privately owned lands, and reserves.
Water budgets
 A water budget describes the flow of water in and out of the watershed, and the change in storage as a result. In general, a water budget works quite similar to a bank account. In order to balance the water budget, the inputs and outputs have to be balanced. Dr. Dahlke noted that with shorter time scales such as a month, the water budget might not be balanced, but over longer time scales, often inputs and outputs are roughly equal to each other.
An understanding of the water budget and the underlying hydrologic processes is essential for effective water resource and environmental planning and management. Water budgets provide a basis for assessing how a natural or human-induced change in one part of the hydrologic cycle may affect other aspects of the cycle.
Often, the more detailed equation is used which distinguishes the inputs and outputs, with precipitation being the main input and outputs being evaporation, flows to groundwater aquifers, and streamflow out of the watershed.
 California receives about 200 million acre-feet of precipitation on average on an annual basis. The majority of the water (125 million acre-feet) leaves in the form of evapotranspiration, which is water turning into water vapor and being returned to the atmosphere. That leaves about 75 million acre-feet of water that is stored in the soil, rivers and streams, snowpack, or percolation to groundwater.
Most of that precipitation falls in the northern part of the state along the North Coast and in the Cascades; about 20% of the land surface area of the state of California produces about 66% of the runoff. There is a lot of variability in the timing; the precipitation occurs during the winter months with long periods of the year with little or no rainfall. In very wet years or during extreme events, there can be flooding.
There are three ways water is stored in California; not all precipitation that falls as rainfall immediately flows out to the ocean. Some of it is stored as snow in high elevation areas; on average, Dr. Dahlke said it’s about 15 million acre-feet, so it’s quite substantial. Reservoirs store about 43-45 million acre-feet and then the rest of the water is either stored in the soil or in aquifers.
Learn more about water budgets by clicking here.
Water balance components
Next, Dr. Dahlke discussed the individual water balance components and how they are measured or estimated and the role they play in the water budget.
Precipitation
One of the main input parameters in water balance calculations is precipitation which can occur in liquid, solid, or even vapor. Measuring precipitation is important as it’s one of the fundamental parameters used in water balance calculations and models.
 Although there are methods such as weather radar that can measure precipitation amount, the most common method is the extensive network of rain gauges that has been established throughout the United States. The most common tool is a tipping bucket rain gauge as shown on the picture on the upper right of the slide; it has a compartment that fills up with water and then when a certain volume is reached, it then tips over, and with every tip, a certain amount of precipitation has been measured.
Dr. Dahlke cautioned that precipitation measurements are highly uncertain; as precipitation intensity increases, it often is accompanied by winds, so as the rains are stronger and winds increase, the precipitation is now coming in at an angle and that reduces the effective catch area that the rain gauge has, so with higher rainfall intensities, the accuracy of most rain gauges degrades as the true amount of precipitation isn’t captured.
 Scientists have spent a lot of time understanding the processes to improve the accuracy of rain gauges used to measure precipitation. They’ve developed empirical methods to correct for the under catch in situations where there are wind speeds and rain falling at an angle.
“If you know what rain gauge type you’re using locally to measure precipitation, you can identify your rain gauge and estimate with the table how much it is undercatching,” said Dr. Dahlke. “You can then also apply one of these equations, if you have wind speed measured nearby to correct your observed precipitation data. The rule of thumb among engineers is that if you have precipitation data, you add about 13% to it. That is roughly catching what most precipitation gauges underestimate.”
Snow
 A lot of snow falls in the mountains, but measuring snow is not easy. Snow is water plus air, and the air component is very important. Snow can be fluffy or heavy with water, and this is different with every storm, which is why how much liquid snow is going to produce is challenging to predict.
The two most common methods of snow measurement are:
Snow depth: This measures snow depth and the weight which is then converted to a snow water equivalent, or the volume of water the snowpack really has.
Snow pillows: It’s like a big scale in the landscape and it just measures the weight of the snowpack that sits on top of it. By measuring the weight, you also measure the volume because we do know what the density of water is at a certain temperature.
There are emerging techniques for better measuring snow using gridded data measured with satellites. At UC Santa Barbara, they have developed a reconstructed SWE dataset from MODUS remote sensing data which is helpful information when spatial variable snow data is needed for larger watershed models.
Precipitation variability
 Precipitation in California is highly variable which is important, given how crucial it is to water resources in California. The graph from a paper by Dr. Mike Dettinger with the USGS that was published in 2011. It shows the coefficient of variation of total precipitation in the United States which is a measurement of how variable the precipitation is; the lighter yellow and pink colors mean precipitation is less variable; the darker the color, the higher the variability.
“Here in California, we have all kinds of colors and it shows you we have the most variability in precipitation, so year to year as well as within each year, compared to any other region in the United States,” said Dr. Dahlke.
 In California, the majority of the precipitation arrives during the winter in just a handful of days. It takes about 10 to 15 days of precipitation to receive the annual average; less than 10 days of precipitation means a lot less precipitation. About 20 to 40% of the annual precipitation comes from atmospheric river events where it rains heavily for two to three days in a row, so if we don’t get one of the atmospheric events, it can mean 20-30% less rain in our total annual precipitation.
Evapotranspiration
Evapotranspiration is another component of a water budget. Evaporation refers to the amount of water lost to the atmosphere from ground surfaces; transpiration is the process of water movement through a plant and its evaporation from aerial parts, such as leaves, stems and flowers.
Methods for estimating evapotranspiration:
 Penman-Monteith method: The most common method, the standard method used by the American Society of Civil Engineers is the Penman-Monteith method which measures all of the energy balance components, such as net solar radiation, wind speed, humidity, air temperature and even carbon dioxide fluxes over a grass surface.
Satellites are also able to measure ET from space which can help predict if there is plant stress or a shortage of soil moisture in certain areas.
 Hargreaves-Samani: This is an empirical evapotranspiration method that has been developed over the years. It does not need the extensive energy balance sensors that the Penman-Monteith method needs; it mainly needs temperature measurements.
The California Irrigation Management Information System provides hourly evapotranspiration estimates in inches that have been derived with various energy balance stations within the state of California. The map here the distribution of CIMIS stations across the state.
“It really helps farmers making decisions on how much irrigation they need to apply in the summer to grow a certain crop, and so if you’re nearby one of those stations, I highly encourage you to take a look at the CIMIS network and see what useful information it has,” said Dr. Dahlke.
Streamflow
Another component of the water balance is streamflow, which is generally considered the flow of water in the streams, rivers, and manmade channels. It can also be called channel runoff. The word discharge is similar, but refers to a measure of water volume over time.
 With streamflow, scientists often work with hydrographs, which is a plot of discharge of the stream with discharge or water channel depth on the y-axis and time on the x-axis.
“Hydrographs provide a means for us to assess how a watershed responds to rainfall input, so if it rains, how much runoff is there actually occurring and how is rain translated into runoff,” said Dr. Dahlke.
The map on the right shows some of the major watersheds that drain into the Central Valley, which is where most of the surface water originates in California.
“Some of it is flowing out into the Sacramento-San Joaquin Delta, but particularly here for the southern regions of the Central Valley, actually more or less all of the streamflow that’s coming from the mountains is stored in reservoirs and then later used for irrigation or domestic or industrial uses,” she said.
 The term ‘hydrologic regime’ is used to describe the variability in discharge throughout the year from season to season as well as from year to year, because we often see changes in discharge due to changes in precipitation inputs, transpiration, evapotranspiration, or temperature changes, and even climate change.
“If we look at a typical hydrograph over the year, you often will see certain responses from the watershed,” said Dr. Dahlke. “For example, when we get into the rainy season, you will see an increase in streamflow often in many watersheds because ET evapotranspiration is going down in the winter and more of the precipitation is being absorbed by the ground and watersheds. Eventually, soils may even saturate and they can’t absorb more water and in that case, more and more of the precipitation that is falling will directly run into rivers and lakes.”
The hydrograph on the slide is an annual hydrograph of the Trinity River. She noted that there will be a different hydrograph depending on whether it is a wet or dry year. “We have a highly variable climate here in California and during a dry year, which is shown in the thin line, you might see barely any streamflow response from your watershed because most precipitation is just absorbed by the soil and not much is running off to streams. But during wet years, some of our watersheds can really produce a lot of streamflow to the extent that we have to concern ourselves about floods.”
Hydrographs are also used to do all kinds of calculations such as water supply, safety, the effect of certain management actions, and biologically relevant parameters, as well as estimating the risk of floods or droughts.
Flood Frequency Analysis
 Although drought is common in California, floods are also a major concern so streamflow measurements and hydrographs are used to predict flow values that correspond to specific return periods along a river. It is usually expressed as having the probability of occurring once within a specified number of years, such as a 100-year flood.
“What we can do is run a flood frequency analysis where we extract the maximum daily flow observed each year from the historic record,” Dr. Dahlke said. “We can then rank those annual maxima and fit a probability distribution to the data, and that can help us determine these return periods or probabilities of a certain flow event happening again in the future.”
The USGS recommends the Pearson Type III in Bulletin 17-B, but she noted there are other statistical functions that can be used.
 “How does this probability distribution help us? It can help us determine what is the probability that we see a certain extreme event, like a 100-year flood, occur again in the next 10 or 20 or 30 years. That information often is used by the Federal Emergency Management Agency to make plans for evacuation, for example, when there is a flood hazard occurring. It’s also used by the flood insurance industry to determine the risk that they will need to pay a homeowner a certain amount back if their house has been flooded by an event.”
The map on the right is of a floodplain and it shows the chance of flooding during a 30-year mortgage window. “What this translates to is the blue colors show the 100-year floodplain and the orange color shows the 500-year floodplain, so a home in the 100-year floodplain has a 26% chance of flooding over the course of the 30 year mortgage, and the home in the 500-year floodplain has a 6% chance,” she said. “So it’s then up to you to decide, do I want to buy flood insurance or not. And this is really just a statistical measure that we can calculate based on how often has this area been flooded in the past.”
Estimating runoff from a watershed
If there isn’t a stream gauge in the watershed, there are methods to estimate the runoff.
Rational Method
This common method estimates the peak discharge from the watershed, and although is not totally accurate, gives a good indication of peak discharge and so is widely used. The method needs only three parameters:
 Time of concentration which is the time required for a parcel of water to travel from the most hydraulically distant part of the watershed to the outlet. The most common method used to determine this is shown in the equation which relates the longest flow to the slope of the watershed: The steeper the slope, the faster flows out.
 Rainfall intensity is the ratio of the total amount of rain falling during a given period of time. Rainfall intensity is often higher for short duration events and longer for 24-hour rainfall events. The plot on the slide is for the Sacramento area; Dr. Dahlke explained that you pick the storm duration and how long would it have to rain to thoroughly wet your watershed, or where the storm duration is equal to the time of concentration of your watershed. You can then determine the precipitation intensity for that storm duration using one of the lines on the graph.
“The curves reflect different return periods because we can have rainfall intensities that are so high that do not occur very frequently but then others might occur more often, so we can have a 100-year return period on the rainfall intensity versus a 5-year return period, which is an intensity that would occur much more frequently,” she said. “The curves also consider rainfall intensity in inches per hour and the size of your watershed, because the larger your watershed, the more precipitation it can absorb and move out to the outlet.”
 A runoff coefficient which represents how much of the precipitation is absorbed by the ground or how much is running off immediately such as with a concrete surface that doesn’t really infiltrate any water. It’s expressed as a number that ranges between 0 and 1. The chart has various categories and the user picks the one that best fits the description of your watershed.
“In general, the rationale method is mainly used for small watersheds, small urban watersheds, but you can also use it for larger ones if needed,” she said.
NRCS Curve Number
 Another more sophisticated method is the NRCS curve number method which is used to describe typical watershed response from infrequent rainfall anywhere in the country, for watersheds with the same land use, soil hydrologic group, and surface runoff conditions.
The NRCS curve method also has three parameters: Precipitation inputs, watershed storage which is the ability of the watershed to absorb precipitation or to release it in the form of runoff and streamflow; and the curve number which is a number that varies from 0 to 100 with 0 meaning all precipitation is being absorbed and 100 means all precipitation is becoming runoff.
“This method is a little bit more sophisticated because, for example, it allows you to more clearly define different soil types in the watershed or a different land cover or there are management practices that improve the infiltration of your soil,” said Dr. Dahlke. “These are all factors listed here. They are reflected also in a table that lists the different curve numbers for different land cover types. If you have poor infiltration in your ground, you would have a higher curve number; if you have really good infiltration, you would see a lower curve number.”
 “The main effect often that we see when we make human alterations to the watershed, such as moving from a nicely pristine natural forested watershed to a developed one with more paved surfaces, concrete surfaces, and buildings is that we often see a speed up of the runoff response,” she said. “So peak flows are often higher in urban areas with the same amount of precipitation than they would be for a natural well vegetated watershed and all of that is actually reflected and considered in the curve number method so I encourage you to use this one instead of the rational method if you can.”
For more information on river conditions, she recommended the Department of Water Resources California Data Exchange Center or CDEC, and the USGS Water Data webpage which shows flow data for current stream gauges that are actively monitored.
Protecting water quality in the watershed
Both people and wildlife depend on the water in a watershed, but in order for this water to be useable for drinking, irrigation, transportation, and recreation, it has to be of good water quality, which is determined by certain physical, chemical, and biological characteristics of the water such as temperature, dissolved minerals and constituents, or the amount of pathogens that are present.
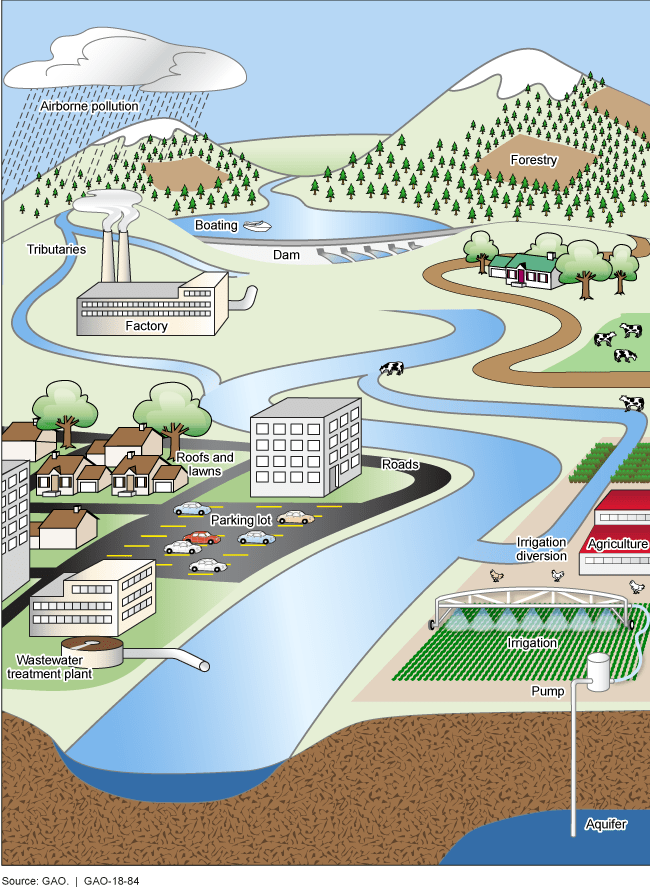
Sources of pollution in a watershed can be classified as either point source or nonpoint source pollution. Point sources are those that discharge to waterways directly from a pipe or other conveyance, such as the discharge of treated wastewater from a sewage treatment plant or a landfill. Businesses and industries often use hazardous materials in manufacturing or maintenance that are discharged from their operations and can contain solvents, petroleum products, of heavy metals. Point sources are regulated by federal and state agencies under the Clean Water Act through the issuance of permits that limit the types and amounts of pollutants a facility can discharge. There are also other laws and regulations that mandate the ways that hazardous materials are handled, stored, and used.
 These laws, regulations, and voluntary efforts have helped clean up major water quality problems by reducing the amount of pollutants directly discharged to surface water and groundwater; however, about one-third of the nation’s waters are still not meeting water quality standards, and nonpoint sources of pollution have been identified as the primary culprit.
Non-point source pollution does not come from a specific source. Instead, it originates from many places, or from a widespread area, such as urban stormwater runoff or agricultural fields. It is often difficult to trace the exact origin of these pollutants because they result from a wide variety of human activities on the land as well as natural characteristics of the soil, climate, and topography. Nutrients, microorganisms and toxics are some of the most common contaminants, as is sediment, which can contaminate drinking water supplies or silt in spawning grounds for fish and other aquatic species.
During precipitation events, water quality is usually impacted because as rain flows over impervious surfaces such as pavement or roofs, it can’t soak into the ground so instead, the water flows across the landscape, picking up any trash, debris, pet droppings, pesticides, oils, and other contaminants along the way and dumping it all into the nearest waterway. The first rain of the season, usually after several dry months, is especially toxic and can be particularly problematic for water quality and aquatic life in urban streams.
And it’s not just surface water quality that is impacted – groundwater can be impacted as well. The ability for these pollutants to reach surface water or groundwater is enhanced by the amount of water available from rain or irrigation.
Stormwater can also dump large amounts of nutrients from garden fertilizers, decaying organic matter, and pet waste into waterways. While small amounts of nutrients such as nitrogen and phosphorous can be beneficial for aquatic plants, too many nutrients in the water can lead to poor water quality and in turn, lead to outbreaks of harmful algal blooms. During extreme weather events, heavy rainfall or snowmelt can even overwhelm the systems designed to collect stormwater, domestic sewage, and industrial wastewater, causing the sewer system to overflow into nearby bodies of water.
However, there are components of a watershed that work to improve water quality, such as trees and other vegetation that naturally filters out soil and sediment.
Watershed planning and management
Historically, management of the environment has focused on specific issues such as air pollution or water quality, and these efforts have resulted in significant successes such as decreased air pollution, cleanup of contaminated groundwater, protection of species, and best management practices to control contaminant runoff. However, water quality impairments persist, a result of nonpoint source pollution and habitat degradation, which are complex problems that can cross multiple agency jurisdictions and responsibilities. Tackling these problems means stakeholders must come together to better understand the different facets of the problem and the actions that can be taken to improve conditions in the watershed. Watershed management is the process of developing and implementing programs and projects to restore, sustain, and enhance the watershed functions that provide the services and values desired by the residents of the watershed. The primary objective of watershed management is to sustain and increase the watershed’s ability to provide for the needs of the community that depends on it, including the local, regional, state, federal, and tribal stakeholders. Community-based watershed management has emerged as the most effective framework for protecting water resources as these organized efforts serve as forums to bring together diverse stakeholders into a process that can benefit all of the participants.
Watershed planning and management focuses on the whole watershed in order to protect both water quality and water quantity. Effective management recognizes all of the mutually-independent interactions of the various elements of the watershed system, including the hydrologic cycle, nutrient cycling, energy flows, geologic characteristics, and ecology, as well as the role of large scale disturbances, such as flood or fire.
Planning and managing on a watershed scale produces numerous benefits, such as more reliable water supplies, lower water treatment costs, reduction of flood risk, drought mitigation, protection of habitat, nutrient cycling, carbon sequestration, maintaining biodiversity, and recreational opportunities. These are often referred to as ecosystem services.
The watershed planning process involves a number of activities that include identifying priority problems in the watershed, promoting a high level of involvement by all stakeholders, developing solutions, and measuring success through monitoring and other data gathering. The goal of watershed management is to plan and work toward an environmentally and economically healthy watershed that benefits all that have a stake in it.
One step farther: Integrated Regional Water Management
Integrated Regional Water Management (or IRWM) is an effort by the Department of Resources to support the implementation of water management soltuions on a regional scale that increase regional self-reliance, reduce conflict and manage water to concurrently achieve social, environmental, and economic objectives. IRWMs integrate all facets of water management including supply, water quality, wastewater, recycled water, floodwaters, and stormwater management.
Integrated planning involves local agencies, interest groups, and stakeholders who work together to coordinate planning activities across jurisdictional boundaries to achieve mutually beneficial solutions. This approach delivers higher value for investments by collaboratively developing sustainable solutions that provide multiple benefits including improved water quality, restored and enhanced ecosystems, resilient forests, better flood management, and more reliable surface and groundwater supplies.
-
- Watershed Management: A Resource Management Strategy, from the Natural Resources Agency
- Integrated Regional Water Management, webpage from the Department of Water Resources
- IRWM Roundtable of Regions, webpage for the consortium of representatives from Integrated Regional Water Management (IRWM) Regions around the state.
Featured image credit: Ojai Valley by Daniel Pouliot

