

Graham Fogg covers the fundamentals of groundwater, including different types of overdraft, sustainable yields, and basin salt balance, as well as debunks some groundwater myths
 In September of 2014, Governor Jerry Brown signed historic legislation designed to strengthen local management and monitoring of the state’s groundwater basins. The legislation was a package of three bills: AB 1739 by Assemblymember Roger Dickinson and Senate Bills 1168 and 1319 by Senator Fran Pavley, that establish a definition of sustainable groundwater management, require local agencies to adopt management plans for the state’s most important groundwater basins, prioritizes groundwater basins that are currently overdrafted, and sets a timeline for implementation. Additionally, the legislation provides measurable objectives and milestones to reach sustainability and defines a state backstop of limited intervention when local agencies are unable or unwilling to adopt sustainable management plans.
 At the same time, exceptionally dry conditions mean farmers and communities are relying on groundwater basins more than ever. Against the backdrop of new groundwater legislation and the drought, the UC Davis California Water Policy Seminar Series begins its third year with a focus this year on groundwater. In a series of nine presentations, policymakers, hydrologists, legal experts, economists and water managers discuss California’s management of groundwater – its past, present and future. As with the two previous years, Maven’s Notebook will be covering the series, running one presentation per week for the next nine Thursdays.
Kicking off the series with an overview of groundwater is Graham E. Fogg, Professor of Hydrogeology at UC Davis. He began by saying he would be using a lot of pictures in his presentation because it’s key to understanding groundwater. “It’s not what you think it is in a lot of cases,” he said. “The systems don’t look the way you think they look.”
 He presented a slide depicting water use and supplies from the 2014 California Water Plan, explaining that applied water use is on the left and dedicated and developed water supply is on the right. He noted that the groundwater is shown in crimson. “If you take out the in-stream environmental here basically, the groundwater portion accounts for, anywhere between 20 and 50 to 60% depending on the year.”
 Groundwater use varies with area, he said. “It’s a very high percentage in the Colorado River Basin, for example, while in the Sacramento Valley and the San Joaquin Valley, it’s a bit lower. Up on the north coast, only those communities and people who depend on it locally.”
 California is the champion of all the states in groundwater pumping, he said. “How can we use so much groundwater?” he said. “How is it we use so much groundwater in California compared to Texas? Texas is a bigger place, it’s got bigger aquifers, the permeability of those aquifers is not nearly as high as in California. But how is it California pumps so much groundwater? The overdraft is worse in some states than California.”
“The answer is that the water we pump from groundwater ultimately comes from snow,” he said. “We have a snow pack, and we use that snow pack; we store it and we irrigate. We irrigate like crazy in California, especially, compared to these other places. So, it’s our surface water management and irrigation and groundwater management that results in such a huge groundwater productivity in the state, for better or for worse.”
“It is a myth that more efficient irrigation will always result in more water,” he said. “More efficient irrigation results in less groundwater recharge and less ability to pump groundwater. It’s a zero sum game. This is another subtlety about groundwater/surface water management.”
 There are a lot of public wells in California which tend to be where the major aquifers are, he said. He noted that the slide shows wells that serve 25 connections or more. “It’s hard to know exactly how many, public water supply wells,” he said. “There are about 20,000 to 35,000 public supply wells.”
 There are many more private wells than public wells, he said. “They’re not mapped, managed, monitored, or regulated,” he said. “According to the 1990 census data, they estimated about 450,000 private wells. I’ve seen other estimates that estimate over a million private wells. These are mainly household wells; they’re shallower wells.” He noted that the map shows parts of the state where there are no wells, but that would not be the case. “There would be some private wells out there, but not good control on how many. The best estimate that I would go with at this point is on the order of a million private wells in California.”
 The occurrence of groundwater is dictated by geology, he said, presenting a geologic map of California. “The yellow and pink are the major aquifer materials in California,” he said. He noted that the alluvial valleys are shown in yellow and the volcanic are in pink. “The volcanics are hard rocks, but they’re relatively permeable. .. Not much is known about the volcanics up north, but a fair amount of groundwater is there.”
 In the Central Valley, the groundwater is found in the sedimentary materials, such as sand, silts, gravels, and clays. In the harder rock terrains such as the granites of the Sierra Nevada and the volcanics, the groundwater is found in fractures and other openings in the rocks. “There’s groundwater everywhere, but the groundwater in the mountains where the granites dominate is much, much less permeable than the materials in the Central Valley by a factor of 100 to probably 100,000, something like that,” he said. “Nevertheless, there is groundwater there.”
 He then presented a picture of Newberry Crater in Oregon as en example. “This is a recent lava flow, and you could possibly tell from the crinkly texture that there’s a fair amount of porosity or ability for water to move through something like this. These volcanic deposits could be quite prolific in terms of the permeability. … These may play an important role in mitigation of loss of snow storage under climate change. Just the groundwater in the mountains can serve as an interim storage mechanism for water.”
 The Central Valley is key in terms of California’s water use, Mr. Fogg said. “It’s the key aquifer; it’s one of the biggest aquifer systems in the world,” he said.
He presented a slide of the sediments in the Central Valley and noted that the recent sedimentary deposits are shown in orange. “In the Tulare Lake Basin, the thickness of these materials is up to 9,000 feet, so they are quite thick materials.”
 He presented a slide with cross-sections of both the Sacramento Valley and the San Joaquin Valley, noting that there are thicker sediments in the San Joaquin Valley. He pointed out that there are a lot of generalized pictures where it’s all brown or white or yellow, but it’s much more complicated than that. “These materials in the Central Valley arrived through erosion from the mountains and deposition by alluvial fans. An alluvial fan is formed when a river flows out of the mountains and deposits sediments in the shape of a fan, and that’s how much of our aquifer system in the Central Valley was built,” he said.
 He then presented a slide of the Kings River alluvial fan, and noted that it is a low relief alluvial fan. “If you look at a photograph of it, you’d hardly know it, but this river has fanned across this alluvial flood plain for some 1.5 million years.”
 He then presented another depiction of the San Joaquin Valley and Sacramento Valley groundwater system. “I’d like to give you a feel for what are these materials really like,” he said. “You see a lot of pictures like this where it’s all blue and there’s these little lenses; those are to indicate clays. People look at these enough, and they get the idea that the system here in the Central Valley is really like that; it’s actually nothing like that. Sometimes, it doesn’t matter. In a lot of cases, it does matter and as we get deeper into groundwater management, it matters in a big way. I’ not saying it’s wrong, but this is a generalized depiction and it behooves us to look in more detail at it.”
 Presenting a slide of a groundwater system from the California Water Plan, he said that if you looked at these long enough, you’d think that’s the way the world is. “It’s not like that at all,” he said. “It’s almost precisely more like that without the lignite and the peat, but you’ve got rivers that deposited materials and deposited sand bodies, and these materials are not aquifer materials at all. If you look at this, you say, ‘Where’s the aquifer?’ There’s all these little lenses that are staying through here; it’s a network of these sand bodies.”
 Mr. Fogg said he and his students have spent the last 25 years looking at actual data of the materials that are in the subsurface from California and other places. He presented a model of materials beneath the Kings River alluvial fan. “Aquifers are the gravel and the sand; those materials are aquifer materials. Everything else – the green, the blue, the lipstick pink, whatever that is – those are non-aquifer materials. That is, these other materials store water, but they don’t transmit the water readily to wells, except over a long, long time frame.”
Mr. Fogg then presented several slides of different aquifer systems around the state, pointing out that each aquifer is different and is comprised of different combinations of materials.


 He then presented a model of the Davis aquifer system, noting that the aquifer zones are shown in red.
 “What does this look like in 3D?” he said. “It’s not a sand pile. It’s not a pile of gravel. It’s something more like this. These systems are not layers of layer-cake materials. They’re not piles of sand and gravel. It would be easier if they were, but also our whole system would be much more contaminated with contaminants if it were like that. It’s more like an interconnected network.”
Mr. Fogg said that he knows the systems are interconnected through the years of research by himself and Thomas Harter at UC Davis. “One consequence is that you get an integrated network of aquifer materials that behave in a very specific way,” he said. “It also makes them hard to recharge. It makes them somewhat protected from contamination but not totally protected from contamination, and it leads to a lot of other interesting and important side effects.”
 Conceptually, people tend to think of groundwater like a layer cake, but a better analogy would be the human body. “In the human body, you have fluids coursing relatively rapidly through veins and arteries; then outside the veins and arteries, it’s tissues. The tissues are mostly water also, and there’s lots of mass exchange between the tissues and the veins and the arteries. These aquifer systems in places like the Central Valley, or Orange County, Salinas, the Basin Range, are more like the human body, in terms of how the fluid moves and exchanges than the layer cake model would suggest.”
“This is also why I usually don’t refer to it as an aquifer,” Mr. Fogg added. “We don’t refer to the human body or the system that makes up the human body as the vein or the artery; it’s a system of veins and arteries and organs and tissues. So I refer to these systems as aquifer systems.”
“Just to make a point, yes, groundwater does move beneath our feet,” he said.
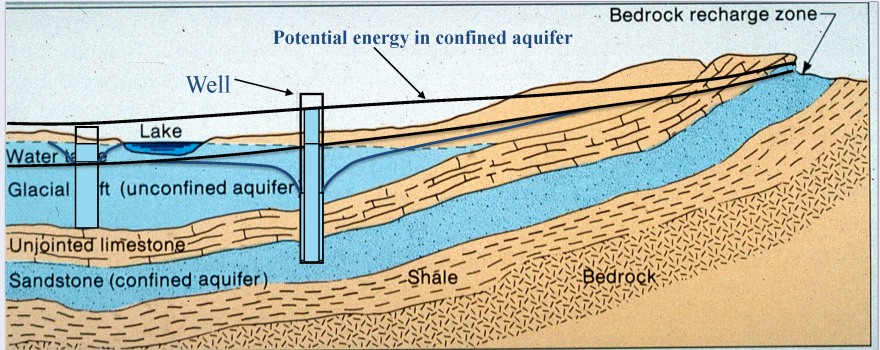
 An confined aquifer is one into which the water seeps down from the ground surface directly above it, while a confined aquifer is one where an impermeable layer exists that prevents water from seeping into the aquifer from the ground directly above. Instead, water seeps into confined aquifers from areas farther away where the impermeable layer doesn’t exist, Mr. Fogg said.
With confined aquifer systems, if you drill a well into the aquifer, the water level will rise to a level that’s higher than the top of the aquifer, he said. “This does happen quite routinely, where the potential energy surface or the pressure in the aquifer is high enough to push the water in the ground water system if you put a well there above the land surface. That’s how we get flowing wells, but there’s not as many of these as there used to be, because we’ve developed a lot of our ground water systems and those pressures are lower than that.”
 On terms of pressure, a confined aquifer is much like the plumbing in your house, Mr. Fogg said. “If it’s an old house, and there’s a pressure drop in the plumbing, such as when you’re taking a shower, and your room-mate flushes the toilet, the hot water decreases,” he said. “That’s a pressure response. So if pressure or water levels dropped in this confined aquifer, it might take only a matter of hours, days or weeks for that effect to go 20, 30 miles down into the system; it depends on the system. … That’s the concept of flow. In this same system, it may take 5,000 years for a molecule of water to get from there to there.”
When you’re measuring water levels in a confined aquifer, you’re not measuring the water table, but instead the pressure surface in the confined aquifer well, he said. “Changes in that surface don’t lead us directly to information on changes in groundwater storage,” he said. “Let’s say that we develop that system and the water levels come down. If we pump this well, the counter depression, we get a draw down cone. Water levels decrease; it extends far and wide.”
Mr. Fogg said when they ran a short term pumping test on wells in the Davis area for a class, in just four hours, the effects of that pumping test could be seen a half mile to a mile away; if they pumped for a week, it would go out for miles. “So these confined aquifer wells have a big effect. The aquifer stays full of water but the de-pressurization happens over a big area,” he said. “Water slowly drains and leaks from the recharge area and across the confining beds … and the water table slowly, slowly declines, but the water table changes very little.”
In a confined aquifer system, the entire system are these inter-bedded, interconnected sand bodies and gravel bodies, so it’s a myth that pumping old fossil water is a non-sustainable practice, he said. “People think, ‘Okay, if the water I pump here is 3,000 years old then the water coming out of the tap here is 1,000 to 3,000 years old on average.’ It is. The logical thinking then is, ‘If that water is 3,000 years old, it must take 3,000 years for it to be replaced.’ And the answer to that is no – that’s incorrect. If we say the ocean water is 3000 years old, and we remove some ocean water from the oceans, is it going to take 3,000 years for that water to be replaced? Well, no. It’ll come into the ocean somewhere else. If we take water here that’s 3,000 years old, it will be replenished in terms of its potential energy or it pressure or water level while water is coming in here or leaking through the confining beds.”
“So don’t let anyone tell you that if you’re pumping old fossil water, that it is a non-sustainable practice,” Mr. Fogg said. “Marc Reisner made the mistake in Cadillac Desert. A lot of people take this lay person’s approach to groundwater and take it in a direction that is not appropriate.”
 He then presented a map of the thickness of the sediments in the Central Valley, noting that it’s about 2000 feet in the northern part of the valley and gets thicker in the southern part of the valley, up to 9000 feet in the Tulare Lake Basin and further south. “Below this are mostly marine rocks that were deposited with salt water in them so, inherently, they tend to have a poorer water quality, but typically a third to a half of these materials have fresh water in them,” he said.
 He next presented a map of the thickness of the aquifer that is saturated in fresh water, noting that it shows about 2000, 2500 feet of fresh water in the system down toward Modesto as well as quite a thick deposit of freshwater in the Tulare Basin.
Below the fresh water is the saltwater, which is one of the mostly unrecognized potential problems with over production of ground water, he said. “If you pump too much of the fresh water, you start pulling up salt water. That’s something that, as far as I know, is not happening appreciably yet. It’s something you don’t want to mess with because when it does happen, it’s hard to reverse the effects of that,” he said.
 He then presented a schematic of the Central Valley groundwater system, noting that on the bottom, the old saline water is depicted. “In reality, about half the system in the bottom part of it is salty water,” he said. “The rocks may not be as permeable down here, but still it’s a thick sedimentary system and over production of the fresh water can pull up this saltwater.”
So what is overdraft? “Overdraft is pumping more groundwater than the system can sustain,” he said. “It is not pumping more groundwater than the recharge. Sustainable yield of groundwater does not equal recharge. It’s a more complex base in response to that. So that’s why the wording here is kind of precise. It’s more groundwater than the system can sustain.”
 Whether or not the pumping is sustainable is determined by this list of consequences, which are subjective, Mr. Fogg said. Those consequences include non-sustainable storage depletion, subsidence, surface water & ecosystem effects, increased energy costs, bad water intrusion from aquitards and from depth, seawater intrusion, and basin salt imbalance. “Basin salt imbalance is the only groundwater problem that scares the hell out of me,” he said. “All these other ones, I’m really concerned about, but they don’t scare me like this one does.”
 He then gave some examples, starting with groundwater overdraft trends in the Central Valley. “This one is obviously the non-sustainable storage depletion,” he said. “This is from groundwater level measurements and models showing the groundwater loss.” He noted the decline in the Tulare Basin and the Central Valley overall, but also pointed out that the Sacramento Valley, the Delta and east side streams have not seen the same declines. “So the entire state is not in a crisis,” he noted.
 There are crisis locations and the Tulare Lake Basin is certainly one of them in terms of groundwater overdraft, he said. He presented another depiction of the cumulative groundwater depletion, and noted that this is from USGS and GRACE satellite data. “You may not really see an effect of the drought because they were pumping like crazy in the Tulare Lake Basin well before the drought,” Mr. Fogg said. “The amount of depletion here amounts to something on the order of one to 1.5 million acre-feet per year.”
“Subsidence is like a patch of those clays and silts; we have plenty of them in the Central Valley, so in most places in the Central Valley, there is a lot of potential, for land subsidence,” he said. “Basically, you squeeze the water by de-pressurizing the aquifer out of the clays and silts and that causes the land surface to subside. … Sometimes, some of the subsidence is from gas production, or oil and gas production.”
 He then presented the classic photo of Joe Poland standing by the telephone pole in the San Joaquin Valley, noting that the picture, taken in 1977, shows about 10 meters of subsidence around Mendota in the Central Valley. “This is one of the things of course that prompted importation of surface water through the State Water plan and to some extent through the Federal water projects, the Central Valley project,” he noted.
 Presenting a graph of depth to water in Mendota, he noted that the black line denotes groundwater levels and the blue line depicts vertical displacement in feet. “There is measurable displacement as the groundwater level drops down, in this case, they re-induce subsidence,” he said. “And there’s been quite a bit of subsidence measured in the Southern San Joaquin Valley or the Tulare Lake Basin, especially during this recent spate of increase in groundwater pumping.”
This is a problem because it can destroy railroads, pipelines, and canals, he said. “Some of the canals that distribute water for the various water projects don’t incline any longer in the direction that would allow the water to drain in the direction it should, so drainage is a problem,” he said. “It can affect roadways, buildings. In the Houston-Galveston area of Texas, it’s reactivated faults. These faults have destroyed portions of neighborhoods and buildings.”
 Overpumping of groundwater can lead to surface water and ecosystem effects, he said. “If you pump a lot of groundwater, you eventually start taking water out of the stream,” he said. “Any amount of ground water pumping ultimately has some effect on some surface water. In many cases, you might be pumping enough groundwater or a small enough amount of groundwater so that the effects are minimal. That’s what we often see. But it’s very hard to have any groundwater production that does not have some effect on surface water.”
 He then presented a slide with a visualization of how California might have looked 100 years ago, pointing out Tulare Lake in the Central Valley, as well as the wetlands and riparian zones. “Of course, there’s no Tulare Lake, and people say, ‘Well, it was drained for irrigation.’ Well, that was part of it, but another big part of the reason the lake disappeared was, we pumped enough groundwater that the lake was no longer got fed by groundwater, and that’s true of many of our surface water bodies, and wetlands up and down the Central Valley.”
Increased energy costs are another impact, as the deeper the groundwater is pumped, the more energy it costs to bring it to the surface. “I heard that people are experimenting with solar power for groundwater pumping,” he said. “I haven’t heard as to whether you can pump at a high enough rate. A lot of these irrigation wells are pumped 2000 gallons or 3000 gallons a minute. I don’t know if solar power would handle that. If it would, that would be great.”
Bad water intrusion from aquitards and from depth is another impact that is not well-characterized, but it’s scary – one he’d rather avoid see happening, he said. “The fresh water is not all fresh water in this big bathtub,” he said. “Below this fresh water is non-potable saline water. Fresh water by this definition for this kind of mapping is anything less than 1000 parts per million total dissolved solids. … If you exploit too much of this freshwater, even though we’re not on a coast, there could be in essence ocean water intrusion from below if you over-produce the system.”
“At what point that happens? We haven’t done the analysis,” he said. “It requires data and a type of modeling analysis that has not been done.”
Aquitards are the non-aquifer materials, like these clay-ey or silty materials, and as you go deeper in these materials there’s water in there, he said. “In many cases, we find as you go deeper, the total dissolved solids or the quality of the water in these fine-grain non-aquifer materials gets worse. But we can’t sample water from these to figure out what the water quality is. It is reasonable to assume that the quality of water of these non-aquifer materials gets worse with depth, because the water turns over much more slowly the deeper you go.”
He said it’s hard to know where the poorer water quality is. “If you over-produce it and start pulling in too much water from a non-aquifer materials, that can also degrade the water quality,” he said. “It’s something you don’t want to explore through over-pumping of the system and then find out what’s happened when it’s too late.”
 “The one that scares the hell out of me is the basin salt imbalance,” he said. He noted that the figure shows water levels in the Central Valley, and pointed out the arrows in the southern San Joaquin Valley and the Tulare Lake Basin. “The arrows are pointed inward towards a pumping center, so essentially all the groundwater in that area is exiting through wells there,” he said. “There’s no water exiting through natural outlets in the basin. Down here in the Tulare Lake Basin, there’s no natural outlet for the groundwater. In the past, it’s questionable whether there ever was, but it appears that there was some groundwater exiting into the Southern San Joaquin Valley. This is important because when the hydrologic basin loses its outlet, you risk salinating the basin.”
 “Why is Mono Lake salty? Why is the salt in the sea salty? There’s no outlet except for evaporation,” Mr. Fogg explained. “If you over-exploit a groundwater basin, the water levels are down and basically the only exit for the water is the wells. A lot of irrigation there so the water’s applied for the land. What happens when that water evaporates? The salts are left behind. So you set up a closed basin by overdrafting it and there’s no longer an exit for the salts.”
“This is one of those things that is insidious and so bloody slow that we’re not paying attention to it,” he said. “There are people working on the salinity problem, but the long-term salinization for a groundwater basin is something that we haven’t really started to calculate and model carefully. … The problem is that the consequences unfold on a time scale of decades to centuries. … This is a thing where over long time periods you could essentially destroy the water resource.”
 Sea water intrusion into coastal aquifers is another impact of overpumping groundwater basins. “On the coast, we have sea water in the sediments along the coast line,” he said. “If we over pump, we bring in that salt water wedge to intrude. This has been happening in Salinas Valley, Orange County, and San Diego area.” He noted that in Orange County, they’ve been treating waste water, injecting it along the coast to keep the salt water out fairly effectively.
The groundwater quality is degrading in many systems, but most of the groundwater quality is still good, he said. “There’s a little bit of a dichotomy there,” he said. He explained that in any glass of water, the molecules of water are a mix of ages. “This is a general research result, and it’s widely accepted now in groundwater. If you look at the distribution of ages from that water sample, and let’s say the water is a little bit contaminated with nitrate, the portion that’s contaminated with nitrate is only the portion that’s young enough to have been affected by anthropogenic nitrate contamination. Our sources of nitrate contamination have only been around about 60 years so only the young fraction is contaminated.”
 “That’s good in that that contaminated groundwater is mixing with clean groundwater in aquifer system and in the well resulting in something that’s overall less contaminated,” he said. “But it also means that over time the fraction of water that’s contaminated is going to increase for this potentially to contaminate it. So if we see contamination in the groundwater today and that contamination’s from a persistent, non-point source, we can expect decades to centuries of worsening water quality.”
This is a big ongoing problem that we have to keep in the back of our minds when we talk about managing groundwater and the groundwater legislation, he said. “Fortunately, the legislation does have a groundwater quality hook in it that I think is very important. But the basic thing to remember is most of the fresh groundwater resources are hundreds to thousands of years old, yet most of the contaminant sources are 50 to 60 years old.”
Case study 1: The City of Davis
 He then turned to the local groundwater in the Davis area, presenting a chart with the number of wells with nitrate levels above the exceedance rate. “If you fit lines to these, you generally get a significant positive slope which is why the City of Davis has been drilling deeper wells,” he said.
 He then presented a graph of the wells at UC Davis, noting that the campus uses the deeper wells for drinking water and the shallower wells in the intermediate aquifer for utility water, such as landscape and lab water. He pointed out the city’s deep wells, which have mostly been drilled in the last ten years.
 “Here’s the interesting thing,” he said, presenting the graph of the water levels in the shallower, intermediate-depth wells. “Each of these cycles is a year, and so the water levels go down in the summer, recover in the winter or spring, go down the next summer. It is an ongoing cycle. As long as it’s not a drought, around here, our groundwater levels have declined a lot in the summer but recovered.”
He noted the last three years of drought on the graph. “We would normally say that Davis is not in overdraft, except for the drought. The water levels have been recovering. It’s in a sustainable state.”
 He then presented a graph of the City of Davis’ deep aquifer, noting that this is showing a decline that extends beyond droughts, a decline going back to 2008. He noted that other deep wells in Davis are showing a similar trend.
 He presented a graph of the campus drinking water wells that shows back to the 1990s. He noted that back in the earlier years, there weren’t non-sustainable trends of any great worry.”Over the last ten years, about when the city started pumping the deep aquifer, and look at the drop in campus water levels.”
“When the city started poking into the deeper aquifer, they and others at the campus came to me and said, “Can the deep aquifer handle it?” And I said, “I don’t know.” No one’s done a model of Yolo County yet that reliable enough for us to even test that and the monitoring data are ambiguous,” Mr. Fogg said. “You might not know until you start doing it, and I think we’re getting the answer in that.”
 He then presented a graph of UC Davis’ utility wells, and noted that there’s not much to speak of, except for drought effects in the shallower intervals. “So, is the system in overdraft? Sometimes data like this is all it takes, if it’s just a yes or no question,” he said.
Case Study 2: Coachella Valley Groundwater Systems: Work with Harvey O. Banks during 1987-96
 “I worked with Harvey who was wonderful to work with, for about eight or 10 years, and he hired me to do a model of Coachella Valley, which had a fabulous dataset,” he said.
 He presented a graph of the elevation of water level in a well going back to 1925. “They had groundwater levels going down; obviously, they were in overdraft, and they knew it,” he said. “They imported Colorado River surface water and started recharging it and using it for irrigation in lieu of groundwater. Water levels came back up. It took about 10 to 15 years to recover most of what had happened in the previous 30 or 40 years. And then as often happens, they started to exceed their sustainable yield again and conditions went in this direction. But this clearly tells them, what are the conditions that create overdraft or arrested or reverse, that’s the kind of information it takes.”
 Presenting a graph of a well in an unconfined part of the system, he noted that the trends through time tell a story of what the basins sustainable yield is. “The solid lines on the model are the simulated ebbs going back 60 years in a system from different parts of the basin, and this shows you that these models can be built and calibrated to become actually quite reliable as predictors, not mimickers, but predictors of changes in groundwater conditions.”
He noted that models are one way to try to figure out what portfolio of groundwater and surface water management actions would bring the basin into balance or cause it to go out of balance.
Summing it up …
Mr. Fogg then ran down his main points. “I covered the fossil water myth that 3,000 year old water takes 3,000 years to replace; I gave you the background to refute that,” he said. “Groundwater levels tell us how much ground water storage is changing, but in confined aquifers, it’s a pressure response, so we have to carefully translate that data into change in storage – it’s doable, but not that simple. That is one of the reasons we don’t have good cause and effect feedback between groundwater pumping and the effects of that pumping – the water levels in most of our wells are these false pressure surfaces in a confined aquifer. “The quality of most groundwater is degraded, and it’s debatable if good quality groundwater today is likely to stay that way.”
Another potential myth is that climate change will decrease groundwater recharge, he said. “In the Central Valley, the situation beneath the rivers is mostly that the water levels have been drawn down below the rivers. Previously, the groundwater sustained a lot of rivers, so a major source of recharge to the aquifer is the rivers,” he said. “So if we have earlier snow melt and higher winter stream flow, it’s possible that we’ll get more winter recharge to the groundwater from the streams. That’s one of these little hydrologic subtleties in response to climate change that just hasn’t been followed through on, yet. So it’s too simplistic to just say climate change means warmer temperature, more evaporation, and less recharge. Yes, in some areas, the coast ranges, especially. But in the context of something like this, there are counter-examples where it could go differently.”
“I better stop there; thank you very much.”
Discussion highlights
Mr. Fogg was asked, “When you were talking about the poor water quality intrusion from aquitards and from depth, you said that the analysis of where that might start to happen hasn’t been done in California. Have they done it elsewhere? Or have those methods just not been invented yet?”
“It has been done in a way, based on the screen sampling of input of things like arsenic and I think also uranium from certain intervals,” Mr. Fogg replied. “But the problem is, on a bigger scale, we don’t know much about the quality of the water in those materials with that. So, if we suck real hard on an aquifer system for 20 years, it may take that long to get an appreciable amount of water out of the fine grain materials. We don’t know enough about the water in those materials to project what the consequences will be. … So if the ratio of the amount of water being pressed out of clays and silts increases too much, there may be these unfavorable trends, but it’s really hard to predict. I don’t know that we’ll ever have the data to predict that so it’s one of those things. For me, it’s a reason to not over-exploit the basin. It’s one of those things you want to avoid.”
Mr. Fogg was asked how the maps of aquifers were generated.
“We take well log data where the driller logs the different materials, which are incidentally proprietary in California, so we can only get the data if we have state or federal funding,” he said. “It’s one of the ironies of working in California. Very open place, right? And sometimes you have physical log data, and in other cases, we’ve used surface geophysics to complement those, and those are the hard data. And then we build an interpretation of the origin of the deposit, the geologic processes are laid down, which help us sort of connect the dots. And the rest of it is stochastic, spatial, statistical method based on transition probability and mark off changes. So the mark off change represents the probability of transitioning from one material to the next, vertically or horizontally. And that builds into the system a very compact three-dimensional model of the spatial distribution. The software was generated here and we’re working on writing a book on it.”
For more information …
- Click here to view Graham Fogg’s full power point presentation.
- Click here to view the video for this presentation.
Coming next Thursday …
The California Water Policy Seminar Series continues with Tina Cannon-Leahy from the Assembly Committee on Water, Parks, and Wildlife; Cindy Tuck with the Association of California Water Agencies, and Kate Williams with the California Water Foundation discuss the sausage-making legislative process that was the creation of the Sustainable Groundwater Management Act.
For more from the California Water Policy Seminar Series …
This is actually the third year that Maven’s Notebook will be covering the series at UC Davis. Previous speakers have included John Laird, Mark Cowin, Felicia Marcus, Tim Quinn, Jay Ziegler, Ellen Hanak, Michael Lauffer, Ronald Robie, Harrison ‘Hap’ Dunning, Michael Rosenzweig and many more. You can access all coverage from all years in the archive here: California Water Policy Seminar Series Archive
![]()
Help fill up Maven’s glass!
Maven’s Notebook remains only half-funded for the year.
Click here to find out how you can help
