

 The nine-member California Water Commission has been given a number of responsibilities as dictated by the California Water Code; one of those is to conduct an annual review of the State Water Project, and report findings and recommendations to the Legislature. At the November meeting of the California Water Commission, staff from the State Water Project updated the commissioners with an overview of the Oroville spillway construction, a recent study of subsidence along the California Aqueduct, and the Department’s program to reduce greenhouse gas emissions.
OROVILLE SPILLWAYS CONSTRUCTION UPDATE
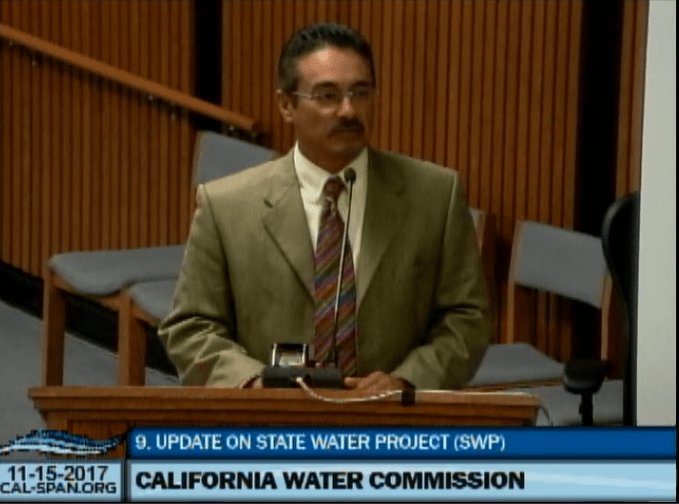 Joel Ledesma, Deputy Director of the State Water Project, began by noting that the construction accomplished on the main Oroville spillway is an engineering and construction phenomenal feat, crediting the efforts of DWR’s engineering forces, the regulatory bodies, the contracting folks, and the local community that came together to meet the November 1 deadline.
Phase 1 was completed by November 1, which included building a spillway that would be able to pass hundreds of thousands cfs for this winter in order to safely manage the reservoir, and to also have an operational plan that gave the same level of flood protection or better than what was in the original flood manual. The operational plan for the upcoming year allows them to hold the flood level at a significantly lower elevation than normal, and that, coupled with the hundred thousand cfs that they are able to pass through the spillway and the other facilities of the plant and the river outlet system, allows them to be able to provide the public safety that is needed.
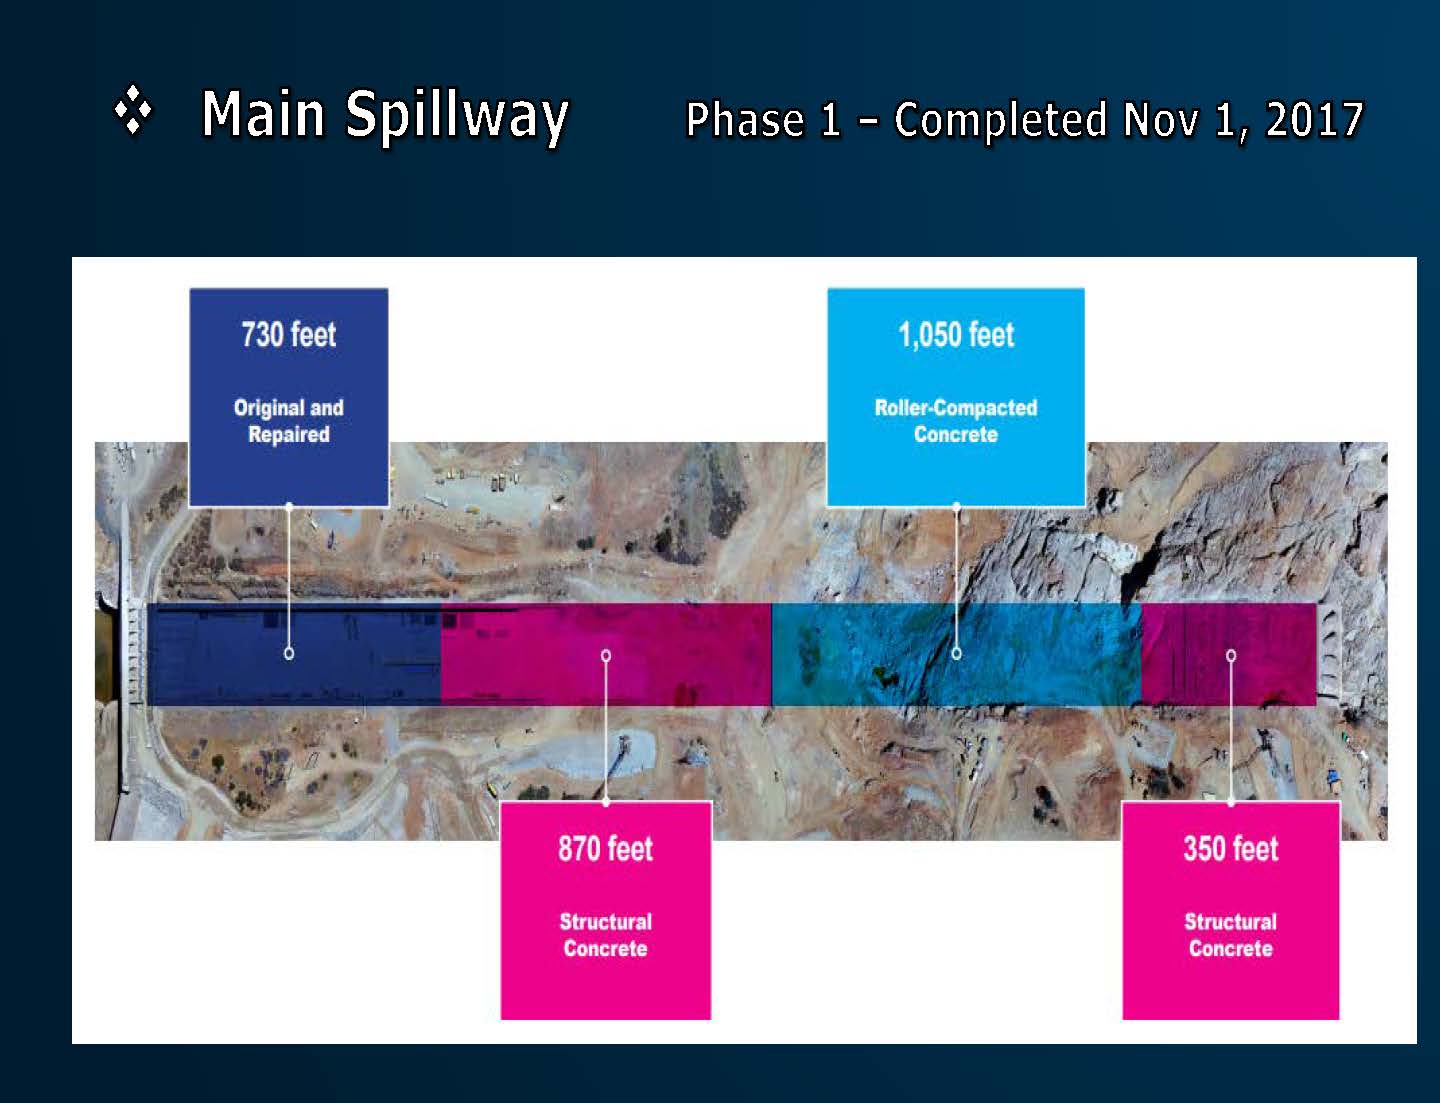 In Phase 1 (shown in the above diagram), the original 730 feet next to the outlet structure was determined to be in good enough shape after core drilling and inspections that they were able to do repairs to have it ready for this winter. The next section of 870 feet right above the scour hole was rebuilt that with structural concrete; it has foundation-leveling concrete, rebar, and structural concrete and has been completed. The next section of 1050 feet has been completed with roller compacted concrete as there wasn’t enough time to rebuild the entire spillway with structural concrete, so this portion was built with roller-compacted concrete as it can be done quickly. The bottom 350 foot portion has been demolished and completely rebuilt with structural concrete. All that work was completed as part of phase 1 by November 1st.


For Phase 2 (shown in the above diagram), the walls will either be taken down or portions cut out and then rebuilt with structural concrete; the part of the spillway that is currently roller-compacted concrete will be rebuilt with structural concrete, and the top portion next to the gate with be rebuilt with structural concrete. “Even though we accomplished a lot of work this year, next year we’ll have equal or greater work to do by next year, so by no means are we done or don’t have a lot of work next year,” Mr. Ledesma said.


The rebar in the walls is being built and connected into the chute rebar for extra strength; there is a lot more rebar being used then back in the 60s – there is 8,519,000 pounds of rebar being used in the spillway construction.


There was a roller-compacted concrete batch plant and a structural concrete plant located there at the dam site, so they were able to be really efficient in using the spoils and material that came off the spillway for aggregate and for the roller-compacted concrete; they were able to produce it there, haul it, dump it, and then use the equipment to level it out. Every 5 minutes, a dump truck would dump 21 cubic yards of roller-compacted concrete, essentially working 24 hours a day, 7 days a week.


There was enough structural concrete used in the spillway construction to pave a 5.5-foot sidewalk from Sacramento to Los Angeles. About 350,000 cubic yards of roller-compacted concrete was used.
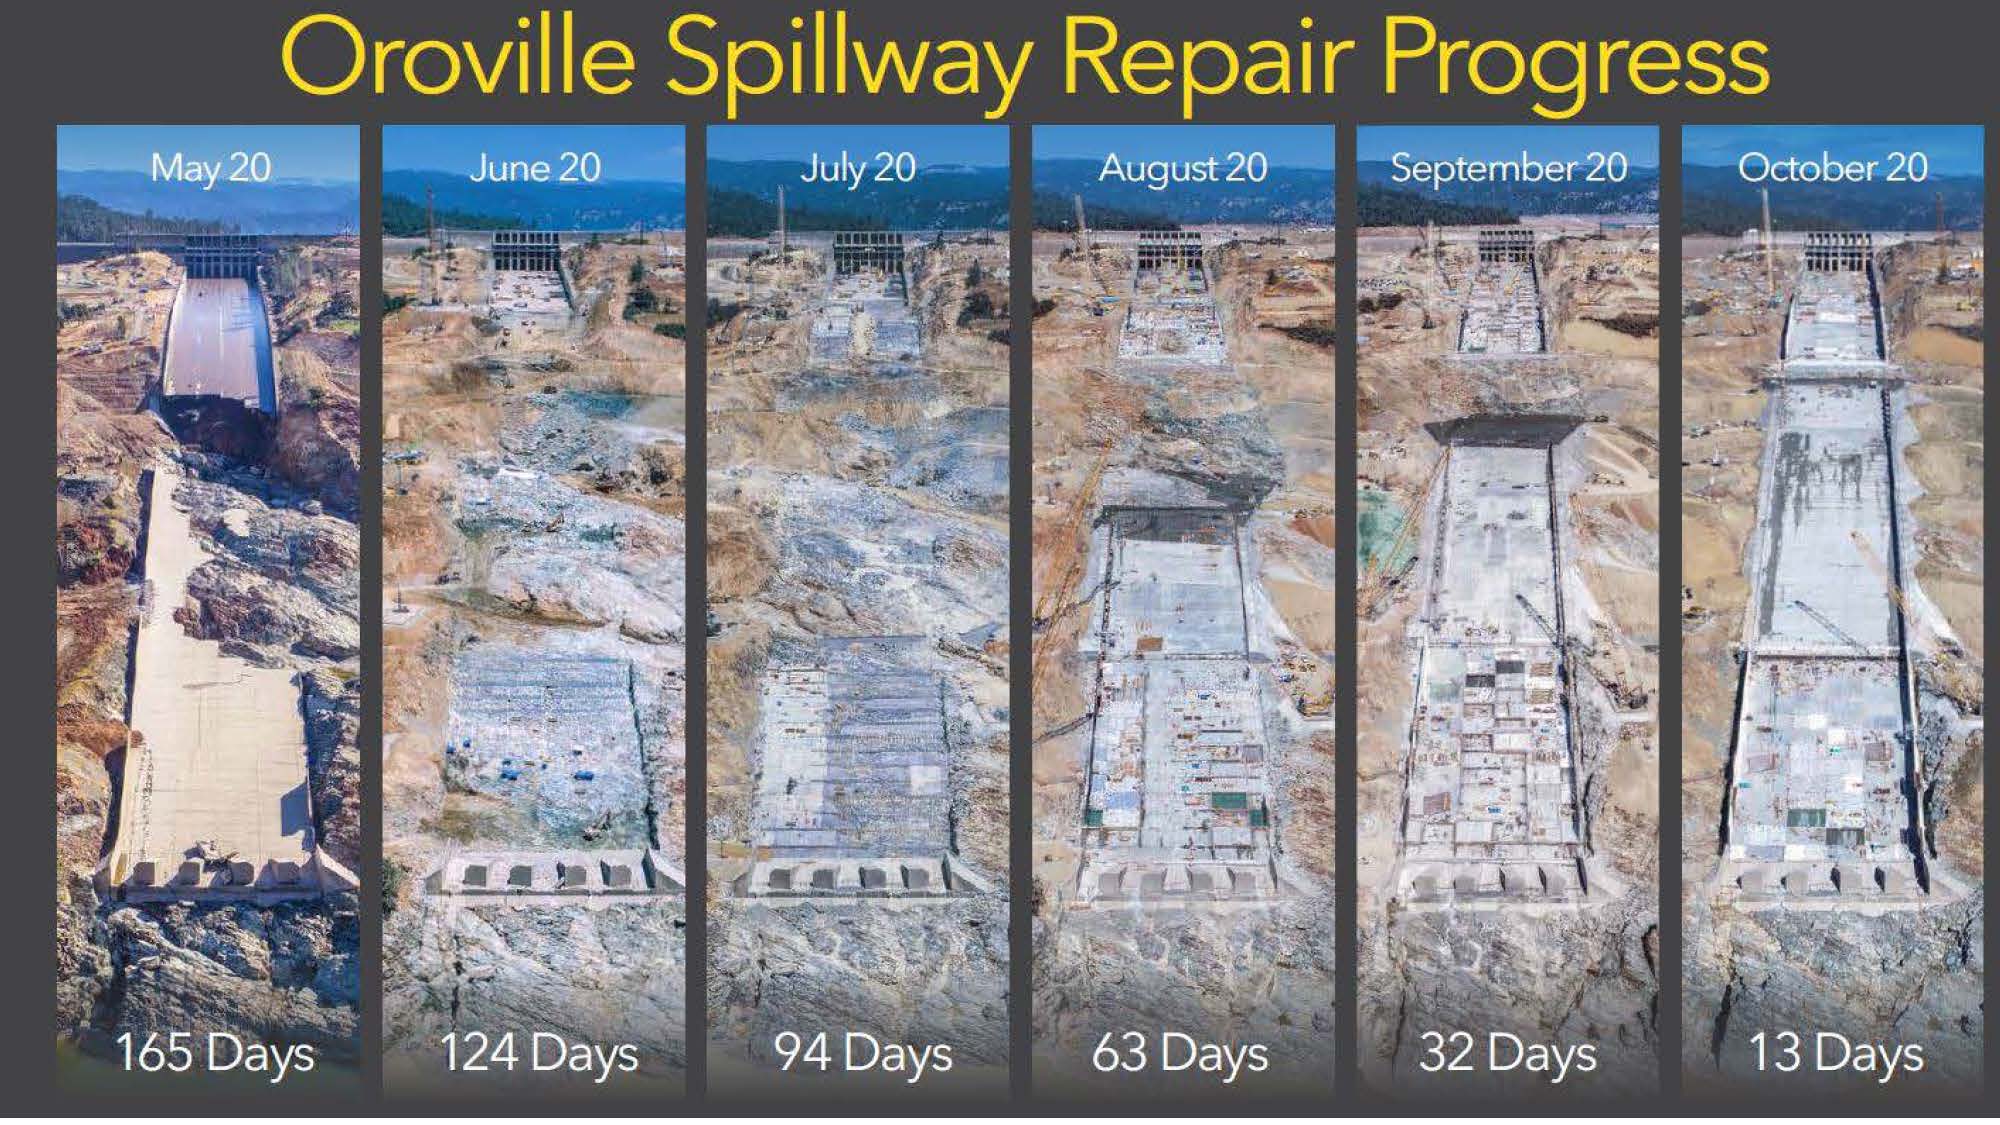 Mr. Ledesma presented the graphic showing the condition from May 20th when the spillway was closed to 13 days before the finish date, which shows how quickly construction was moving and how the work progressed. He noted that from May 20 to June 20 they had almost demolished the whole bottom section and just a month later they were starting to pour structural concrete and to get it rebuilt.
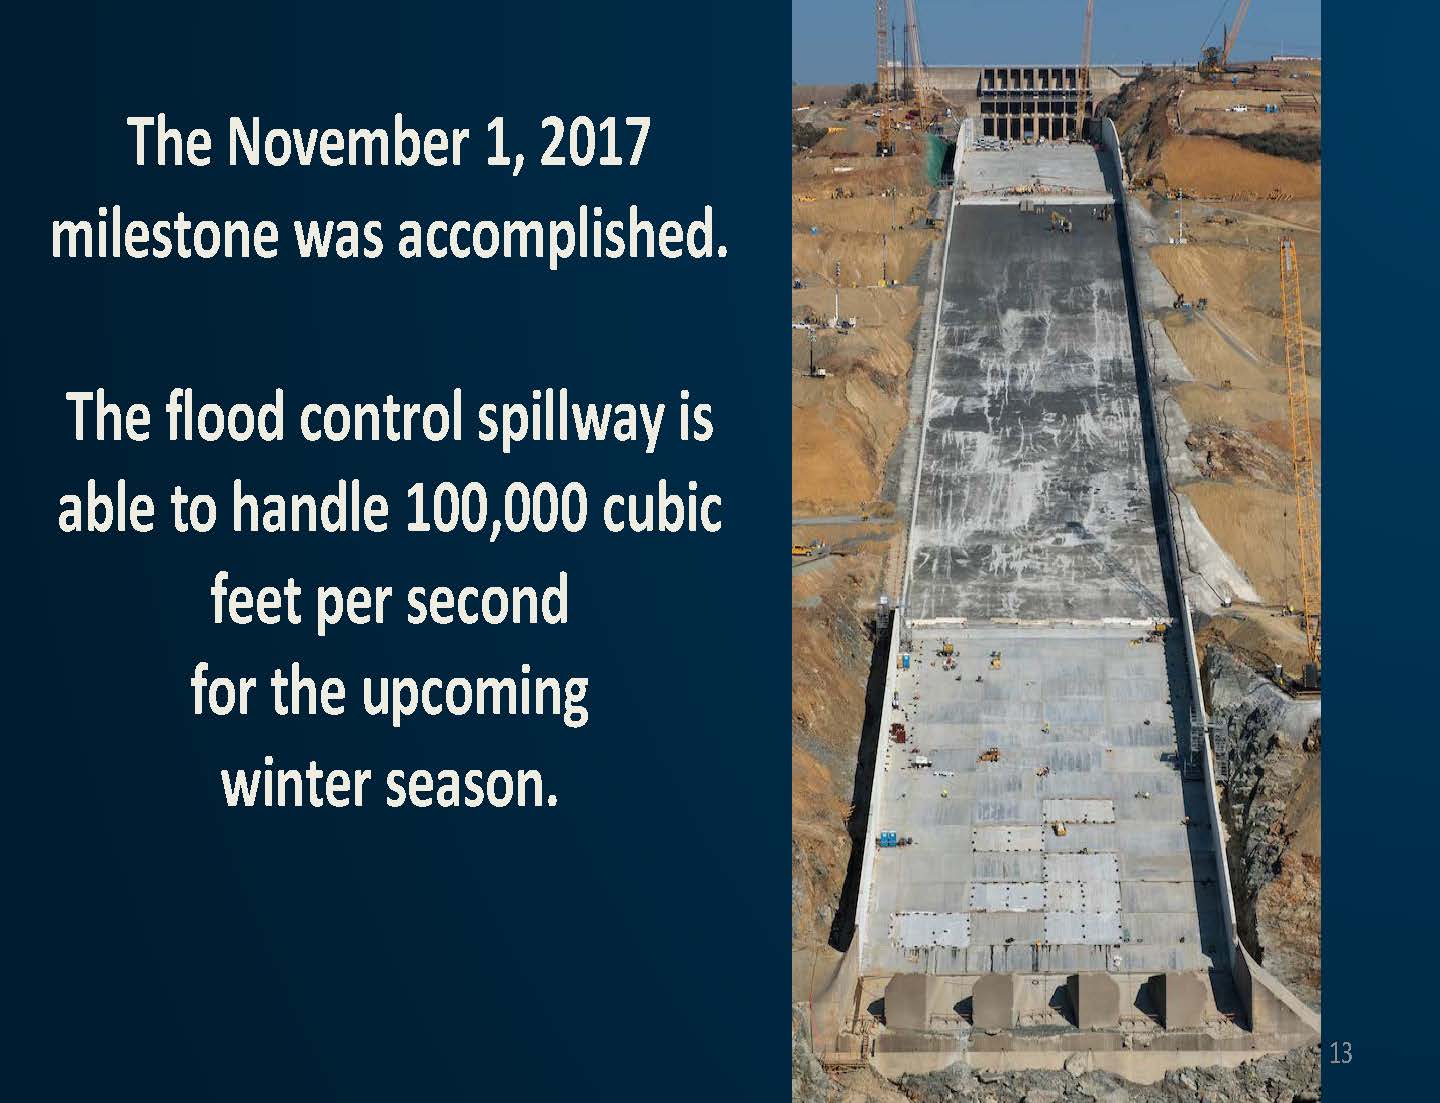 He then presented a slide of the spillway on November 1st. The middle section is the roller-compacted concrete. They did hydraulic modeling and physical modeling, testing it out all the way to 100,000 and even above and determined the spillway could handle up to 150,000 cfs this year if needed. The operational plan intends not to use the spillway this year, but if necessary, it can be used for up to 100,000 cfs, and only under emergencies or contingencies would it go above that, he said.


He presented two slides, showing the difference in the new construction versus what was built in 1968. The new design calls for thicker concrete, higher spillway walls, thicker reinforcing steel, and improved slab anchors; and piezometers which have been installed as part of the monitoring and surveillance plan for the spillway.


For the emergency spillway, a secant pile wall 1540 feet long is being built about 700 feet from the weir, which will stop any headward or upward erosion that were to happen if it is used again. In addition, there is a concrete buttress up against the weir and a splash pad to dissipate the energy coming off the weir, and then have a path so there is a cleaner flow going down past the wall and down the hill.
“These are safeguards, because our plan does not include using the emergency spillway,” said Mr. Ledesma. “We don’t want to use it and don’t intend to use it, but in the event we had to, at least we’re protected enough not to go through the erosion we had last time.”


“This would be one of the areas in the comprehensive assessment that we’re going to be doing in the next couple of years that will take into account what ultimately to we need to do to this emergency spillway all the way down to the diversion pool, or another spillway,” said Mr. Ledesma. “That’s to be determined, that will be done along with FERC and DSOD as we work through that comprehensive assessment and what’s needed for the dam and all the infrastructure.”


CALIFORNIA AQUEDUCT SUBSIDENCE STUDY
Don Walker, Division of Operations and Maintenance, next discussed the subsidence study undertaken for the California Aqueduct on the west side of the San Joaquin Valley. His update covered the purpose of the study, what they studied, the findings, and the next steps for addressing the problem.
PURPOSE AND FOCUS OF THE STUDY
When the aqueduct was originally constructed in the late 1960s, portions were overbuilt to accommodate future expected subsidence; raises of the aqueduct have since occurred, but the limits on these features have reached its limits. Now, there is loss of freeboard where the level between the water surface and the concrete liner is getting smaller and structures that were over the water are now getting closer to the water, both of which are indicators of structural movement. The subsidence has also impacted operations, causing less flexibility in how water is scheduled and delivered over time.
The study looked at where the aqueduct was subsiding and by how much; how the subsidence is impacting water deliveries, and what are the near and long-term solutions for the problem.
 Since the California Aqueduct was constructed, they have been conducting precise surveys or elevation data on a regular basis, generally every 3 to 5 years. In the past few years, they have been surveying on an annual basis. They also worked with NASA to use UAVSAR satellite data to monitor and assess subsidence along the aqueduct. “We were able to get some flight time over the aqueduct and we’re able to get more real time and more frequent monitoring,” said Mr. Walker. “The UAVSAR actually monitors vertical movement over time, so we can see these pictures of how things move over time in addition to our survey.”
They are conducting research and doing some modeling to get an understanding of the impacts, how the operations have changed, and how it will affect operations moving forward, as well as assessing impacts to structures. “The aqueduct is more than just a raising an embankment,” said Mr. Walker. “There are a lot of structures, a lot of turnouts, lots of bridges, lots of overchutes – there are a lot of things that cross and are attached to the aqueduct. We have these flow control structures or check structures, and as they move, they impact operations, so understanding all of that so we can move forward and come up with a solution that addresses these problems.”
In the next phase of the study, they then will identify alternatives, evaluate those alternatives, then select an alternative or a series of alternatives for a long-term solution. Part of this work includes looking at areas where subsidence may continue in the future and considering how long a fix is going to last before further work would need to be done.
FINDINGS
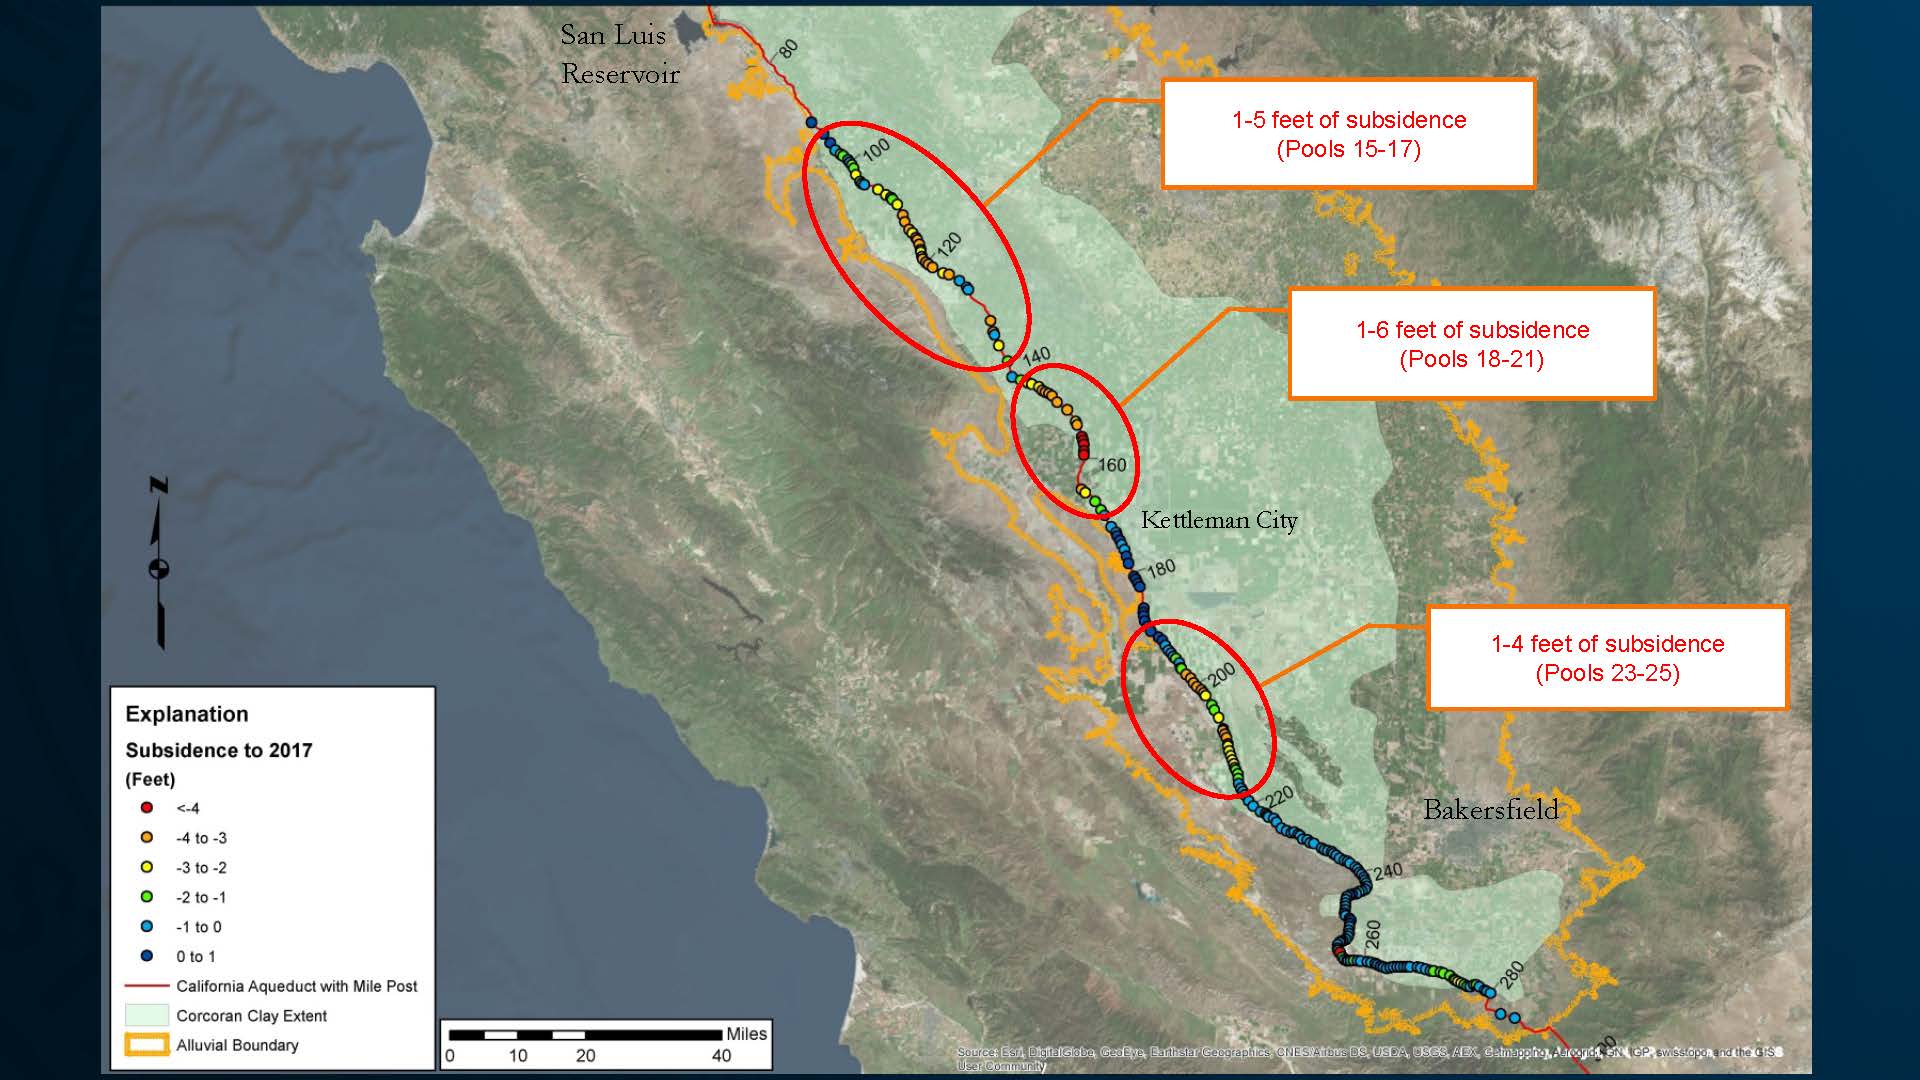 Mr. Walker presented a slide of the study area, noting that the red circles indicate where they found three bowls of subsidence. The dots indicate subsidence, with the warmer colors indicating greater subsidence. The subsidence magnitudes ranged from 1 to 6 feet being the greatest, and 1 to 4 feet in other areas.
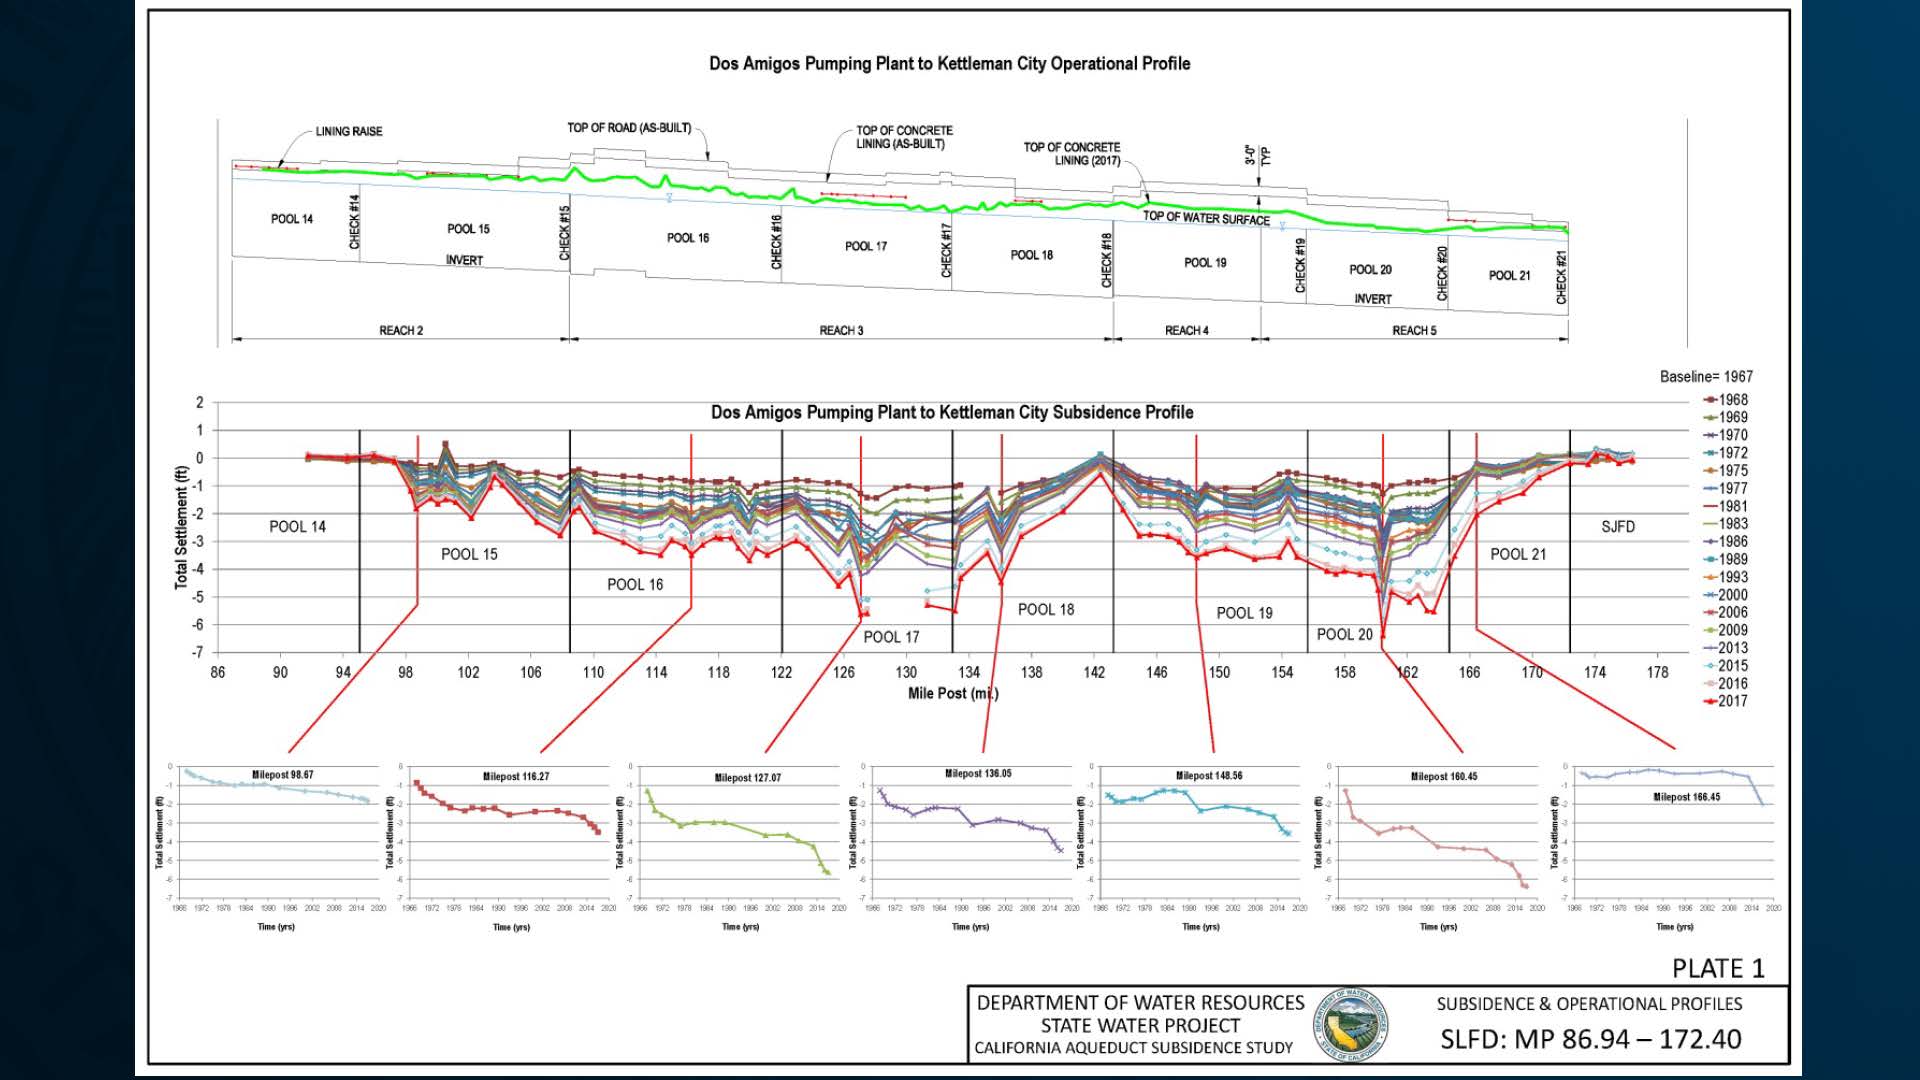 He next presented a graph of subsidence and operational profile of the aqueduct for the portion inside the San Luis Field Division, the northernmost portion of their study area. He explained that flow is from left to right, so uphill is on the left side and downhill is to the right. The top graph reflects the as built conditions and also some of the extra embankment that was put on to accommodate subsidence; the green line indicates the elevation of the existing concrete liner. The areas where the green line and water line come closest together are where they are losing their freeboard.
The middle graph shows surveys from 1967 to 2017, indicating how much the aqueduct has sunk over the last 50 years. The latest survey, 2017, is the dark red line on the bottom. The precise survey looks at the elevation of the liner and structure every 1000’.
Mr. Walker noted that while the subsidence bowls can be seen in the graph, there is a lot of vertical exaggeration. “The subsidence is about 6 feet, but this is 10 miles or so, so that’s a half foot every mile or so,” he said. “It’s not like running up against a cliff wall but it does show how we go as we flow downhill.”
He also pointed out that the gaps or the white space between the lines is an indication of the rate of subsidence, which is also reflected in the bottom graphs. He noted that on the graph on the far left, the elevation has remained fairly steady, with relatively little subsidence over time. However, as you move downstream into other pools, the subsidence rates are much greater, and over the last few years, the steep drop has occurred again. The last graph on the right shows a site that has had very little subsidence up until recent years, now seeing rates of subsidence not seen in the past at this location.
“It reflects that where subsidence can occur, that it can occur at different rates at different locations for various reasons,” he said.
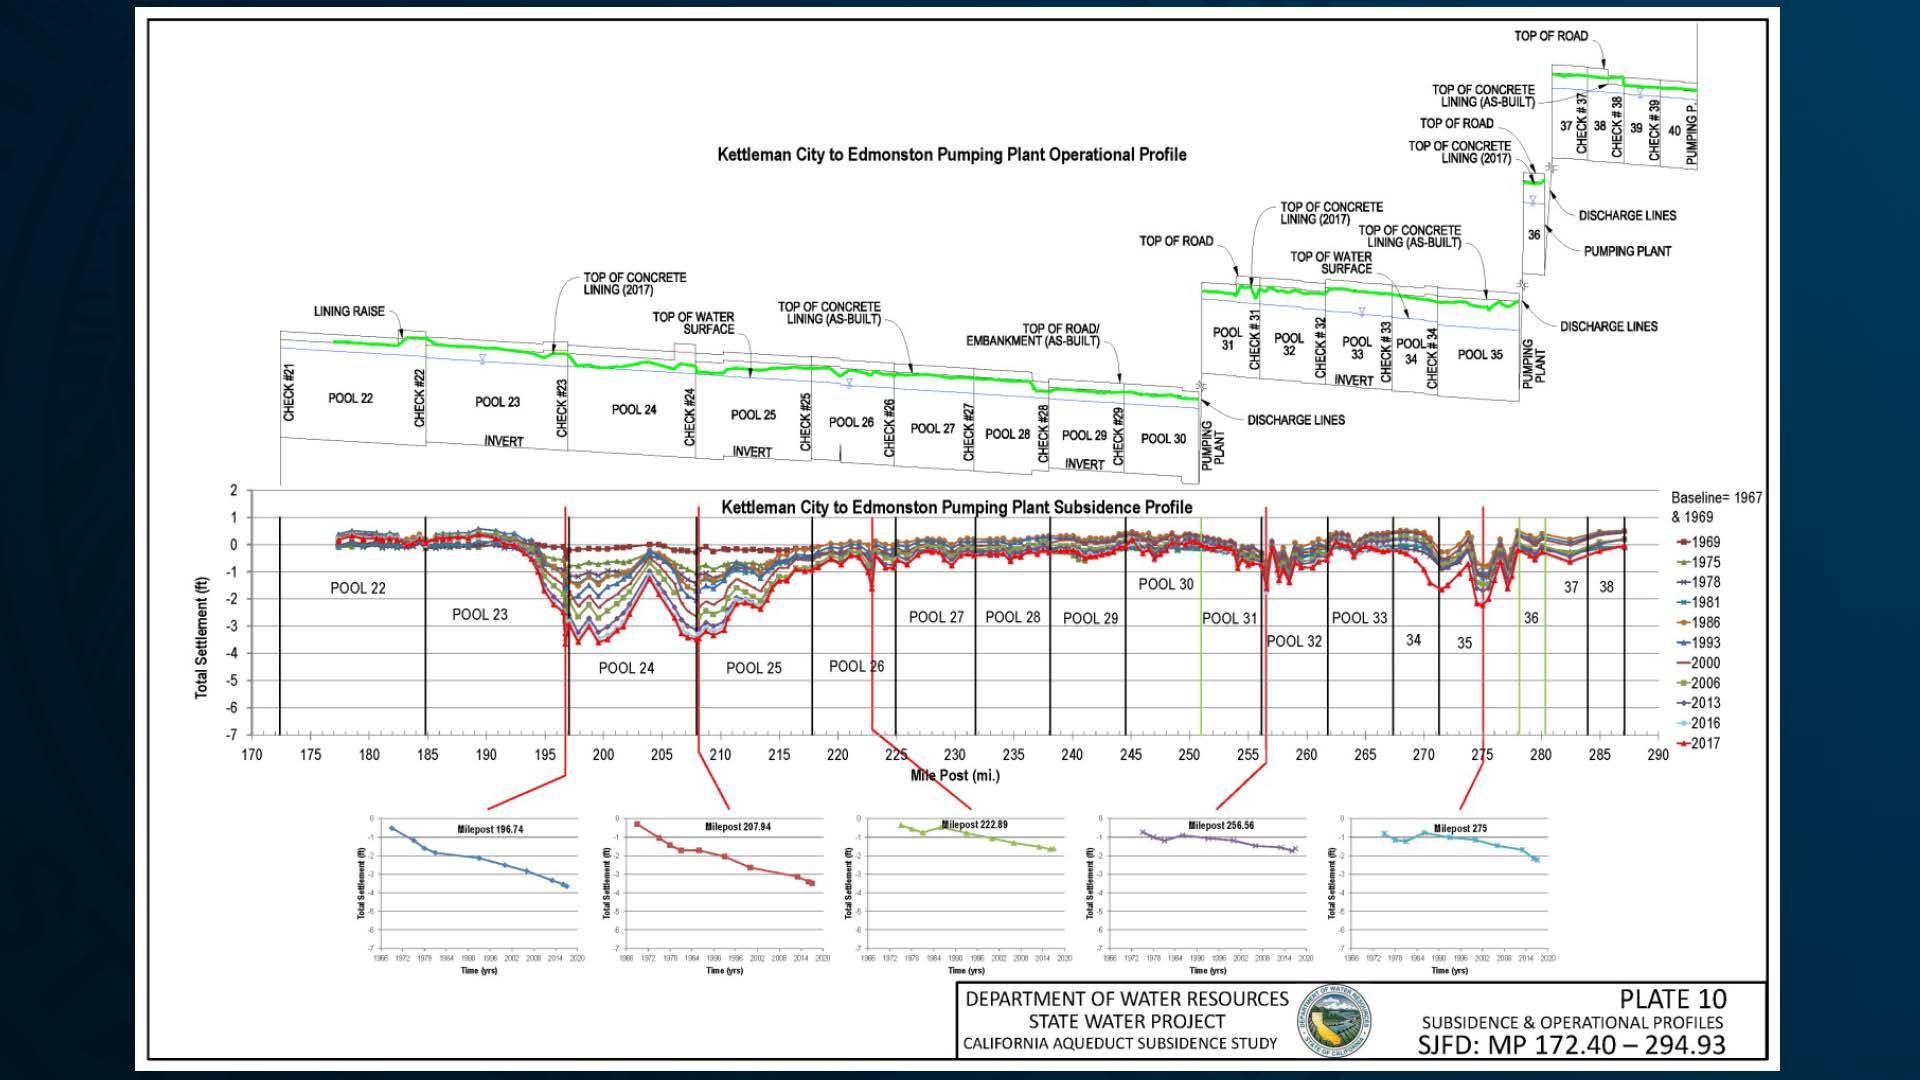 Mr. Walker then presented a similar graph for the San Joaquin Field Division, and pointed out that there isn’t as much subsidence occurring in this section of the aqueduct. He explained that the step ups on the top graph indicate the pumping plants. There’s not as much subsidence occurring but there still was some plan for subsidence, he said, noting that the green line isn’t quite as impacted. “Over time, we’ve seen a little bit of subsidence at some locations, but we have lots of freeboard, so that’s why we’re able to accommodate this at this time. This is also reflecting fairly even steady rates of subsidence over time.”
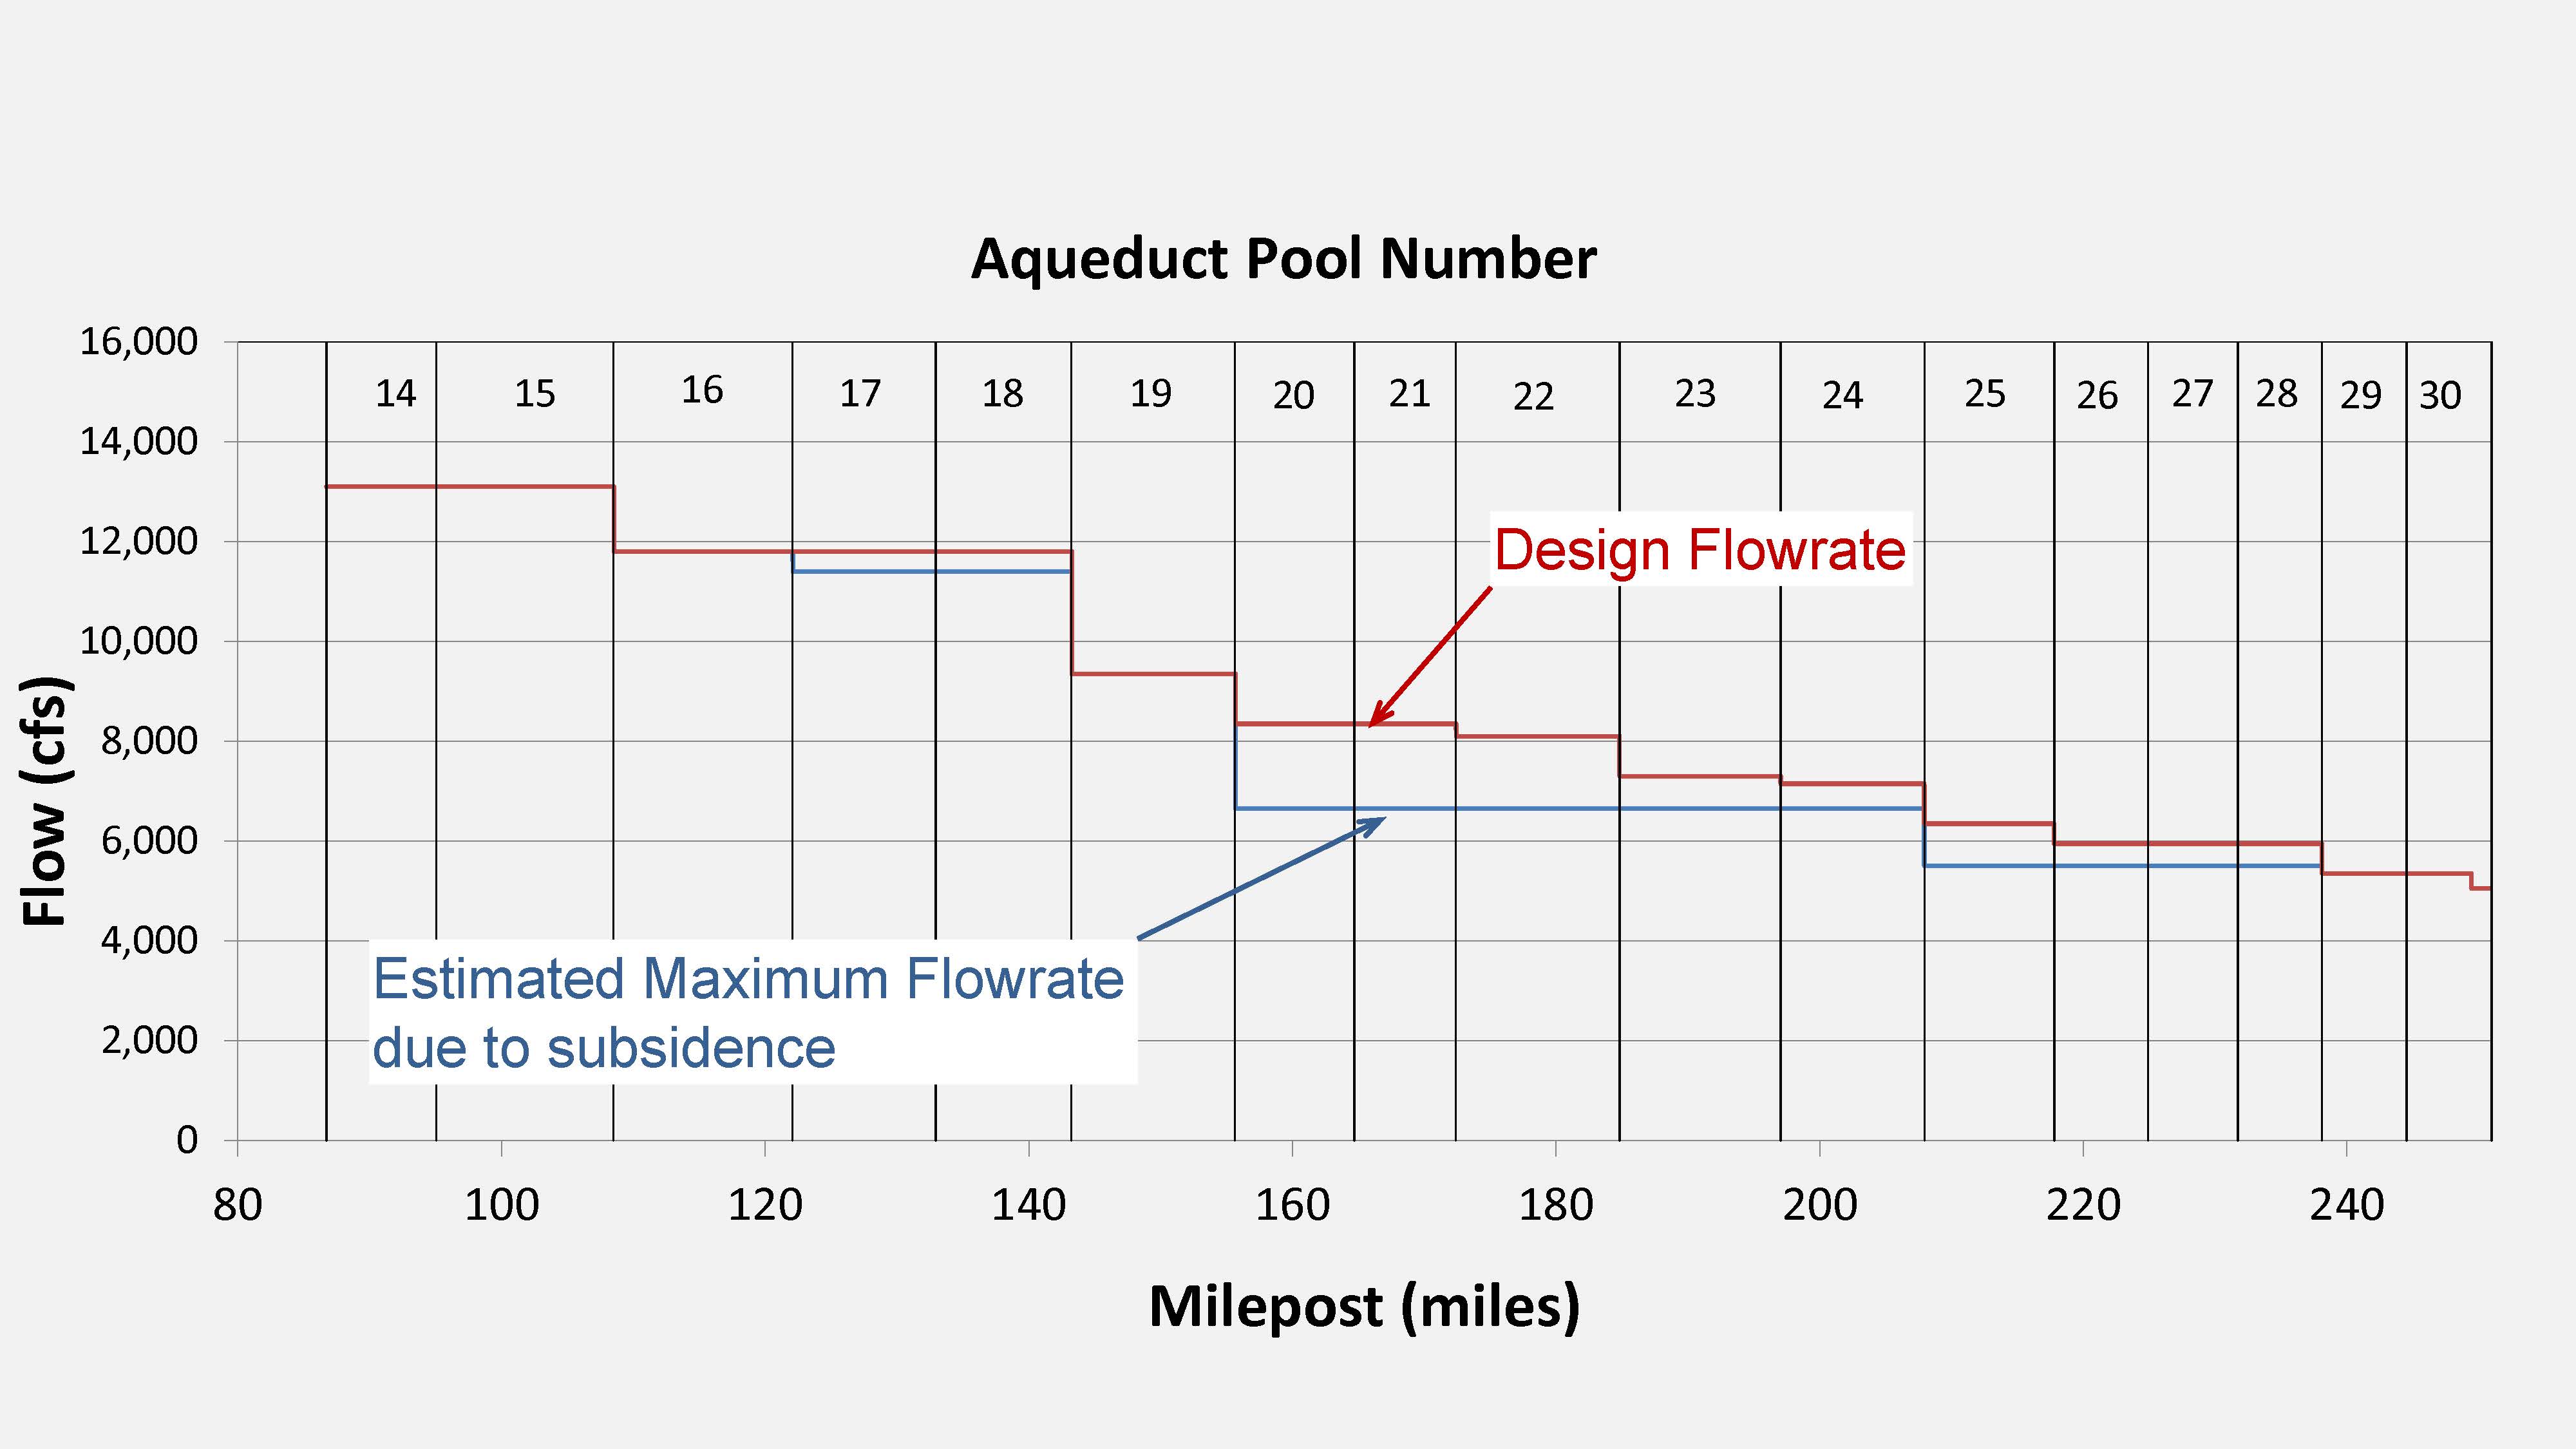 Mr. Walker then presented a slide to show how the subsidence has impacted capacity. He noted that as the aqueduct flows southward, the capacity is reduced as deliveries are made through various pools; this is reflected in the red line which indicates the design flow rate that steps down as it progresses downhill. The blue line is the estimated maximum flow rate due to subsidence and it does reflect the three subsidence bowls.
“Pool 17 is the area in that first bowl where the most subsidence occurred and you can see a small slight decrease, a few percent, about 5% or so; that reflects itself through pool 18,” he said. “The most subsidence we’ve seen is in Pool 20, that’s where we see our greatest reduction in capacity, it’s about 20%, and that capacity reduction translates itself all the way down through the San Luis Field Division and into the San Joaquin until we get to the next subsidence bowl in pools 24, 25 and then that capacity reduction is reflected all the way to almost the Buena Vista Pumping Plant.”
He emphasized that the reduction in capacity isn’t a reflection in deliveries; it more impacts flexibility. “We’ve still been able to make deliveries even though capacities are reduced because the aqueduct was built with excess capacity being a peaking facility and planned subsidence, but it is impacting us as we move forward,” he said.
CURRENT AND FUTURE ACTIONS TO ADDRESS SUBSIDENCE
Mr. Walker said there are several steps the Department is taking to address the problems. The first step was to perform this study. Phase 1 defined the problem; phase 2 will develop fixes for it, and will include developing and selecting alternatives, and then implementing a long-term plan.
In the interim, they are looking now at operational limits and where these restrictions are, and they are identifying locations in each of these pools where they might be losing freeboard or where there might be a structure such as a turnout or an overchute that’s impacting capacities. They have identified short-term actions that can be addressed in the next six months that will give operators a little extra breathing room; this also includes extra instrumentation on the aqueduct so they can better monitor what is occurring. These short-term actions will help focus on safer operation of the aqueduct.
They are also starting some medium-term actions, which are things that will take a bit longer to do. These are actions that take more design and evaluation, such as moving an overchute or addressing an overchute that is either in the water or close to the water. Those medium-term actions will help to provide for safer operations as well as restore some of the lost capacity and try to minimize the impacts over time as this continues to subside. The long-term actions will occur after phase 2 is completed and they have selected the alternatives for a long-term fix.
Mr. Walker also noted that they have also begun participating as a stakeholder for the State Water Project in the development of groundwater sustainability plans in any area where an agency is developing a groundwater sustainability plan that would touch the State Water Project.
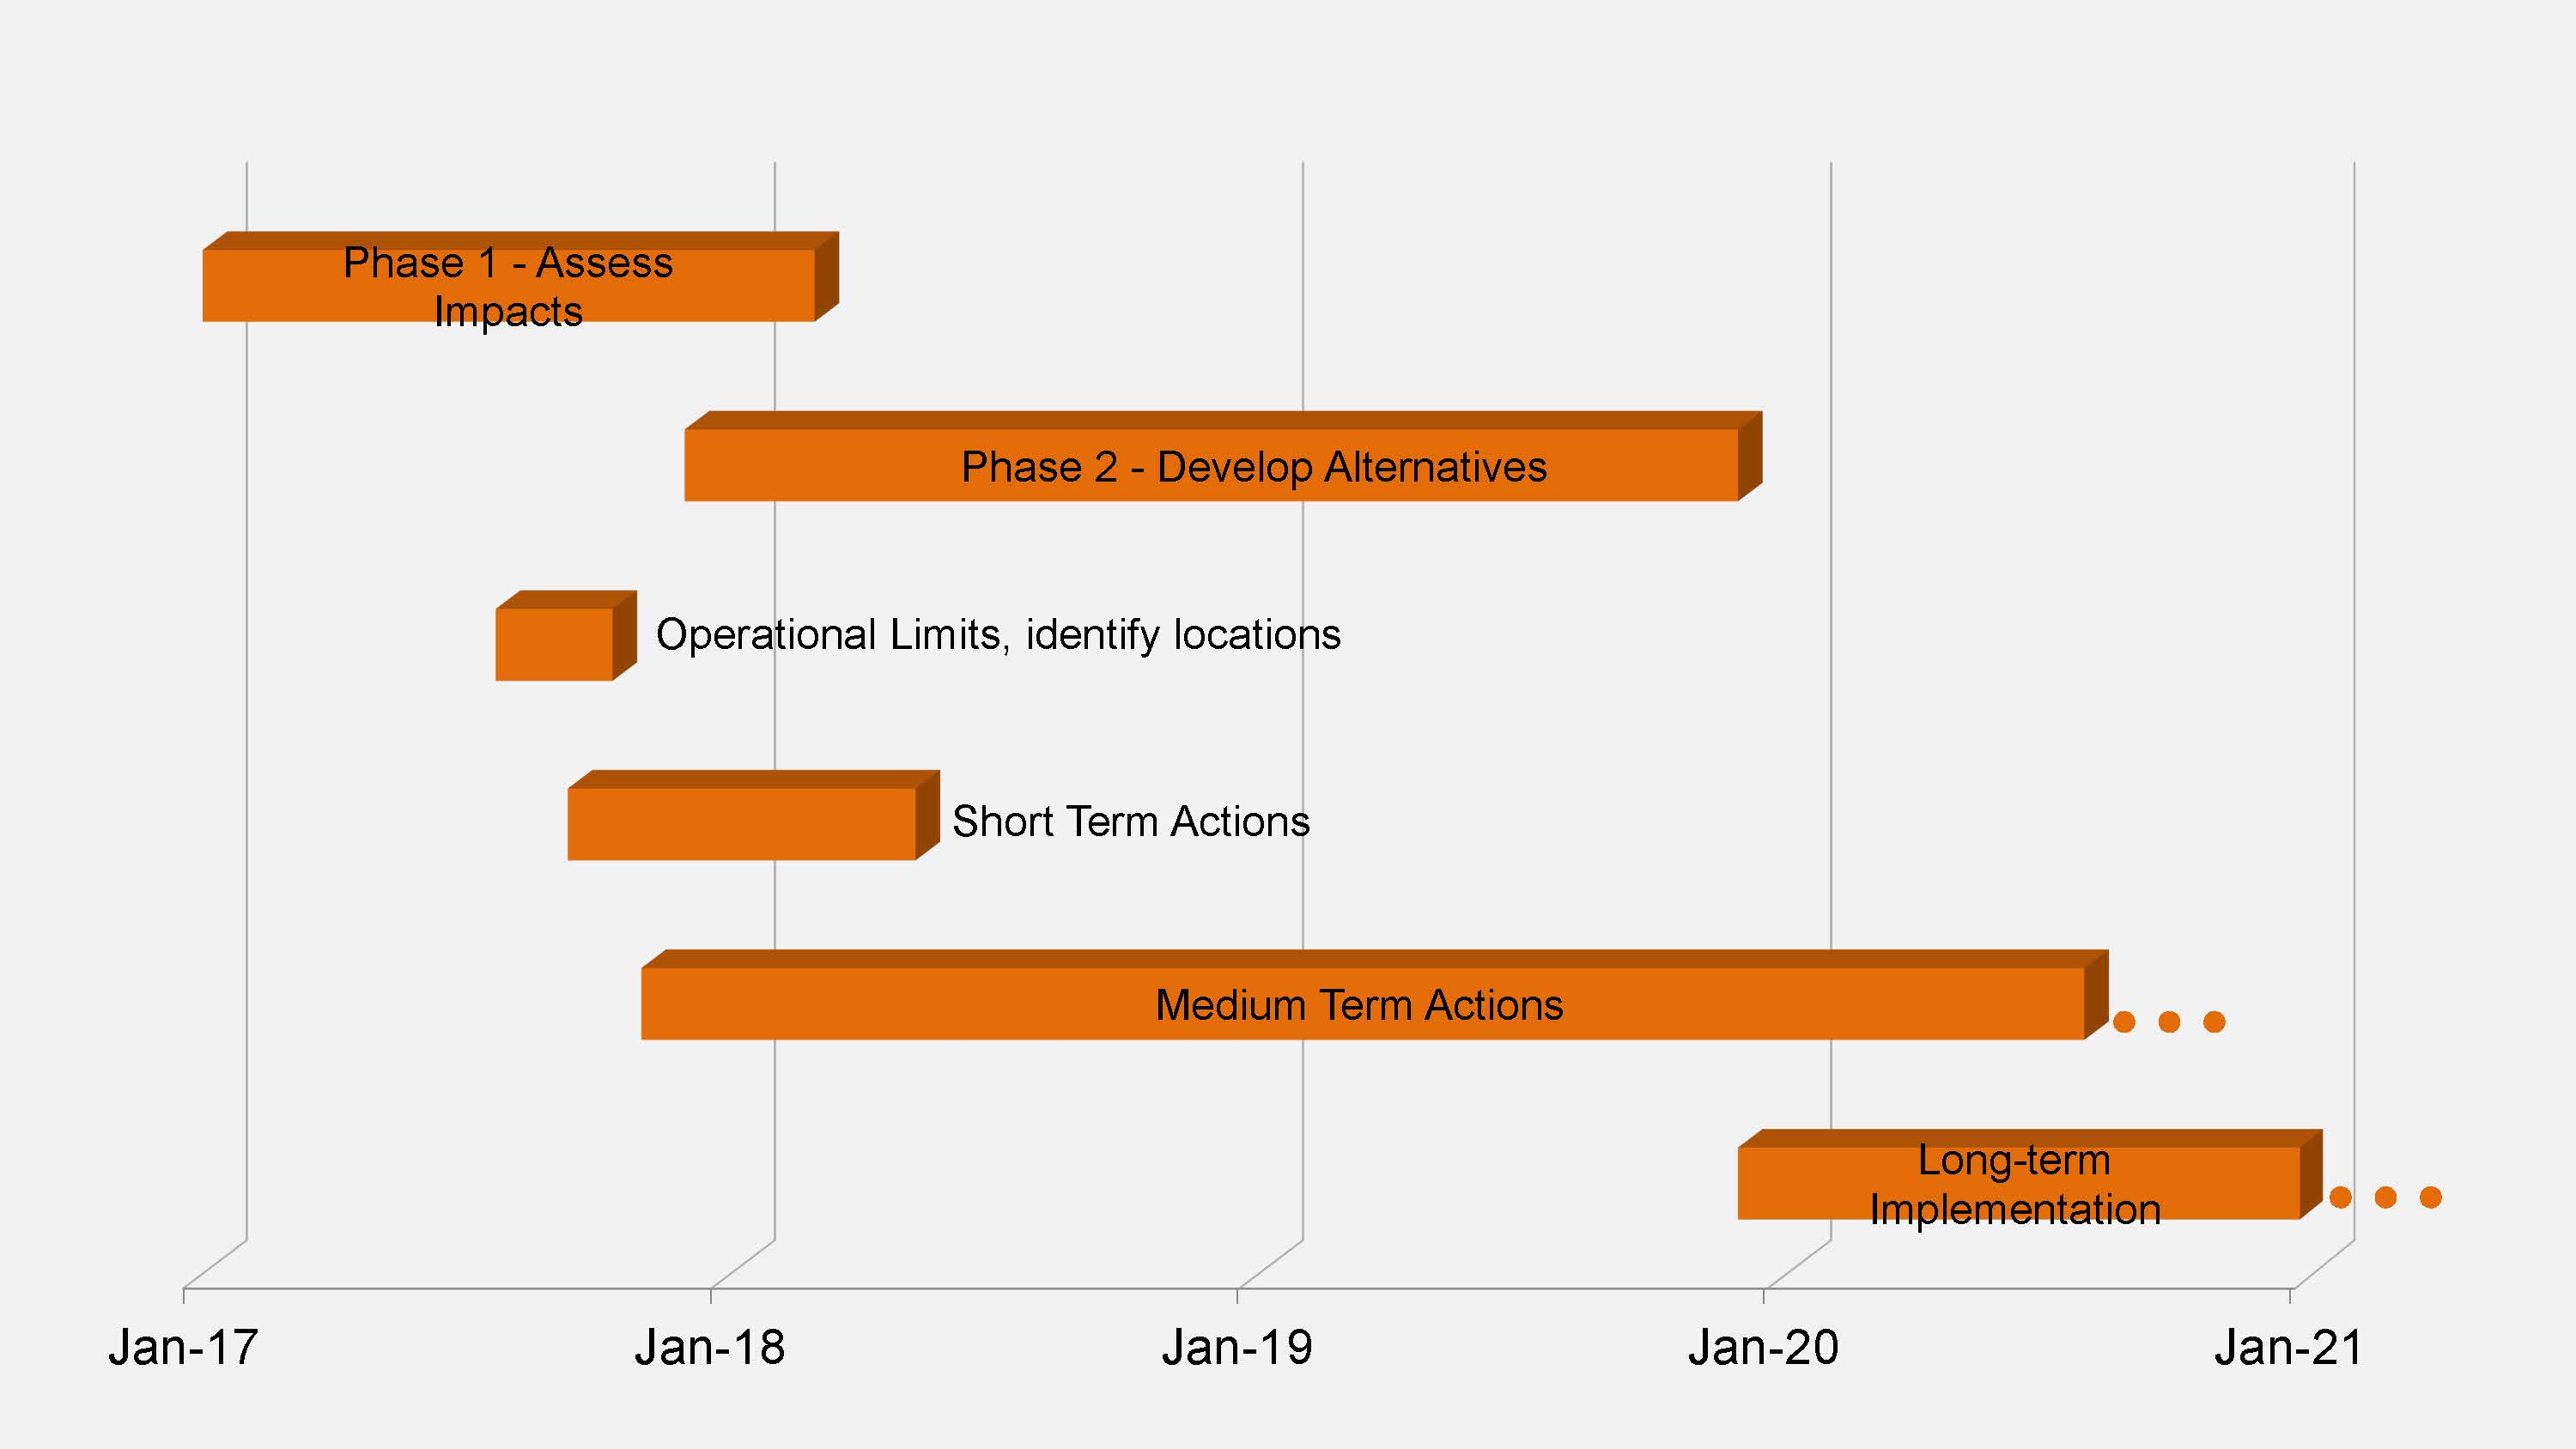 He then presented a timeline for the actions. They are currently working on developing alternatives and should have those by mid-2019; that then feeds the long-term implementation. The operational limits have been determined, and they are feeding the short-term and medium-term actions, which have already been started. They will have some actions in place for pool 17 and 20 by May of 2018. “This is a bit of an iterative approach as we move forward and keep actions going until this long-term implementation plan is in place,” he said.
“In summary, subsidence has occurred,” Mr. Walker said. “It has impacted our capacity; it has reduced it about 20% in one location, that’s pool 20. We’re currently implementing actions to mitigate those impacts. It will reduce some of those impacts, it won’t restore it to full capacity; that won’t be until the longer-term and we’ll have to see how that looks. We are working towards those longer-term solutions, and we are pursuing our stakeholder role in development of GSPs from the different agencies.”
GHG EMISSIONS REDUCTION
Andrew Schwarz, Senior Engineer with the Climate Adaptation Office, then discussed DWR’s progress toward reduction of greenhouse gas emissions.
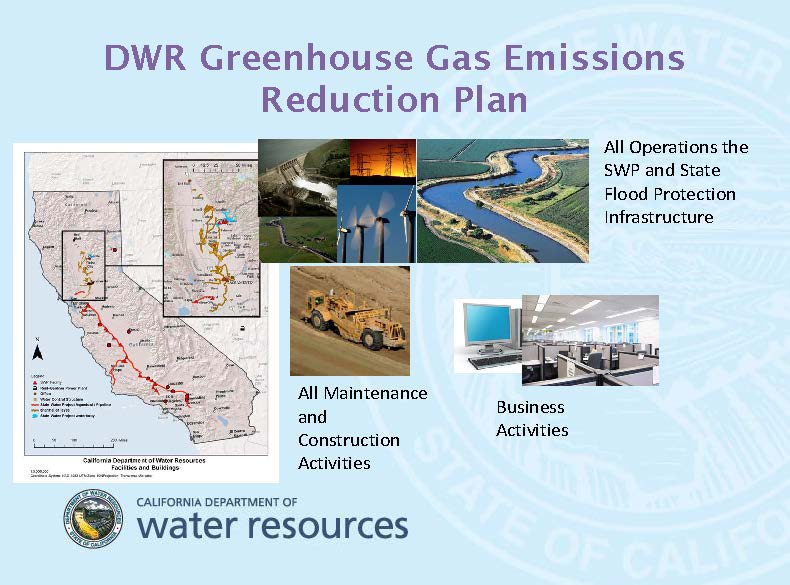 In 2012, DWR adopted its Greenhouse Gas Reduction Emissions Plan, which is also phase 1 of their three-phase climate action plan. The plan covers all of the operations of the State Water Project, the portion of the State Plan of Flood Control that DWR manages, all maintenance and construction activities, including those undertaken by contractors, and it even includes covering business activities such as electrical use in buildings, computers, the fleet of cars, and the like.
The Department established two aggressive goals for GHG reduction in the 2012 plan: The near term goal is to reduce GHG emissions 50% below 1990 levels, and then by 2050, to reduce GHG emissions to 80% of what they were in 1990. Mr. Schwarz noted that these goals are much more aggressive than the goals set by the state for GHG reductions.
“We’d like to think that we’re doing more than our share to get the state where we need to go,” he said. “Our emissions in 1990 are estimated to have been about 2.7 million metric tons, so it’s not a small contribution.”
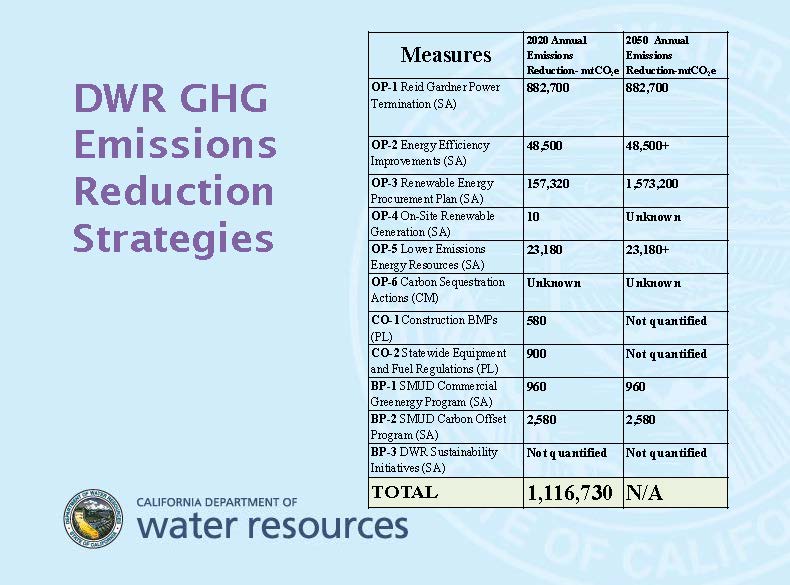 The emission reduction plan outlined eleven strategies. The first strategy was get out of Reed Gardner Power Plant, a coal-fired power plant in Nevada that the Department had an ownership interest in since the 80s. That was completed in 2013, so the Department is no longer utilizing any coal-fired power. The second strategy is to implement energy efficiency improvements at each of the pumping and generating facilities throughout the State Water Project; they have an ongoing process to identify the facilities that have the most advantage from upgrading or tuning up. The third strategy is the renewable energy procurement plan, which is the subject of the next presentation.
“The rest of these are really smaller activities but they should be understood that we designed all of these strategies to make sure that we’re attacking every place where DWR has GHG emissions,” Mr. Schwarz said. “We didn’t just go after the low hanging fruit, we have best management practices for our construction activities, we have activities that go after the emissions that come from the lights and computers and our business practices, even though it’s a very small contribution to our footprint.”
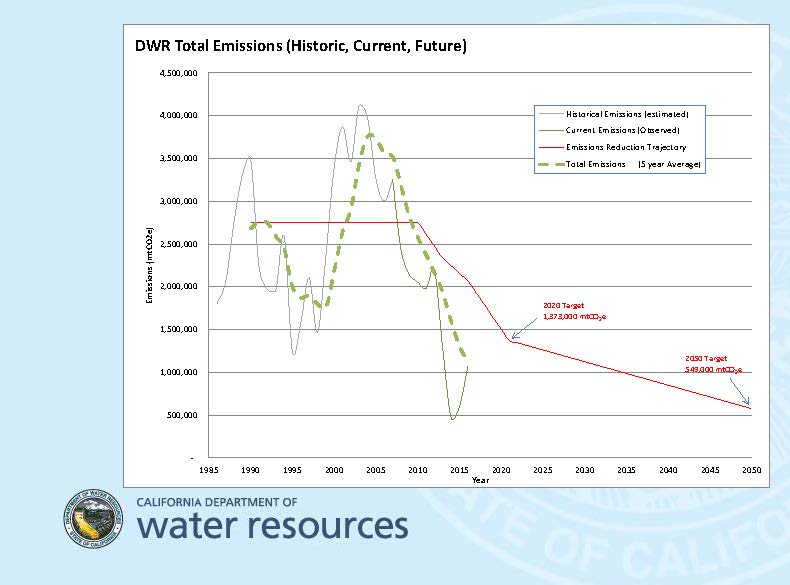 Mr. Schwarz presented a graph of the Department’s GHG emissions, historic, present and future. The red line is the emissions target, which represents 1990 levels; it drops at 2020 to the goal of 1.3 million metric tons, and then down to the 2050 goal of just over half a million metric tons. The gray line represents the actual emissions, which can vary significantly from year to year because operations are greatly impacted by hydrologic conditions. “If there’s a lot of rain and streamflow, we’re moving a lot more water and we’re running our pumping plants to pump that water,” he said. “We are generating more electricity in those years, too, so that offsets it a bit, but you see these big years really coincide with big delivery years.”
He noted that emissions peaked about 2006 at about over 4 million metric tons of CO2, and have dropped precipitously from there. This was due to the drought during which they didn’t deliver quite as much water. “It doesn’t matter as much as one might think. The green dotted line is the five year running average, so that smooths out some of this hydrologic variability quite a bit. You can see that even smoothing for the drought that just occurred, our emissions have been on a long downward trajectory and we have probably already achieved our 2020 reduction target in 2016. And we are well on our way toward making that 2050 goal as well.”
He said that they have taken into account the Oroville disaster response and recovery efforts, noting that their preliminary estimates are that over the two years of major construction to repair the spillway, that it will be about 200,000 metric tons of CO2 emissions, which is not enough to push them off their trajectory.
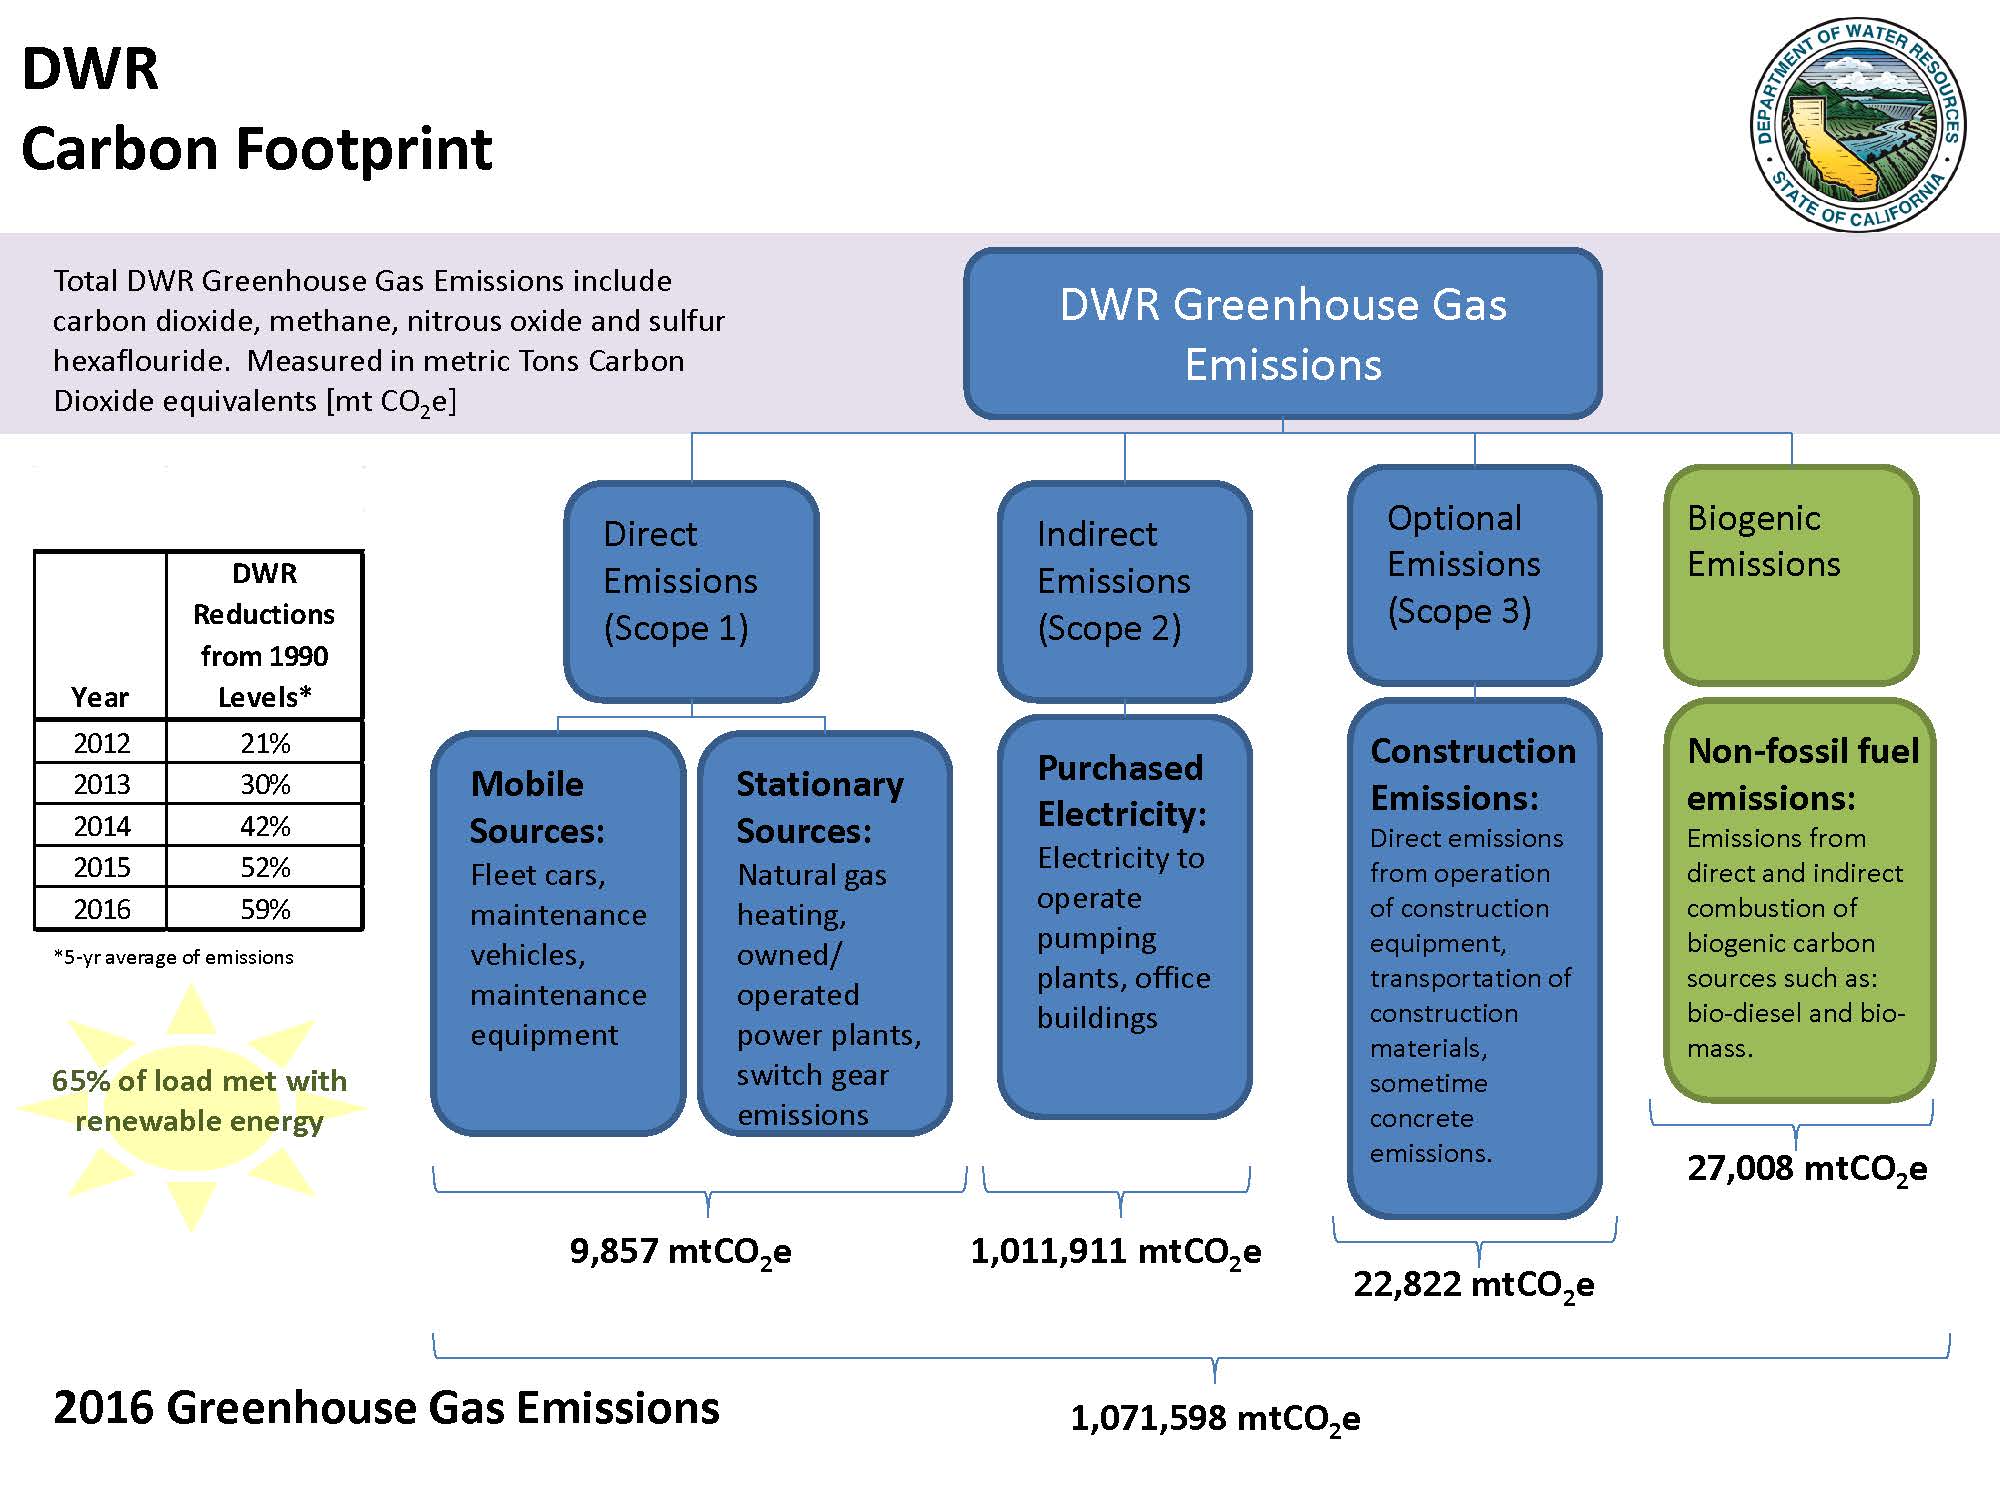 He presented a graphic showing the greenhouse gas emissions for 2016. The emissions are broken down into four categories:
- Scope 1 is direct burning of fossil fuels such as natural gas or diesel. This accounts for fleet vehicles and maintenance vehicles, and is relatively small – only about 10,000 metric tons per year.
- Scope 2 is indirect emissions, which is basically purchased electricity. This is the largest source at about one million metric tons in 2016.
- Scope 3 is optional emissions, as most companies or entities that report their emissions don’t go this far. These are construction emissions; the Department does a fair amount of construction every year through contractors. It represents about 25,000 metric tons per year.
- Scope 4 are non-fossil fuel emissions from biogenic sources such as biodiesel and biomass.
Mr. Schwarz also pointed out that in 2016, about 65% of DWR’s total electricity load was met with renewable energy. “DWR and the State Water Project is not subject to the renewable portfolio standards that the state has for electric utilities, but even if we were, we would be pretty close to what they are required to do, or above that.”
He also noted that the Department provides information to all of the state project contractors about the energy embedded in the water they are providing as well as the embedded GHG emissions that are in each acre-foot that is provided.
A NOTE ABOUT THE STATE WATER PROJECT AND ELECTRICITY USE
Mr. Schwarz said that all electricity is energy, but not all energy is electricity, and sometimes folks get the misuse the numbers. “It’s been long known that the water sector uses about 19% of the state’s electricity, but that also often gets confused when people say it’s 19% of the state’s energy- that’s not true,” he said. “If we think about all of the energy in the state that we use, about 12% goes to the state’s water sector, and that includes all of the natural gas that we use in the water sector, predominantly for heating of water at the end user level. Of that 12% of all of the state’s energy that goes into the water sector, 10% of that is used by end users, and only 2% is really used by water utilities like DWR or your local water utility delivering you water for the conveyance, treatment, and distribution, so it’s still a relatively small sliver of the statewide energy and even of the electricity piece.”


“So looking at the state, statewide 2 – 2.5% energy is used by water utilities, about 7.5% of the state’s electricity is used by water utilities, and about 20% of all water sector energy use. Looking at the SWP’s contribution to that, so we use about .3% of the state’s energy, and we move about 1 to 3 million acre-feet per year, and we do it by committing about 1 million metric tons of GHG per year.”
DWR’s RENEWABLE ENERGY PORTFOLIO
Dr. Ghassan ALQaser, Chief of the Power and Risk Office, then gave a presentation on renewable energy sources in DWR’s power portfolio.
On average, the State Water Project delivers 2.6 MAF a year through a network of hydroelectric generation plants and pumping plants. The State Water Project generates 4 to 7 million megawatt hours of zero-emission hydroelectric power every year, and consumes 6 to 9.6 million megawatt hours to pump the water, making the State Water Project a net consumer of energy.
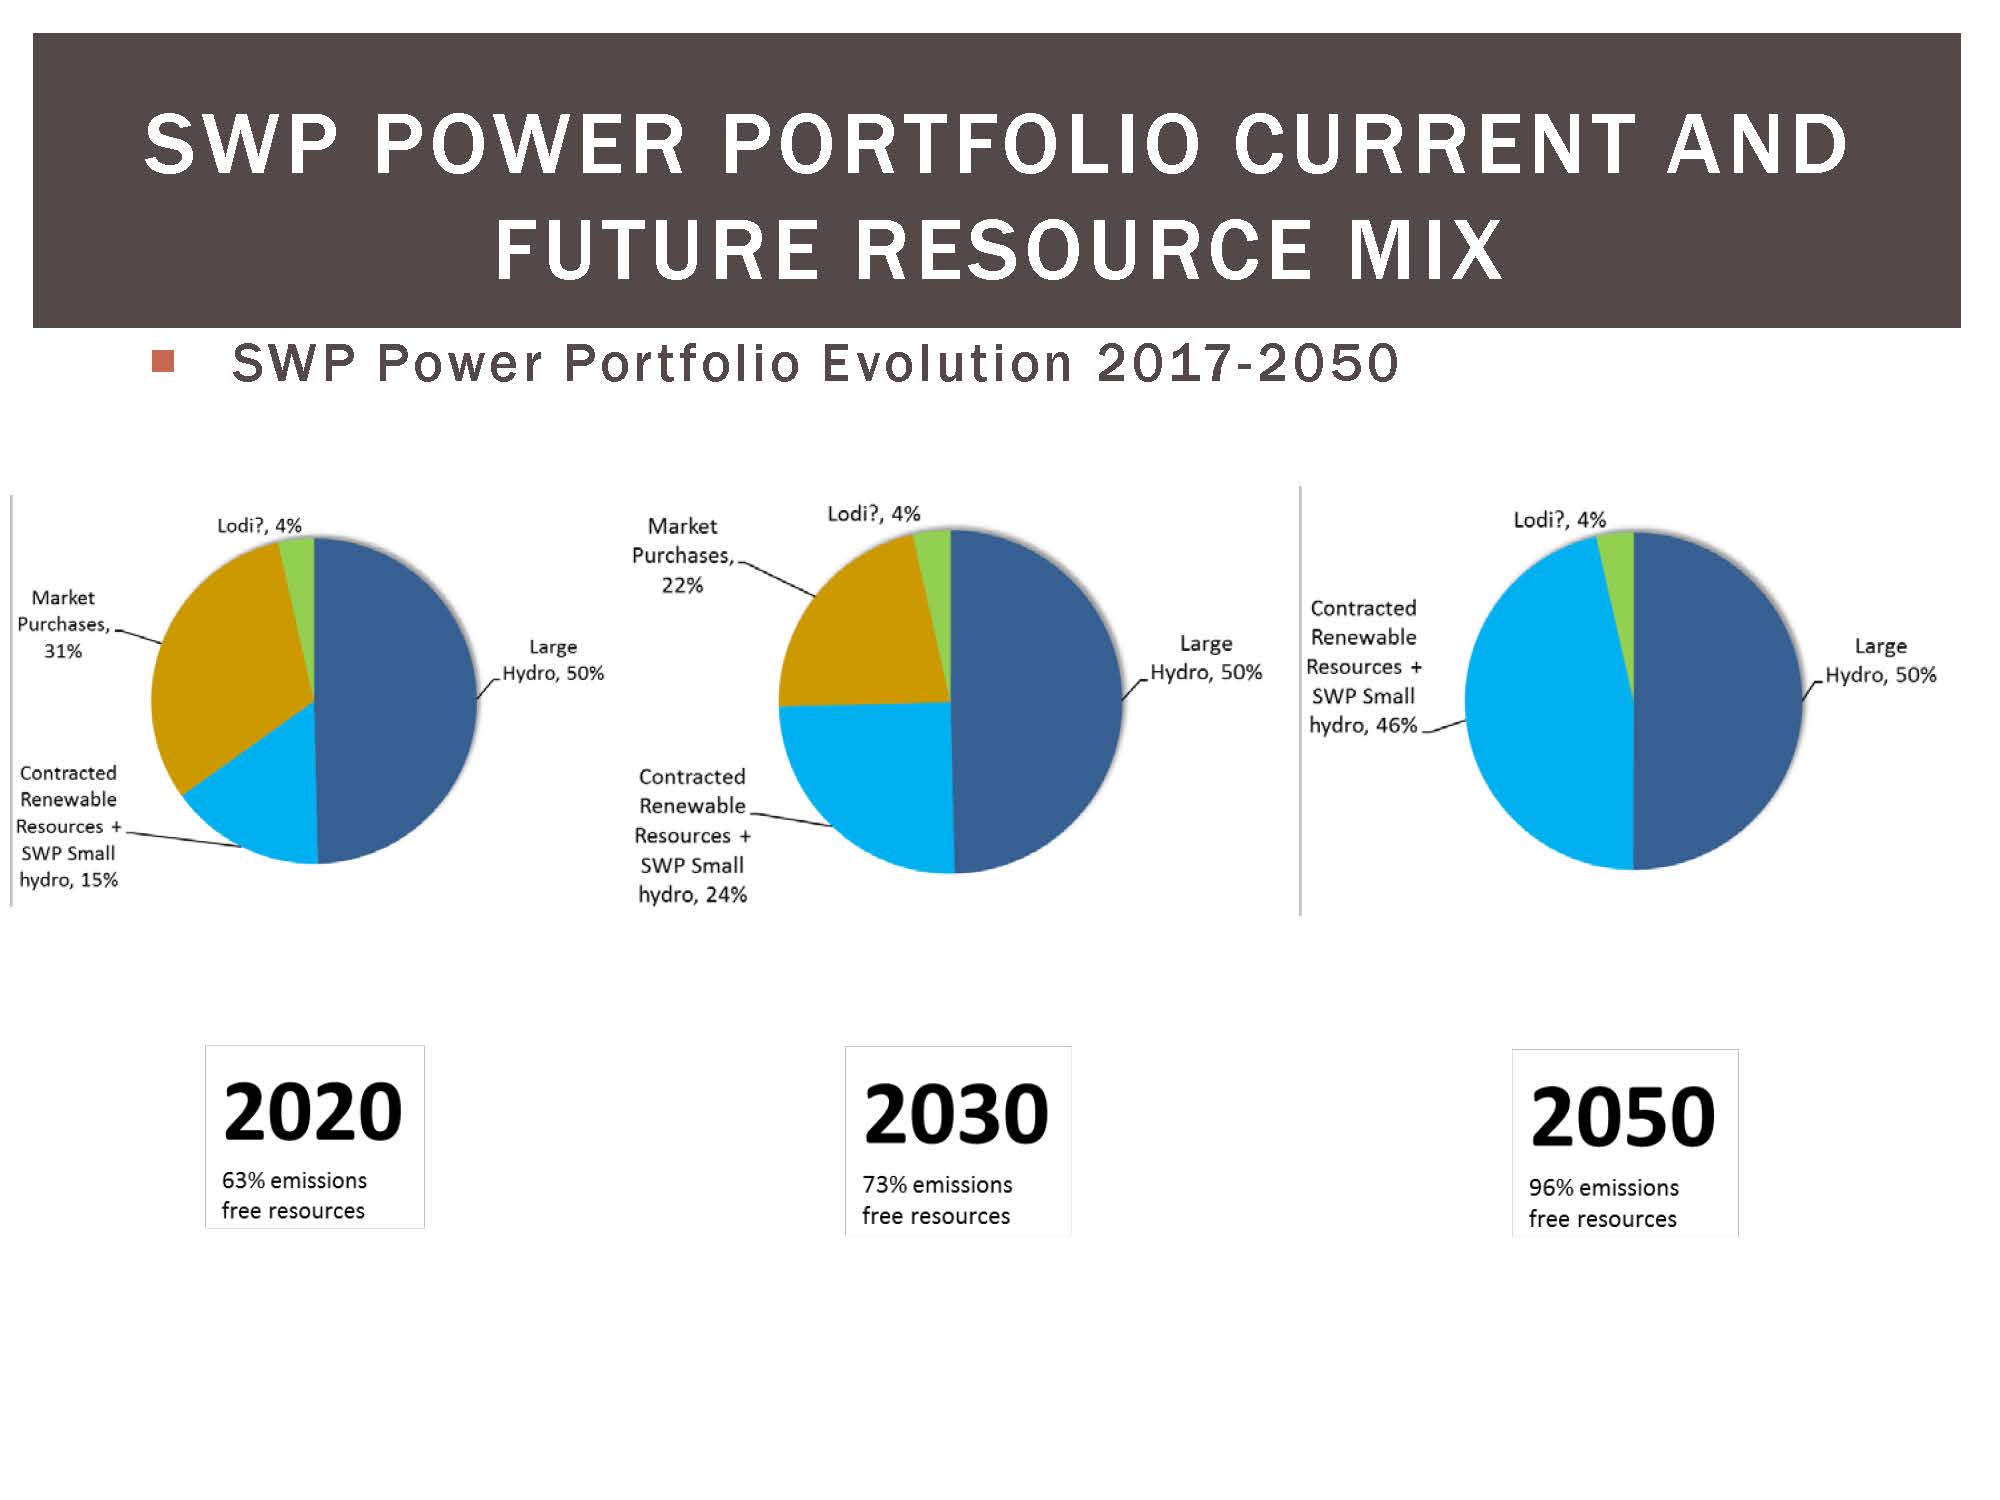 The State Water Project produces 1544 megawatts of hydroelectric power, which is enough to meet about 50% of the project’s energy needs. Currently for the remainder, 15% of the energy needs come from long-term contracts with other zero-emission resources, such as hydroelectric power from Pine Flat Dam, solar power generation, and small hydro generation with Metropolitan Water District. The State Water Project also has a 100 megawatt share of the Lodi Energy Center, a combined cycle plant that was entered into a contract to replace some of the Reed Gardner generation. The residual comes from market purchases, which are either mid-term or short-term purchases to reconcile energy needs based on the hydrology of the specific year.
By 2030, the share of renewables and share of emissions from contracts will go from the 15% to 24%, shrinking market purchases and reducing greenhouse gas footprint. By 2050, the Department should have 95% or better in zero emission resources in the portfolio.
FOR MORE INFORMATION …
- For agenda, meeting materials, and webcast for the November meeting of the California Water Commission, click here.
- Click here to download the California Aqueduct Subsidence Study.
- For more on the Department of Water Resources’ Greenhouse Gas Emissions Reductions Program, click here.
 Sign up for daily email service and you’ll never miss a post!
Sign up for daily emails and get all the Notebook’s aggregated and original water news content delivered to your email box by 9AM. Breaking news alerts, too. Sign me up!
