

 Dr. Michael Dettinger takes a data dive into the impacts of the California drought

California, currently in its fifth (and possibly sixth) year of severe drought, is now identified with large shifts towards persistent dry periods, separated by large storms, and accompanied by record-breaking warm temperatures. These conditions are characteristic of droughts projected to accompany climate change.
At a brown bag seminar held in September of 2016, Dr. Michael Dettinger, a Senior Research Hydrologist for the USGS National Research Program, presented his analysis of the multi-year deficits that have accumulated during this drought including deficits in precipitation, snowpack, streamflow, reservoir storage, and hydropower generation. Dr. Dettinger said he had dug into these questions because he was trying to understand which parts of the system were being hit hard by the drought, and which ones weren’t, and to trace the drought influences through the state’s water systems.
STATE OF BAY DELTA SCIENCE
But first, Dr. Dettinger quickly previewed the upcoming chapter from the State of Bay Delta Science. “Honest to God, there’s not much you’re going to read in that chapter that’s going to knock your socks off or be particularly new,” he said. “We’ve been telling you these things for a good 15 to 20 years, and the fact that we’re still telling you these things should be a source of some confidence building in the sense that we’re not changing our story every year. We really have converged on our story frankly quite a while ago, and we need to take it seriously.”
These things include warming by a couple of degrees Celsius by mid-century, and by about 4 degrees by end of century; sea level rise from 80 centimeters, perhaps a meter or more, and with high-end projections that go two or three times that, depending on who you want to listen to, he said.
What will happen to annual precipitation remains a conundrum, with half the models going one way for Northern California, and half the models going the other way. “The one thing that we pried apart in recent years is a better understanding of how the extremes play out,” he said. “There’s a near unaniminity among projections that we’ll have more dry days up here in this part of the world on the whole and those dry days will come at the expense, not of the largest storms but of the kind of middling storms. At the same time that we’re having more drier days, our largest storms become more ferocious, basically. So we have this vision of a future where that drought is punctuated by even nastier storms than California’s used to, and all the consequences from there: more rain, less snow, earlier snowmelt, larger storm driven floods, longer warmer summers, increased wildfire risk, and so on.”
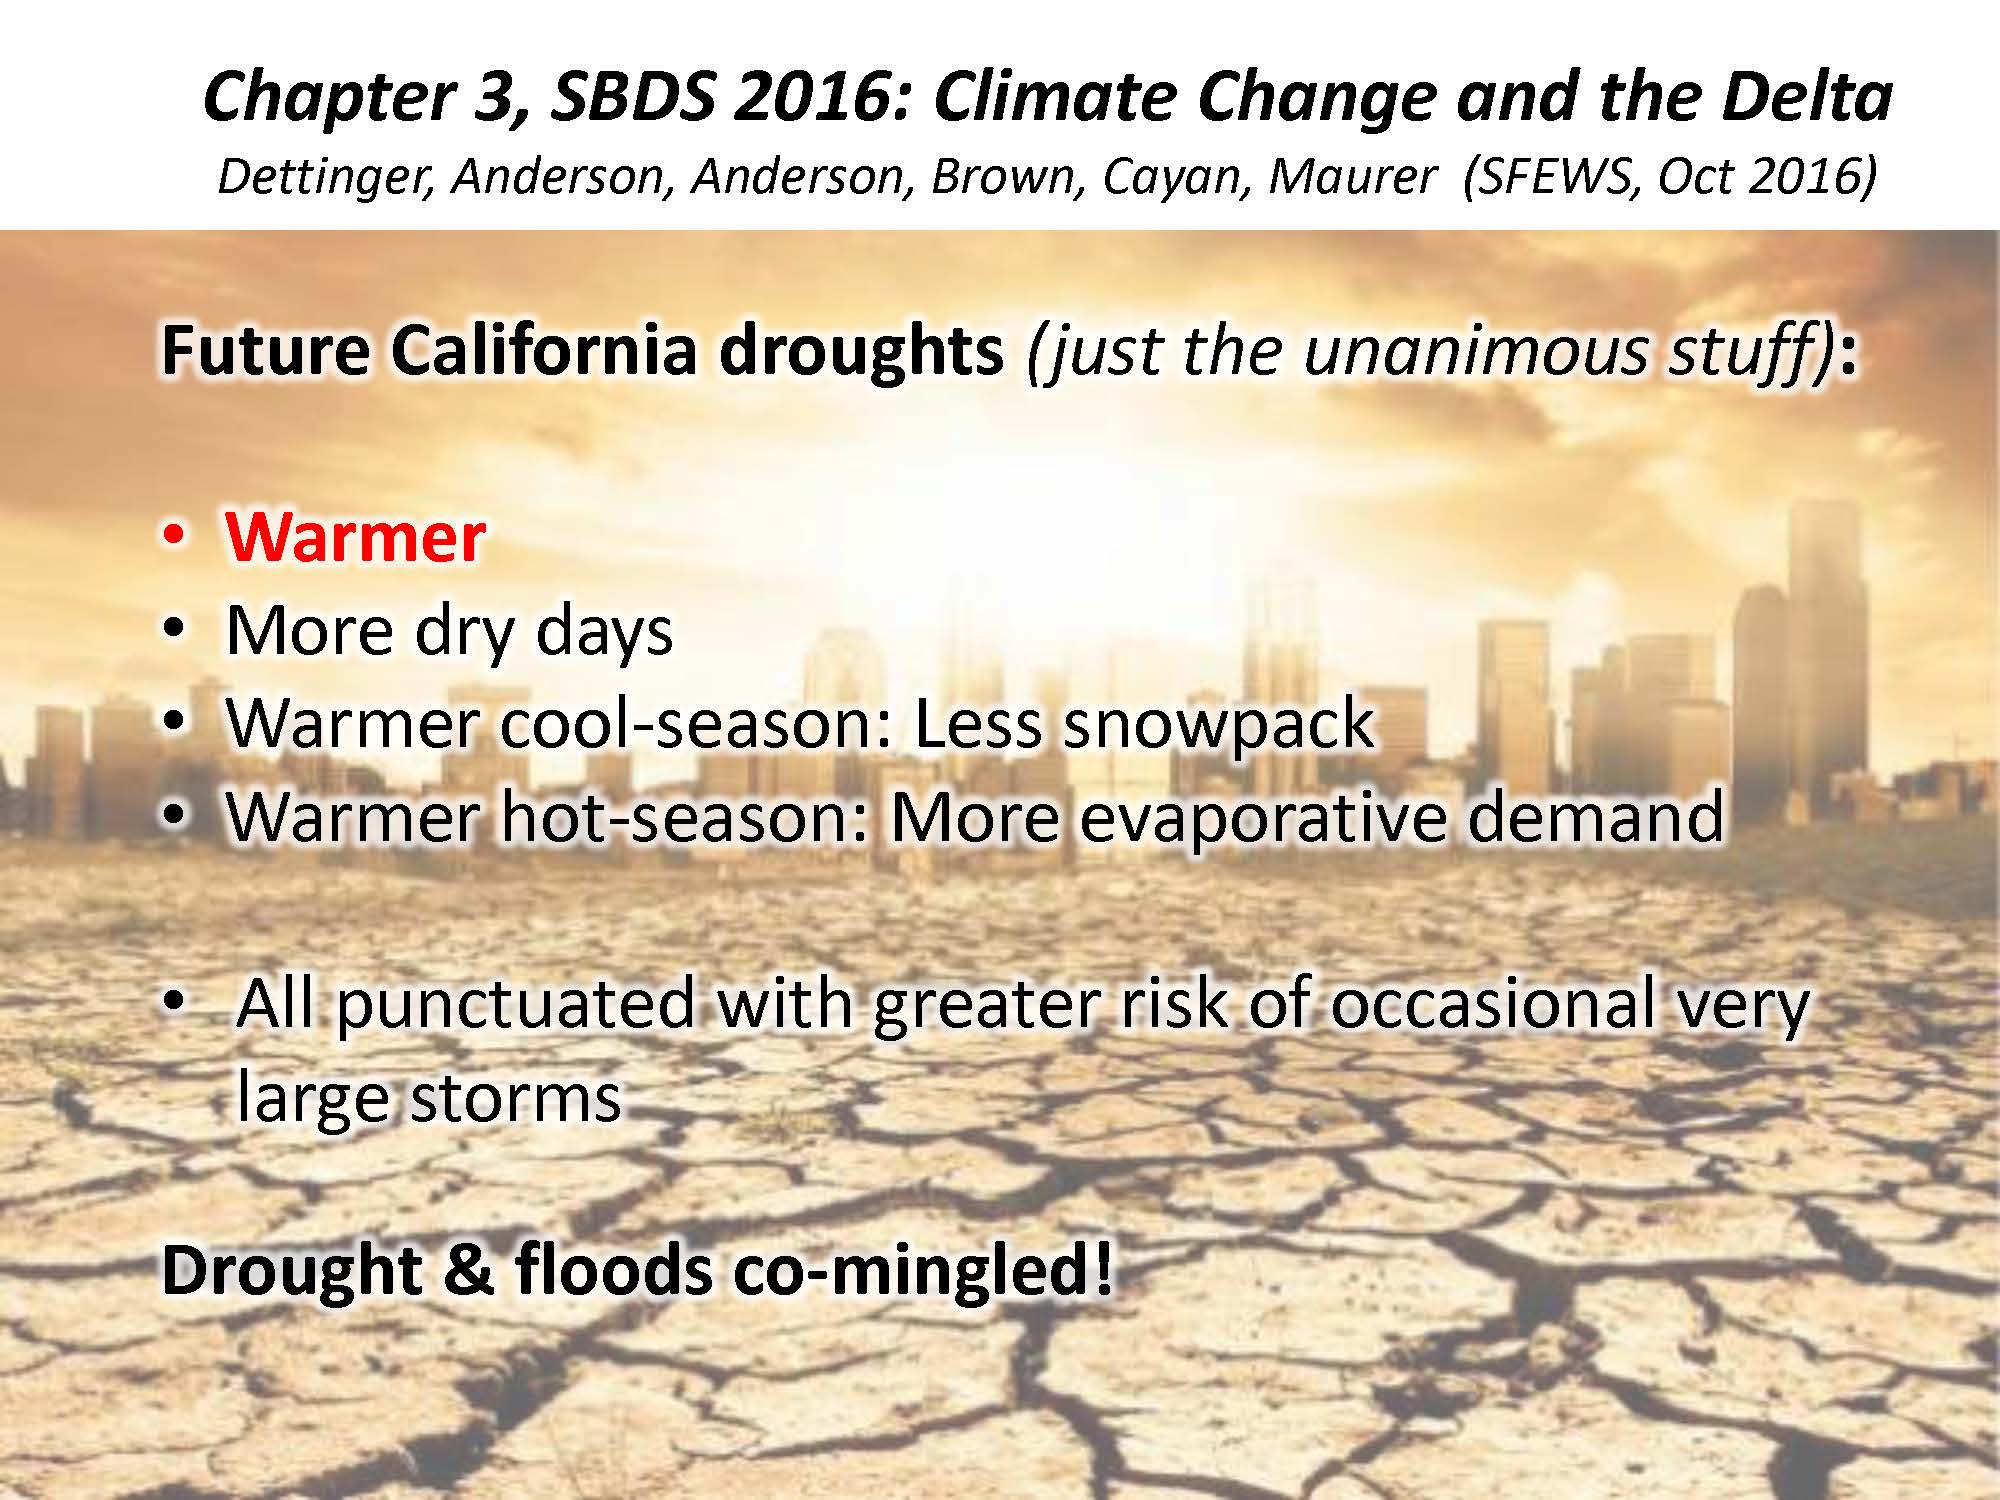 Dr. Dettinger then recapped the climate change projects on which there is unanimous agreement: Warmer and more dry days; a warmer cool season and less snowpack, and not so unanimous is how much lack of precipitation feeds into that, he said. “A warmer hot season with more evaporative demand, and that’s a little bit controversial, because usually we phrase the problem of what happens to water demand by vegetation in terms of warmer temperatures and the like, but playing against carbon backside in which the warmer tends to make for more water demand and the carbon fertilization tends to counteract that, but I put it among my more or less unanimous stuff because we typically don’t toss into that mix in a longer growing season. That’s going to be the big Kahuna in terms of what happens to our overall demand. I don’t know how the balancing act of between evaporative demand will play off against carbon backside fertilization, but I think that the growing seasons are going to ramp up our overall evaporative demand.”
“It’s all punctuated greater risk of occasionally very large storms, so that we have this future of warm droughts and floods,” he said.
THE CURRENT DROUGHT
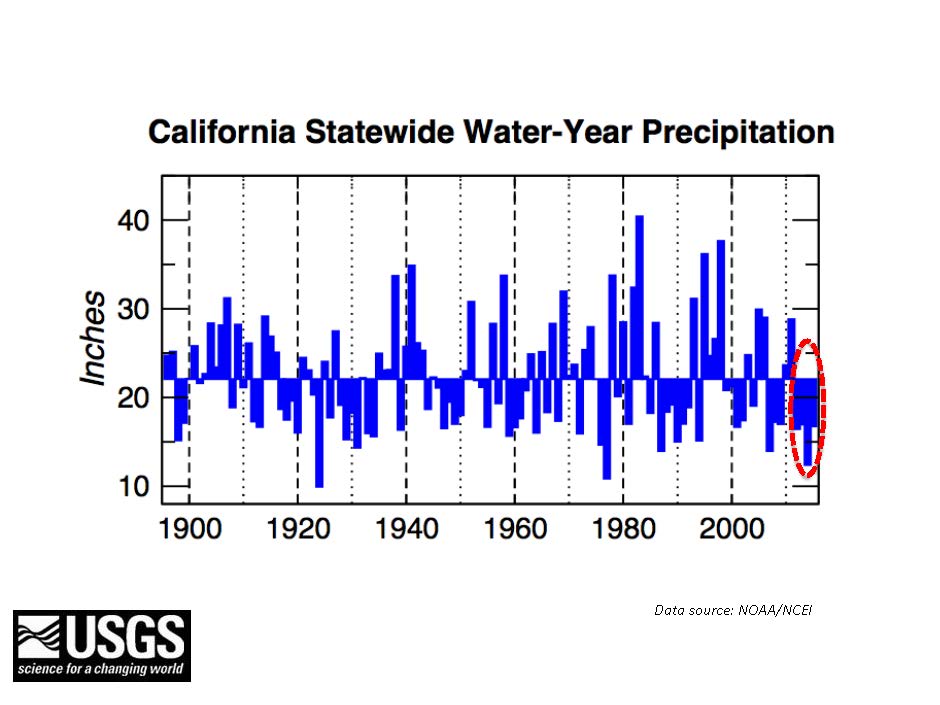 Dr. Dettinger began his analysis of the current drought by presenting a slide showing statewide water year precipitation from 1895 to 2015, noting that the bars pointing down means its less than the long-term normal for that period and the bars above the line were wetter than normal.
“You can see out there the drought that we’re in,” he said. “We’ve been in a long dry spell here. I should note the bar that is the lowest there is 2014 which was the driest of the bunch, but it’s not the driest on a water year basis in the historical record; there are a couple of others that are drier.”
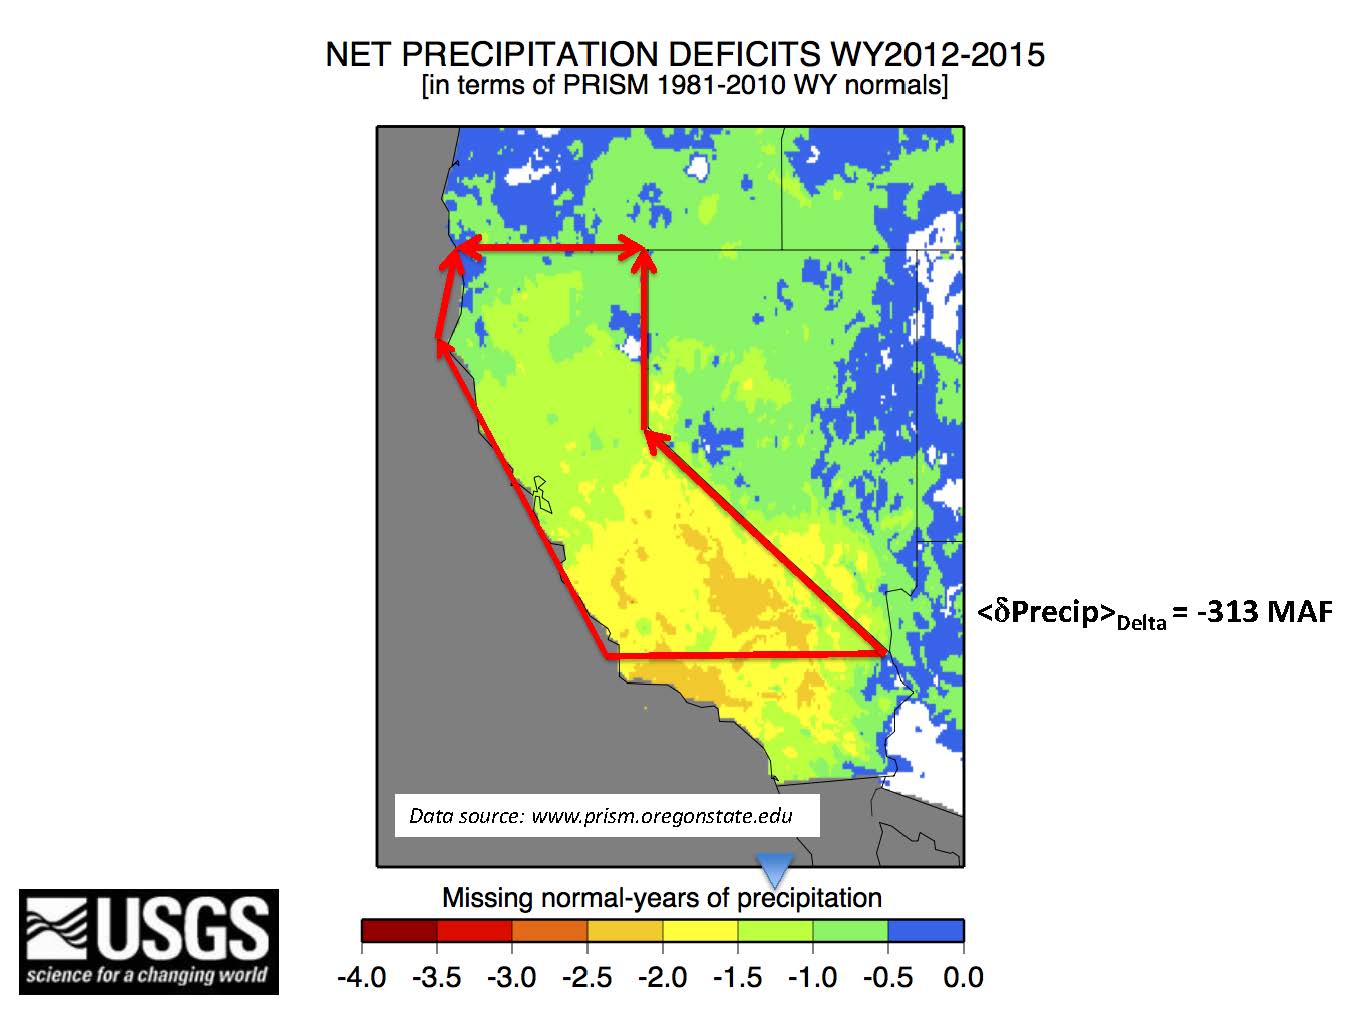 He next presented a map showing the accumulated precipitation deficit below the long-term normal amount over the four water years from 2012 to 2015. “The way that I’ve mapped these out is that I just accumulated them over the four years and ask how many normal years worth of precipitation are we behind over the course of that four years,” he said. “The blue colors are places where we’re basically not very behind, if at all. The white colors are where we are a little bit ahead over the four years; the green colors are in the vicinity of anywhere from a year behind over those four years; yellow which is in the vicinity of two years, and up towards the red and deep red is four years, which you don’t see there on the map.”
Dr. Dettinger said he was trying to get the sense of how that feeds through California’s water system, and so the way he came at it is very simple minded: “I just put a bunch of numbers into the same units, and one of the units I’m going to use is this missing normal years of whatever – streamflow, snowpack, hydroelectric generation, those sorts of things.”
He said he also chose to put things into common units, and where he could, he added up how much water in total. “If you add up all those pixels, take them out of years behind normal, convert them back to millimeters and then do a little bit of conversion, I estimate the total missing water over those four years is about 313 MAF. If I integrate over that whole year and try to figure out how much water is missing in the missing years of water units, on average over that whole area, it basically about a year and a quarter behind.”
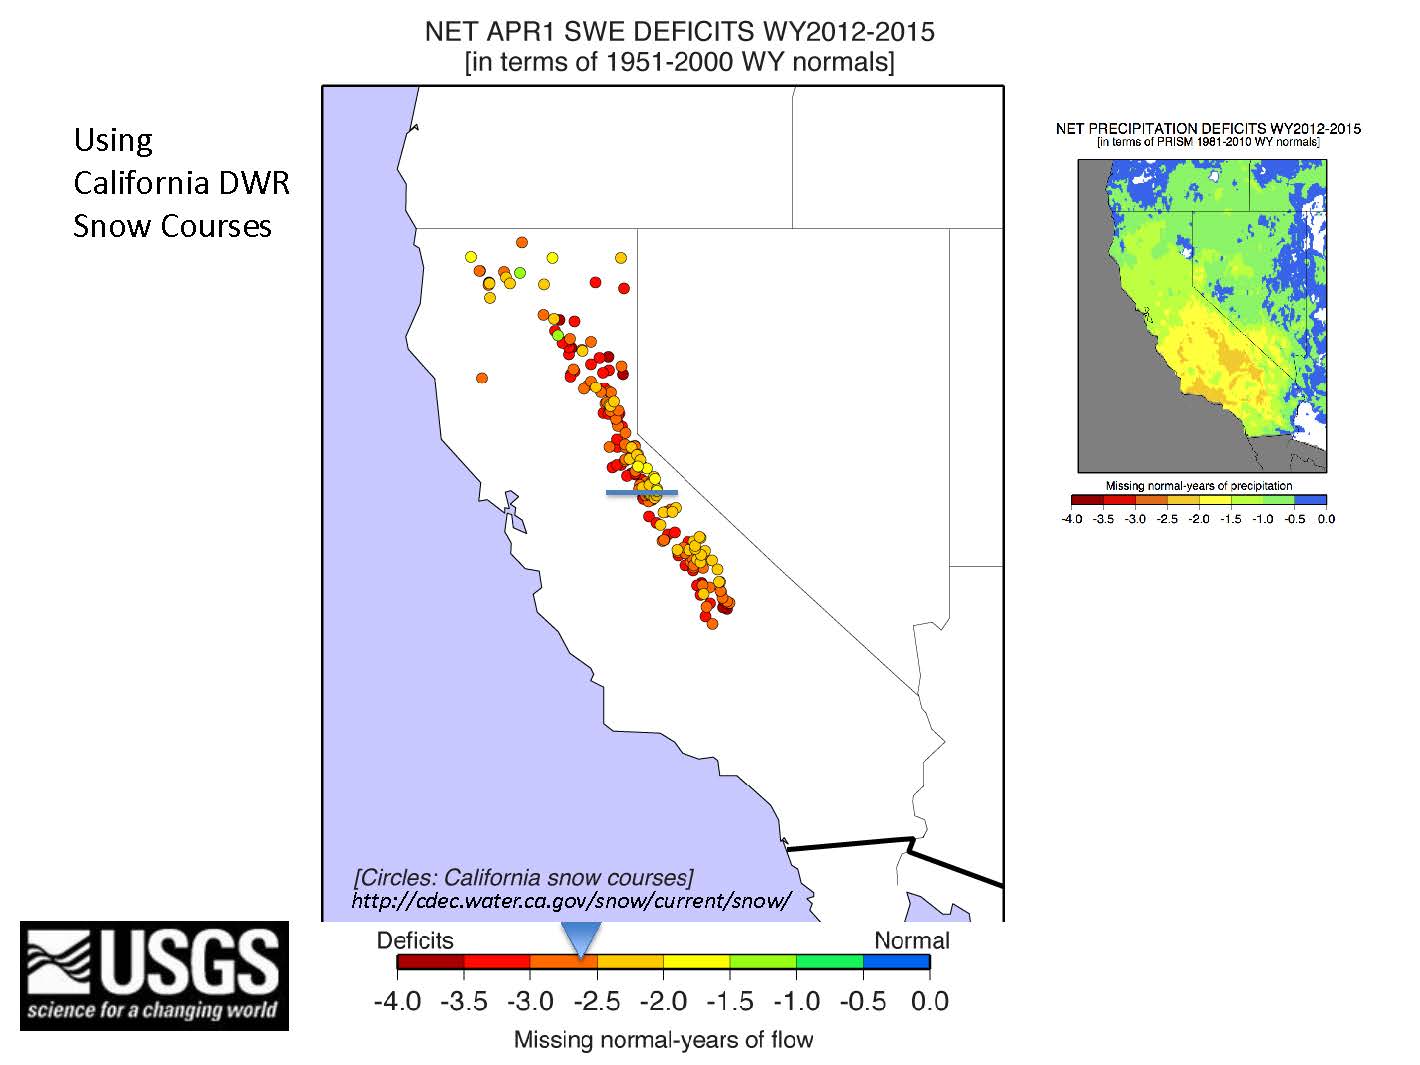 He next presented a similar graph showing just DWR’s snow courses, adding up for those four April 1st how much snow wasn’t there that in a long-term norm should be there. “If I add all those up, I stacking each year’s missing April 1 snowpack together, I basically end up with us being a little bit over two and a half years behind, so that’s considerably more than one and a quarter years that we saw for precipitation.”
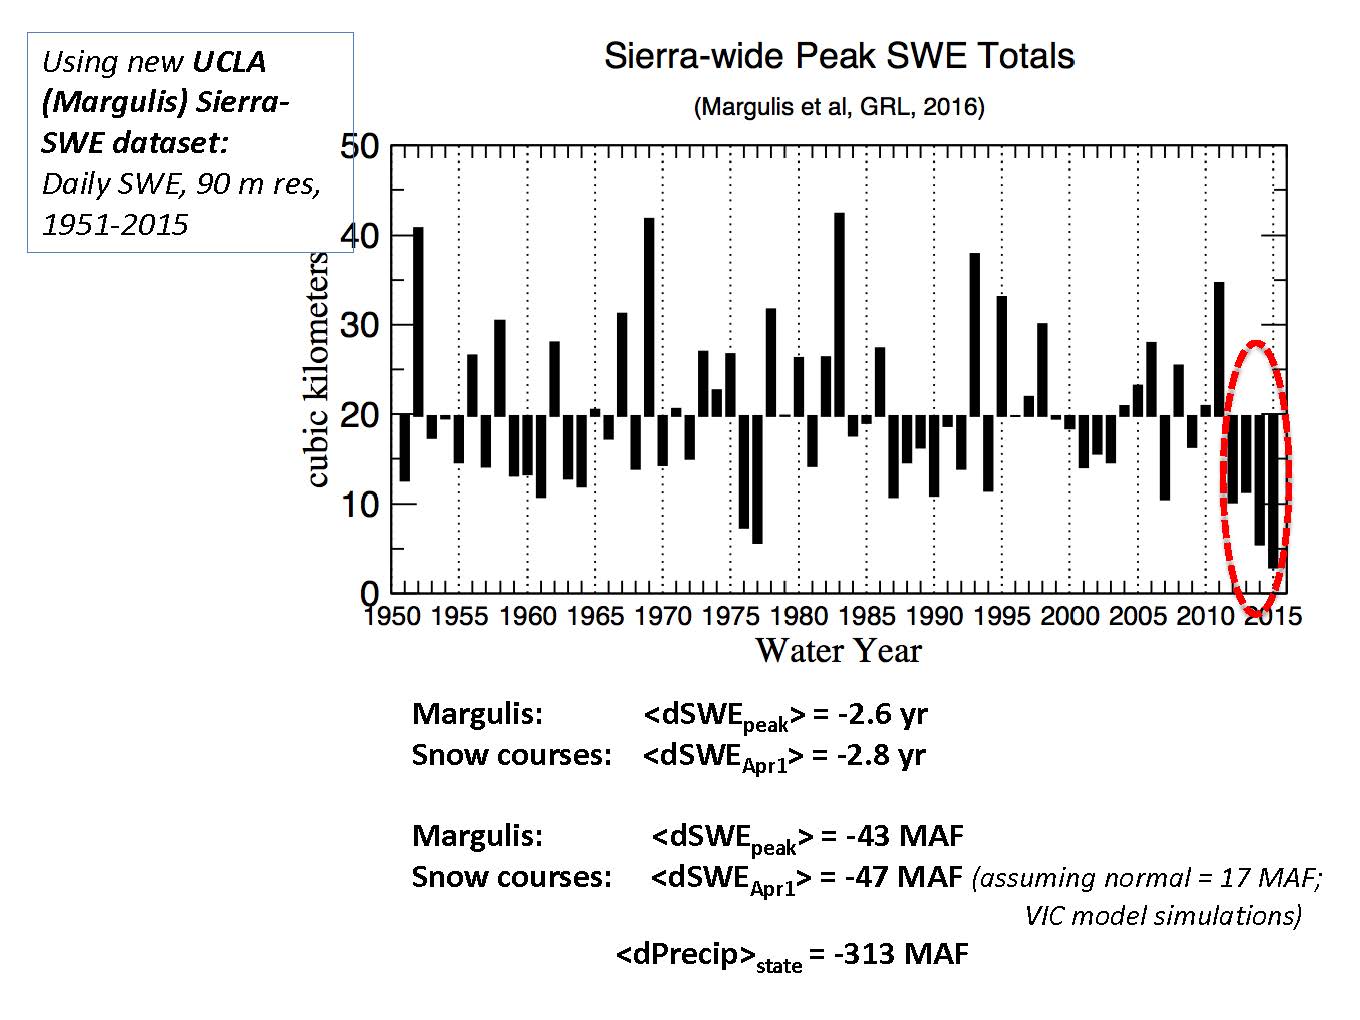 A new product from Dr. Dettinger’s colleagues at UCLA is a new Sierra Snow Water Equivalent dataset that has daily estimates of the snow water equivalent on 90 meter resolution across the whole of the Sierra Nevada from 1951 through 2015. Dr. Dettinger could only obtain summary statistics, which is plotted on the slide.
“This is the modern version of the snowcourse data that I just showed you. Each year at each pixel he picks out what the SWE was during that whole year, and you just aggregate those … That’s the time series there, and of course you can see the drought sticking out. The numbers at the bottom … I still come up with something in the vicinity of 2.7ish years behind, and if I convert everything into million acre-feet, I’m in the vicinity of about -45 MAF of snow behind, compared again to the missing snowpack, which was 300+ behind.”
Streamflow
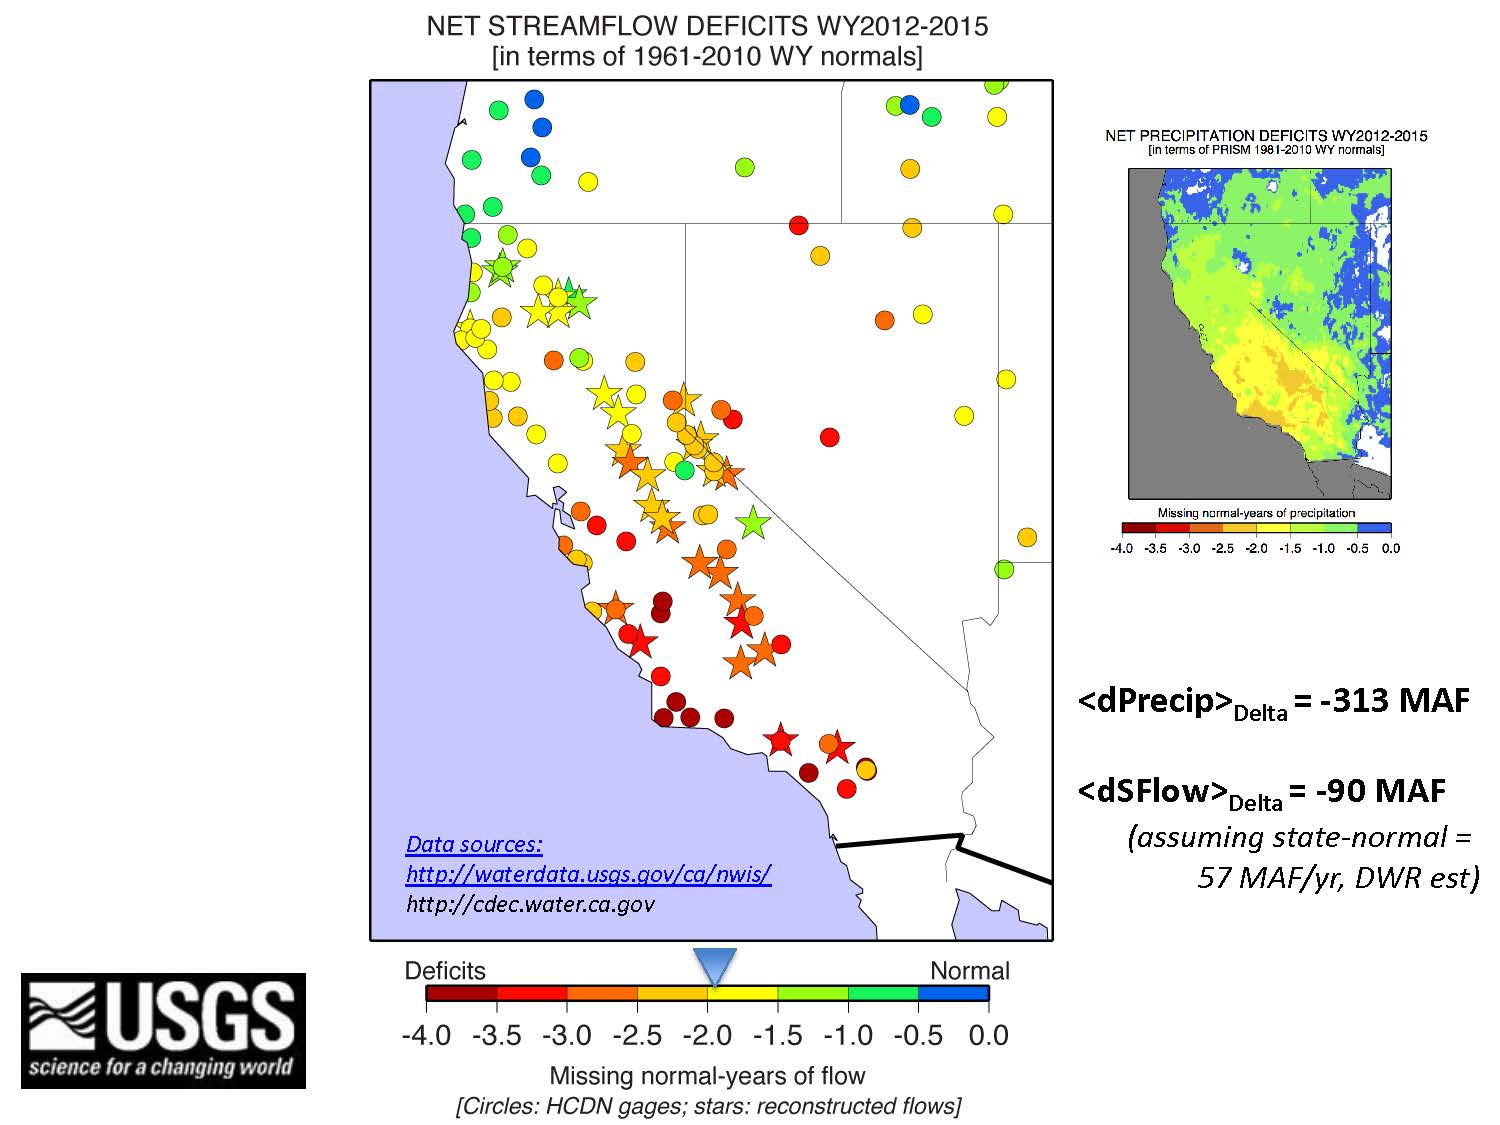 He then presented streamflow accumulated in the same way, explaining that this is estimating how much streamflow that hasn’t been there at stream gauges that would have been there under normal conditions over that 2012-2015 period. He said for this calculation, he used two different data sets. One is the USGS HCDN (Historical Climate Data Network), indicated by circles on the map, which are a set of stream gauges which have no dams and few if any diversions upstream, so they are measuring more or less natural conditions. The other set are DWR’s Full Natural Flows, indicated by stars on the map; these are records, often on the largest rivers, where DWR has tried to back out all those human influences and come up with their best shot at what the natural flows would have been.
“In terms of streamflow in these missing year units, it’s about 2 years behind,” he said. “Snowpack was about two and a half; precipitation was about one and a half, and you can see over there, in millions of acre-feet of water per year … I come up with a number that’s about -90 MAF of water. That’s not how much is missing at all those gauges, that’s taking those gauges and scaling up to the best estimates from DWR in terms of how much water is normally generated in that area, so there’s a certain amount of scaling going on there.”
Reservoir Storage
He then presented a plot showing the amount of water stored in a large number of reservoirs, which includes the state’s largest reservoirs and a number of smaller ones, but by nowhere near all of them. “This is my best shot at a representative sample, and what’s being mapped out here, is each month, what is the percentage of water in that total amount of reservoirs, compared to the long term normal for that month of year.”


He pointed out the current drought. “2011 was quite a wet year, so our reservoirs were quite full, well above normal, reached almost 140% of normal, and then we went into the drought, and we basically get down there to a little bit above 50% of normal,” he said. “Taking that apart and only looking at the end of year water storage, how much water do we have available to carry us into the following winter. Basically if I accumulate the deficit the way that I have all the other variables so far, I end up with a number that looks to me like about minus 21 MAF of water that’s been missing as carryover water over those four years.”
Hydropower
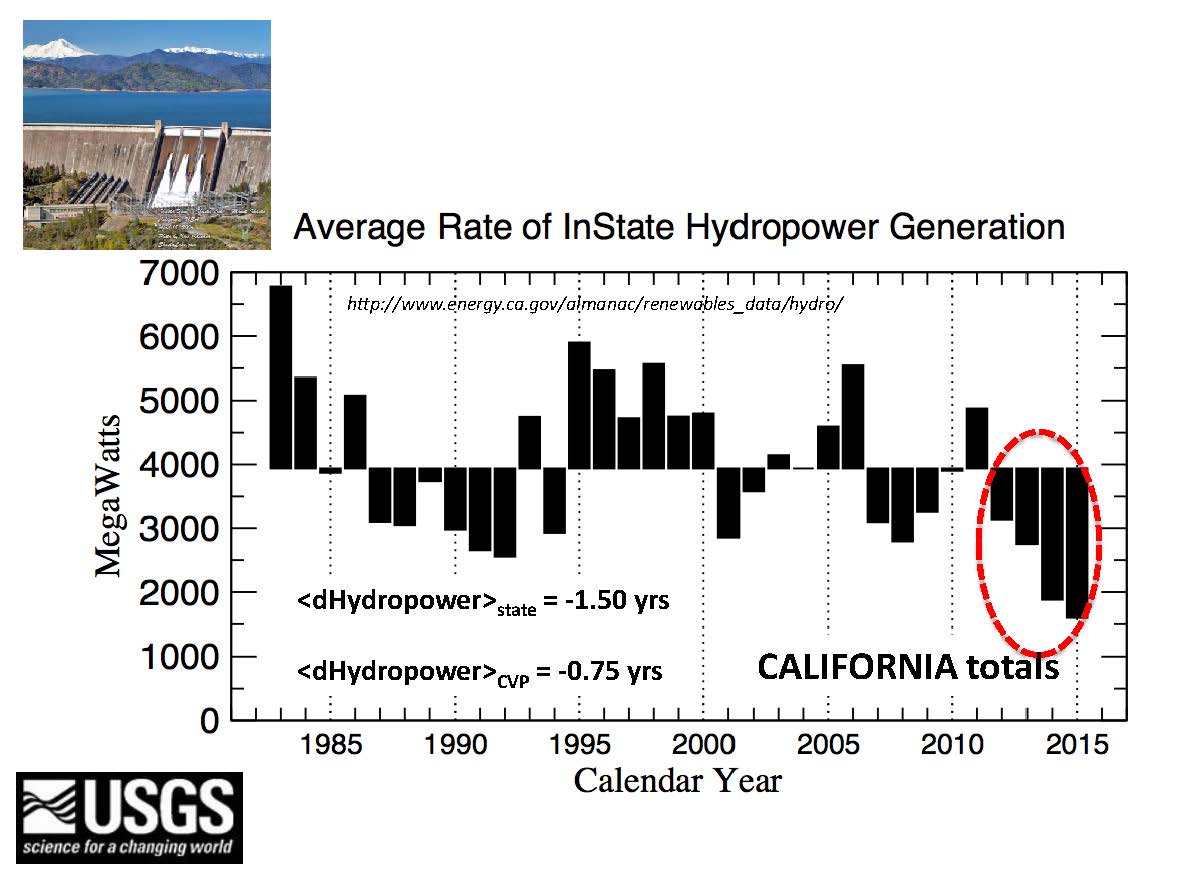 He then presented a slide showing hydroelectric power production treated the same way. “From the state as a whole, the estimate is that we are about a year and a half behind normal hydroelectric power production during the course of the four years drought from 2012 to 2015,” he said. “For the Central Valley Project, power generation is about three-quarters of a year behind.”
Delta outflow
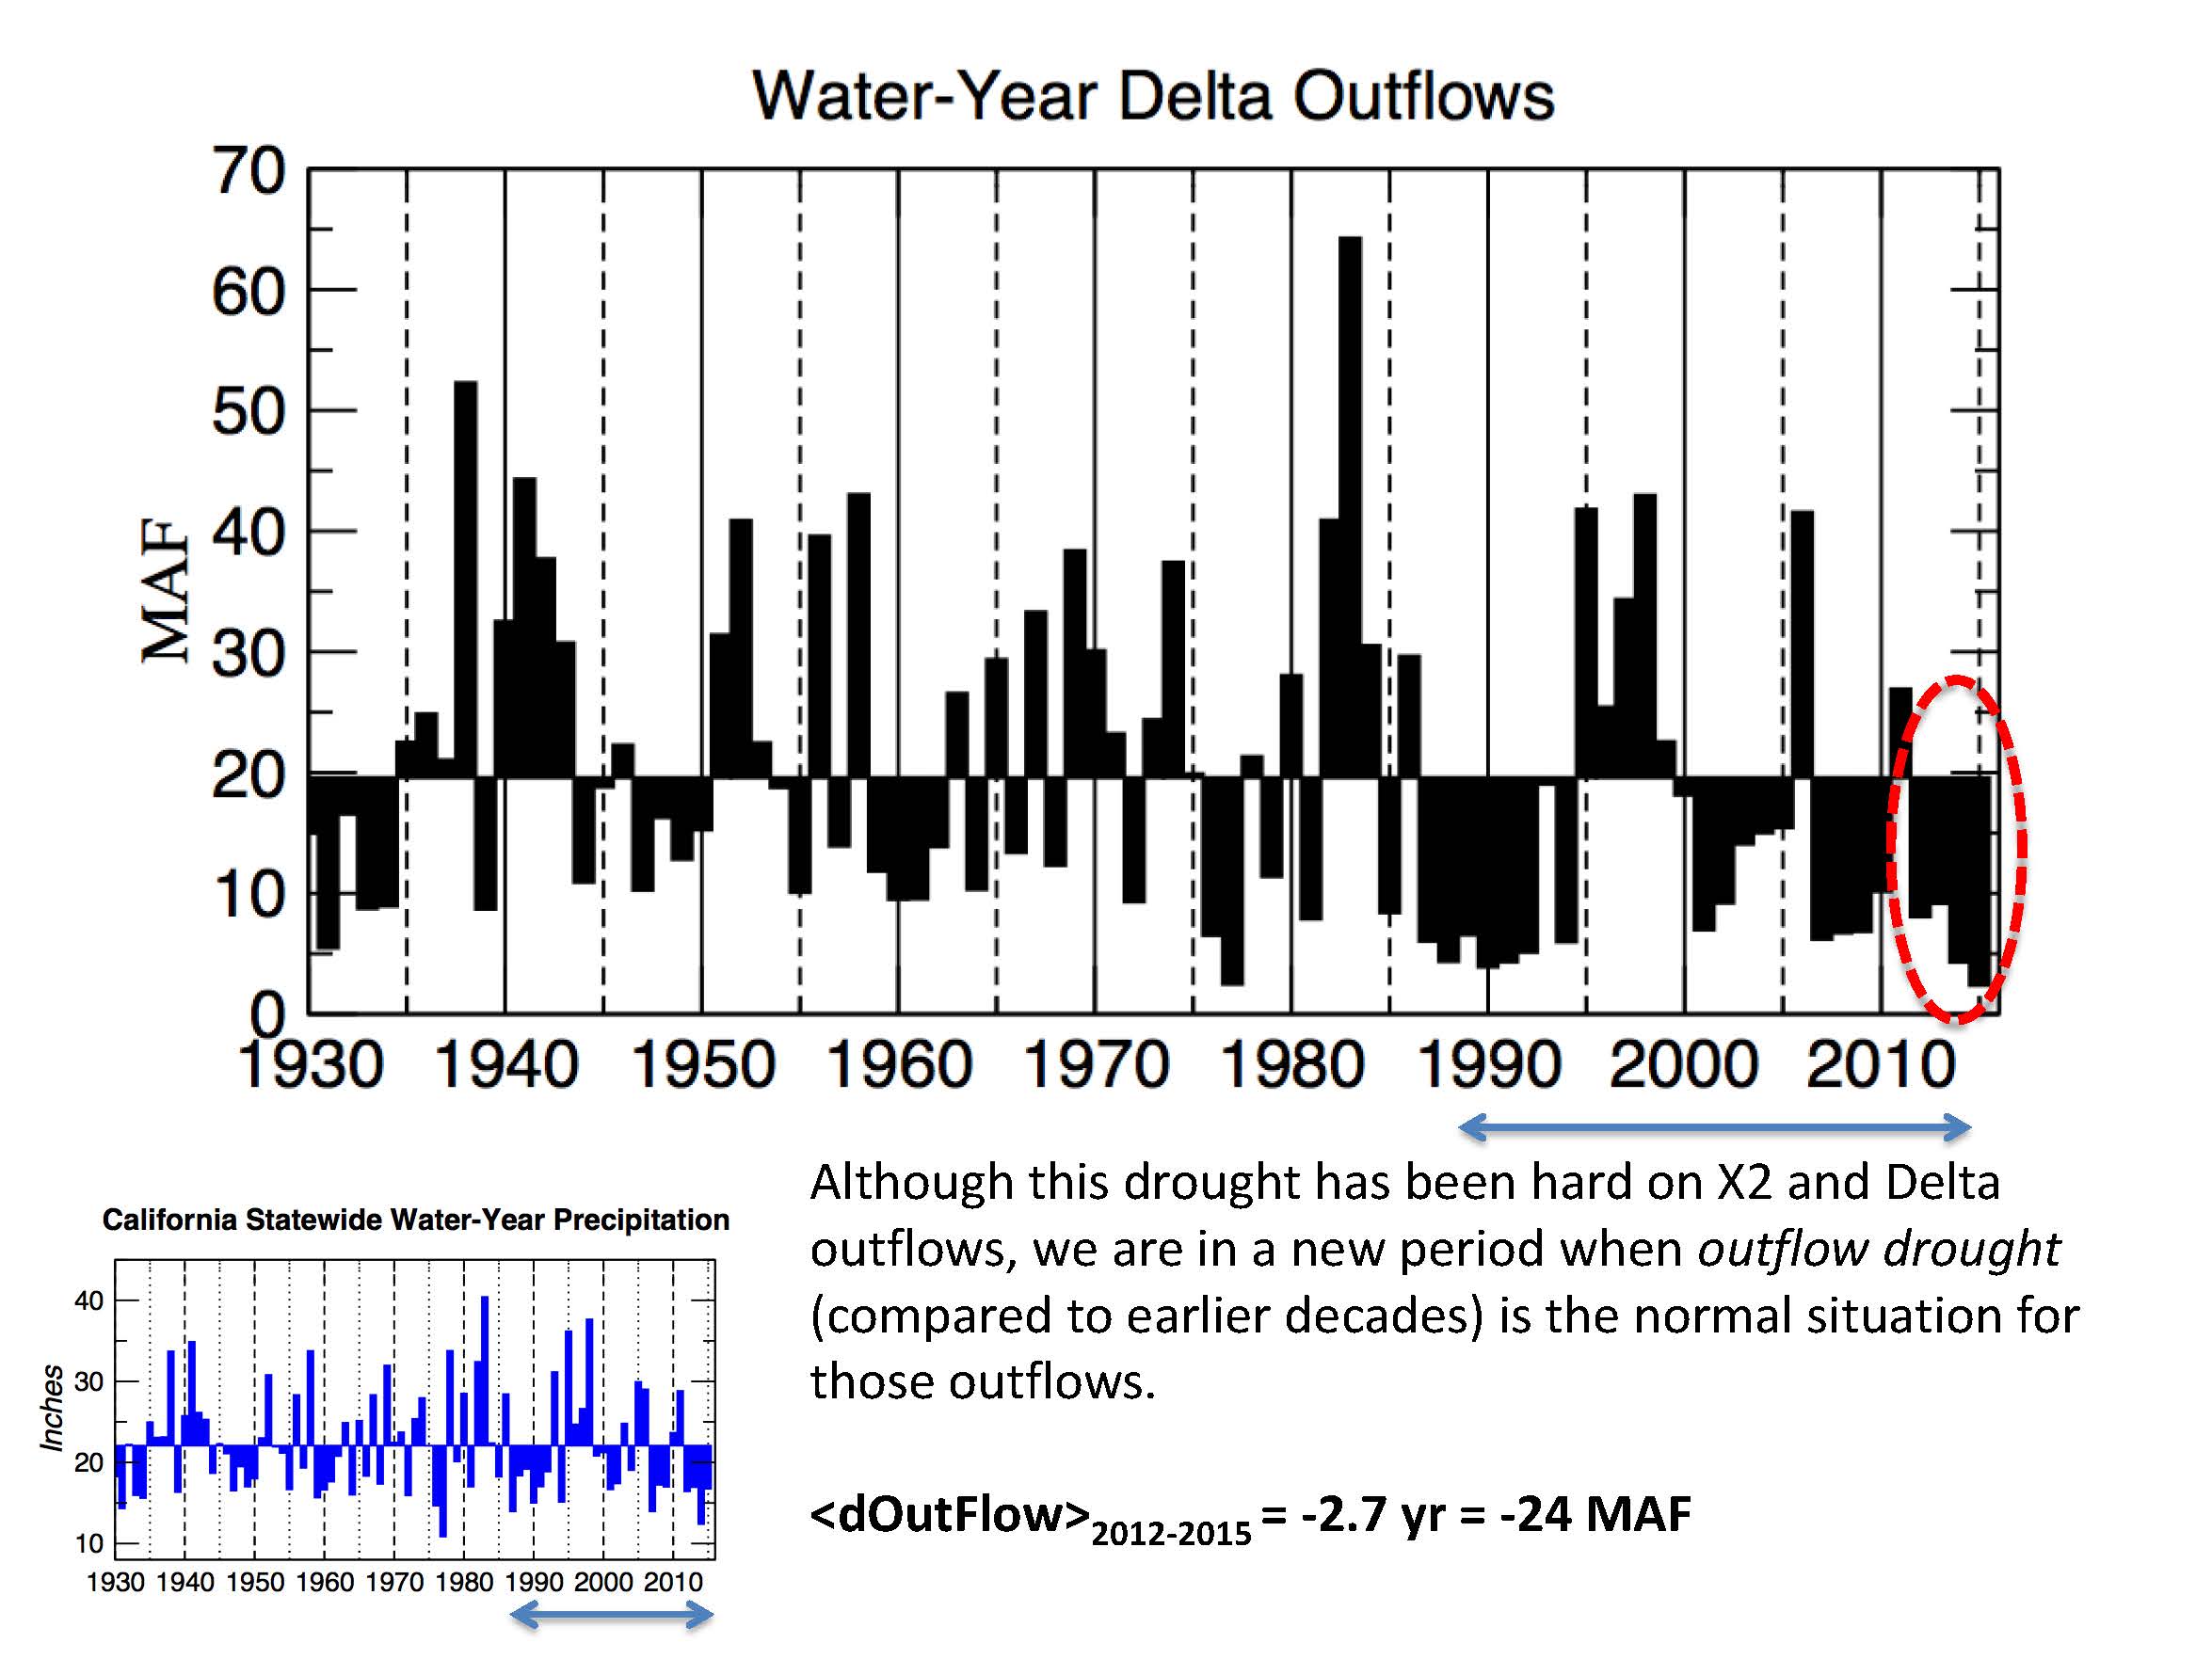 He then presented a graph that shows Delta outflows plotted from Day flow. “The current drought is a period when Delta outflows have been quite low, but for me what’s really remarkable is that it doesn’t stick out as quite the sore thumb as it has in a lot of the time series we’ve looked at, such as the late 2000s, which was a period when the outflows was almost as low,” he said. “In the early 2000s, basically from about 1987 on, we’re in a period there where it’s really low flows as compared to the historical normal for this period, with the occasional wet year that manages to push out some serious Delta outflow.”
“Again, converting everything I can into the same units, the accumulated Delta outflow deficit has been about 2.5 to 2.7 years behind over those years and about 24 MAF of water behind,” he said.
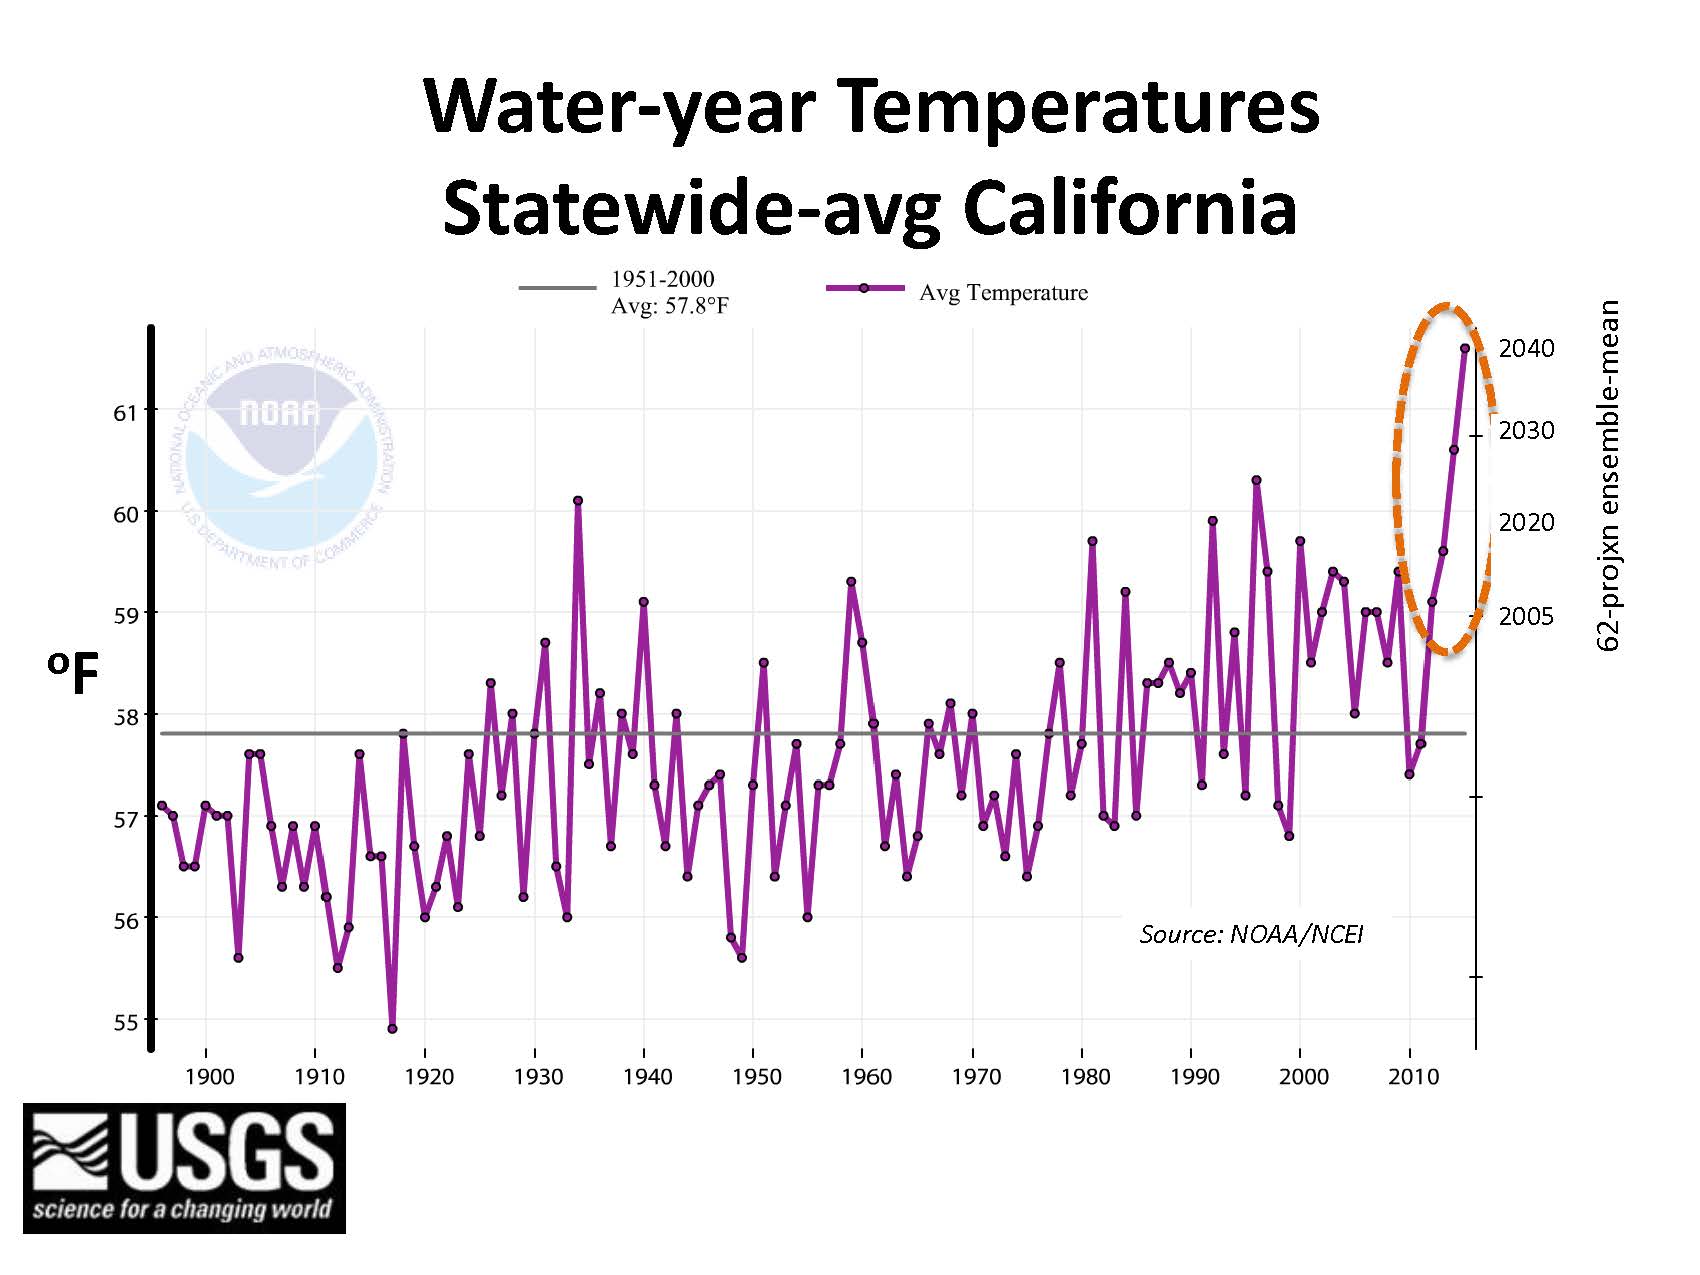 Dr. Dettinger pointed out that although there have been precipitation deficits, this has also been a record breaking warm period. He presented a graph showing statewide average temperatures from 1895 to present day, noting that the dashed oval shows how the temperatures during this drought have left the historical record behind. He noted that he relabeled the axis on the far right with how far in time you have to go in a 62-member ensemble of climate change to reach the same temperatures. “The 2015 temperatures, we wouldn’t expect in this 62-member ensemble until 2040, so we’re getting a little glimpse of what the future might look like in 2015; temperatures have also been record-breakingly high.”
Dr. Dettinger pointed out that precipitation totals haven’t been record-breakingly low, but the temperatures have been recording breakingly high during that period.
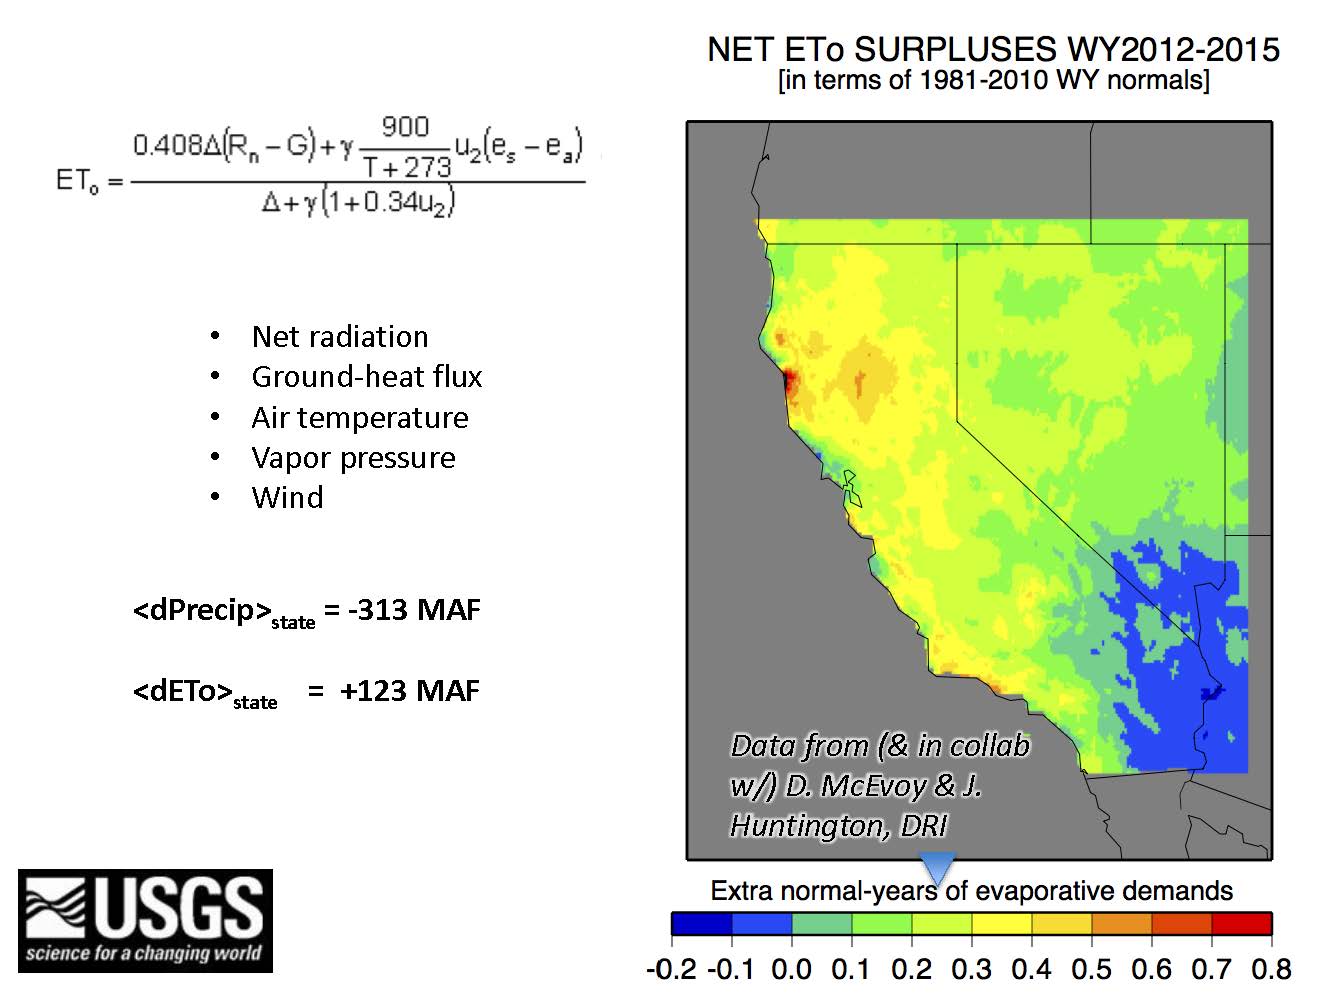 “We generally talk about droughts in terms of how much precipitation isn’t there, but with these warmer temperatures, what I’m mapping here is changes in daily evaporative demands for water, which is basically the amount of evaporation and transpiration you would get from a well watered lawn through time,” he said. “In other words, how much water would be going back up into the atmosphere. Think your Palm Springs golf course, it’s sucking up the water into the atmosphere. In this case, because the temperatures are high, the evaporative demand is higher than normal.”
He noted that his calculation doesn’t take soil moisture or precipitation into account. “This is just what the temperature and the solar radiation, the humidity of the air, the wind speeds, and all those other things – how much water they sort of put the atmosphere into a position to accept, or to suck out of the ground.”
He pointed out that the bar is differently colored than the others. “I’ve been showing you all along with the precipitation and everything else to date, numbers that went from 0 on the right there over to about – 4 on the left. These are smaller numbers and their positive also, because it’s surplus rather than a deficit, so we’re looking at about two and a half years over my polygon, about two and a half years extra evaporative demand averaged over that entire area.”
Dr. Dettinger said that is about 123 MAF of extra water. “The smaller numbers on the color bar actually translate into some big pretty numbers here, and that’s because our evaporative demand is typically 2 to 3 times our precipitation almost anywhere you go. A normal year is a bigger number with evaporative demand.”
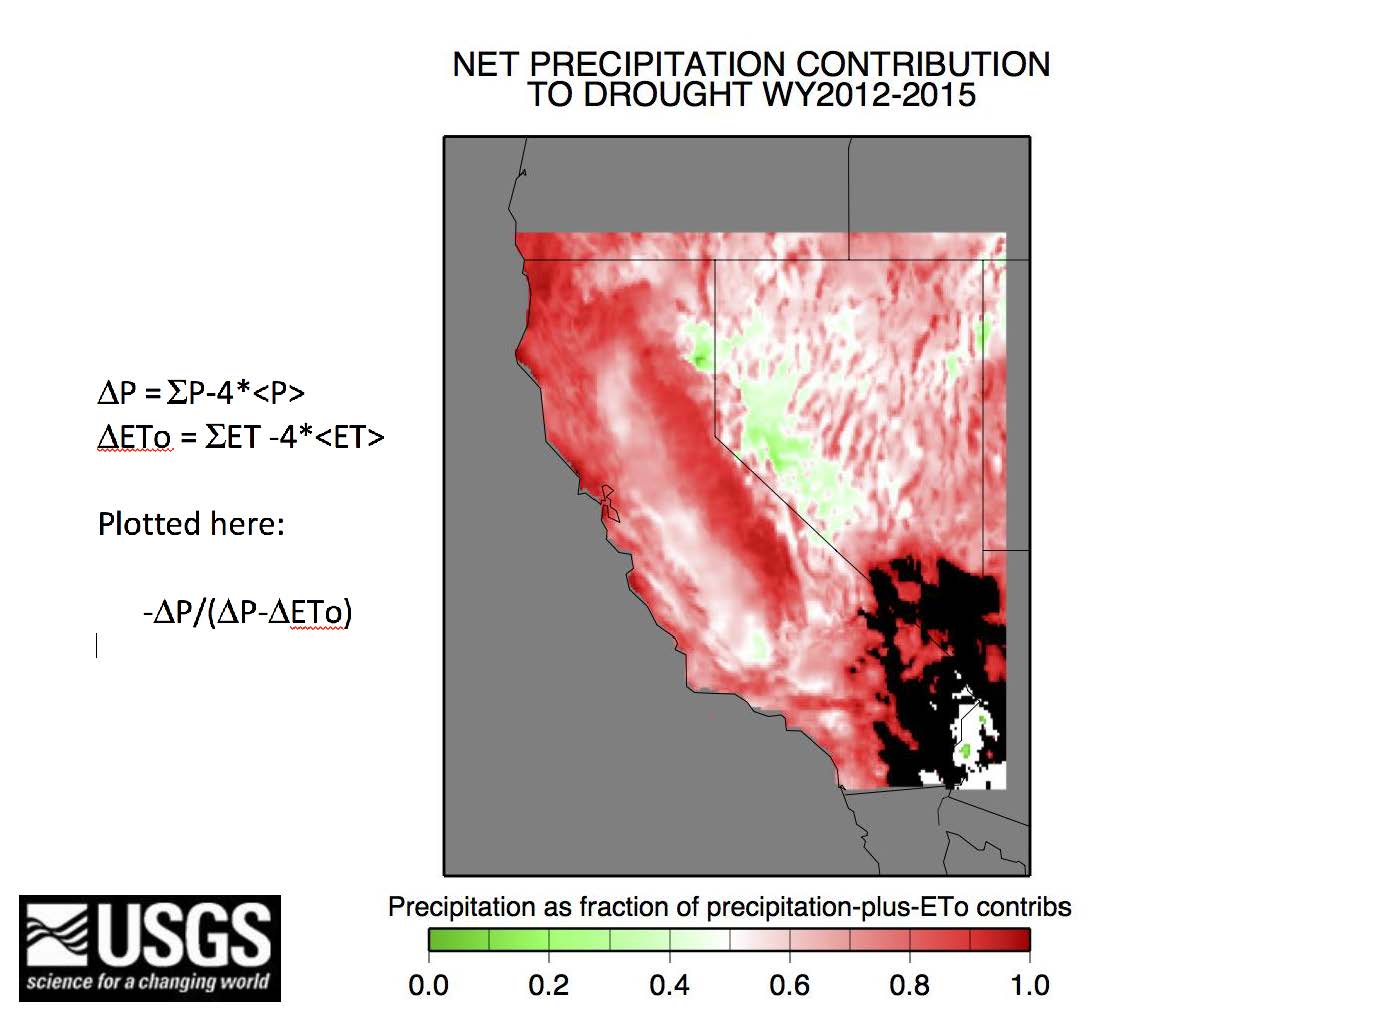 “I’ve shown you the precipitation as a deficit, and the evaporative demand as a surplus,” he said. “For me it’s only natural to want to know which is bigger, and which is bigger where. What I’m doing here, and this is kind of flaky … I took the extra evaporative demand, and took the precipitation deficit, and added them up and said this is a measure of how much of this combined drought there is.”
“Anywhere where it’s red on the map, the missing precipitation is the whole story; the evaporative demand is a small number compared to that,” he said. “Where it goes to white, they are almost the same magnitude, and finally when it gets into green, the evaporative demand is actually the big player in this drought. And so you see that in the Sierra and in the Coastal Range along the coast, the precipitation deficit is the story, and in part that’s because less evaporation can show up there, it’s higher, cooler, etc. In part, that’s where our big precipitation should fall and hasn’t been falling.”
Dr. Dettinger said he was surprised by these results. “Frankly, what I thought I’d be looking at when I mapped this out would be red everywhere, so it’d all be precipitation deficit, but when you look at the Central Valley, you can see the Salinas Valley, south of Monterey, this drought in the 2012-15 period has been both an evaporation drought if you will, and a precipitation drought. Over there in the rain shadow side of the Sierra, you see green showing up, so over there it’s been dominated more by the extra evaporative demand than by the precipitation.”
Groundwater
Dr. Dettinger lamented the lack of groundwater data currently available, so exact calculations of groundwater pumping are not possible. “An obvious question at this point is less streamflow, less snow, less water in the reservoirs, more evaporation, how much is the extra groundwater pumpage that’s been going on,” he said.
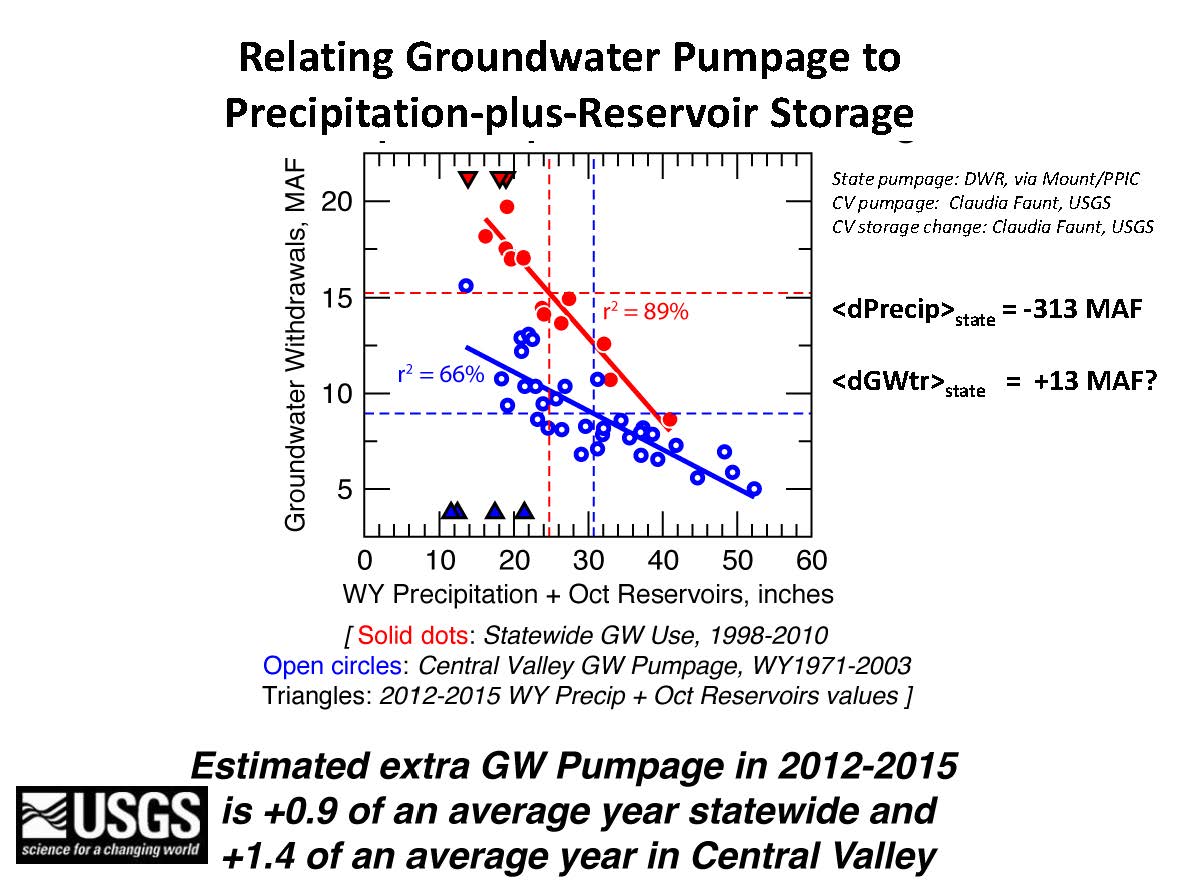 For this slide, Dr. Dettinger used relatively long-term records of groundwater pumpage; red lines are for the state as a whole, and blue for the Central Valley, he noted. “I asked how did they relate to the sum of the carryover water in the reservoirs from the year before, plus the amount of precipitation that fell in the year of the pumpage that’s being mapped here.”
He noted that for the state as a whole (shown in red), the R-Squared is 89%, meaning that much is explained, and for the Central Valley, the R-Squared is lower. “I’m not totally depressed by that number,” he said. “What I did do is I took the regression line, and basically these arrows up here at the top are basically for the last four years; I know the X value on this graph, but I don’t know the Y axis … , Then I just basically use the regression line to make an estimate of what the pumpage ought to look like basically on the basis of historically how its responded to the amount of water in the reservoir plus the precipitation.”
“So during the 2012-2015 period, with those two simple regression lines, you would say it’s roughly a year ahead of normal in terms of statewide groundwater pumping and about 1.4 years for the Central Valley,” he said. “And reading off that y axis and adding them up, it’s about 13.5 MAF of water. That is a crude way of trying to get at how much extra pumping we’ve done.”
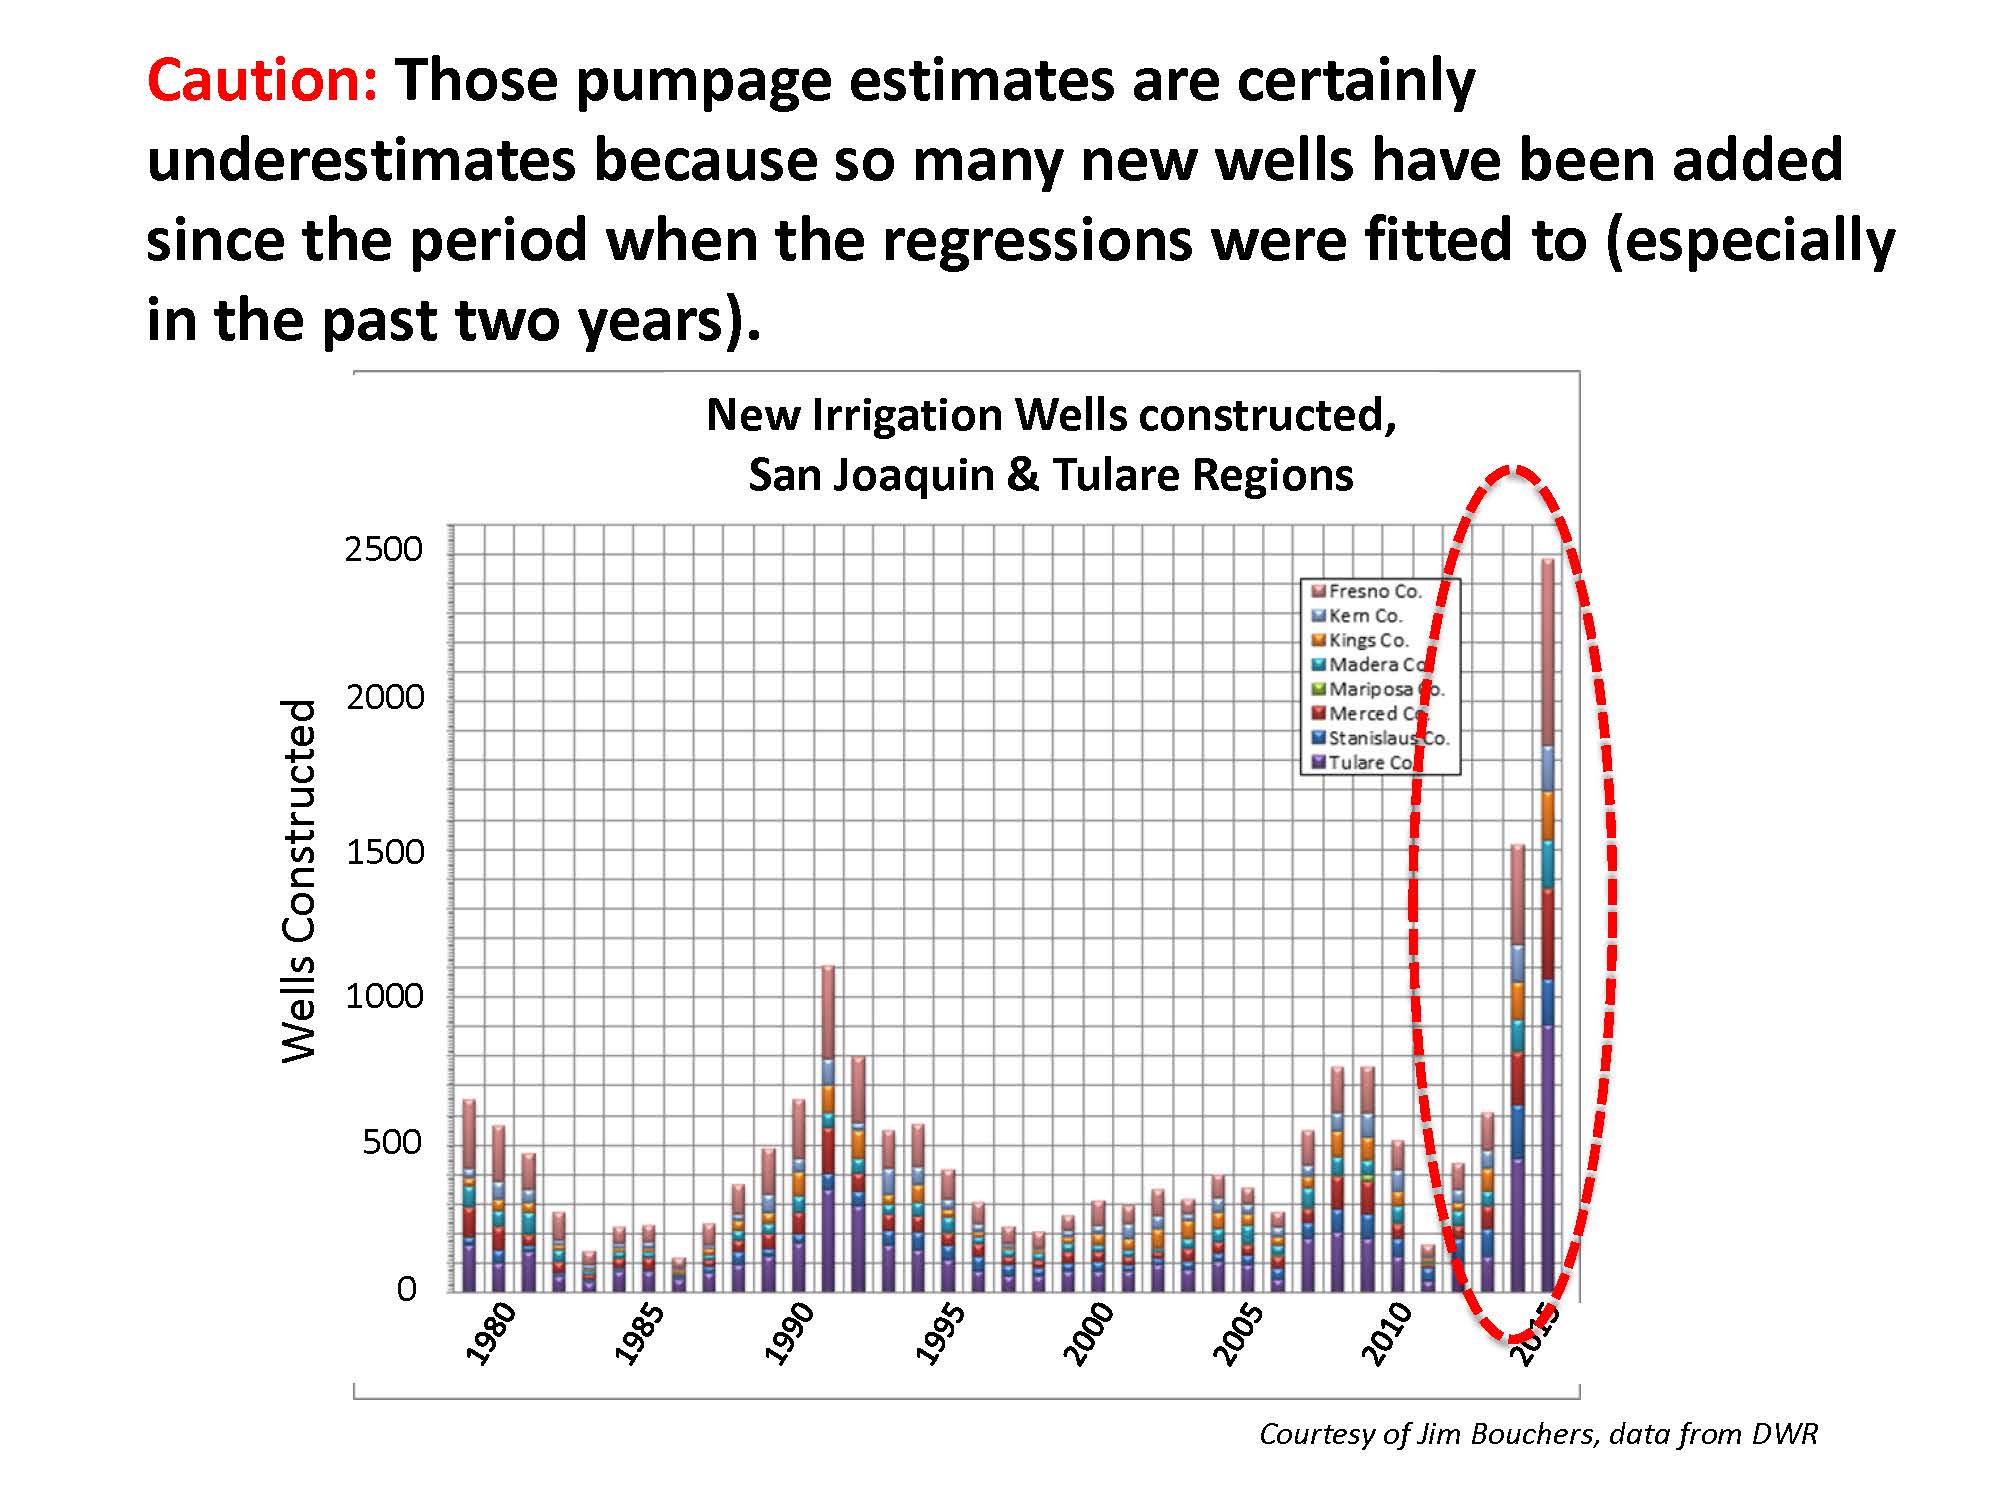 He pointed out that the estimates have to be conservative, as people have been putting in new wells at a rapid pace. “This slide shows new wells constructed by year from 1979 through 2015 for basically the San Joaquin and Tulare, so basically the southern 2/3rds of the Central Valley. And you can see for the last couple years, it’s really taken off,” he said. “This isn’t total number of wells, this is how many new ones have been added, so it’s actually looks like three or four times as many going in per year now as has happened historically. So with all these new wells going in that are not captured here, these estimates are conservative.”
“That’s probably the worst way to describe it,” he added. “These are low.”
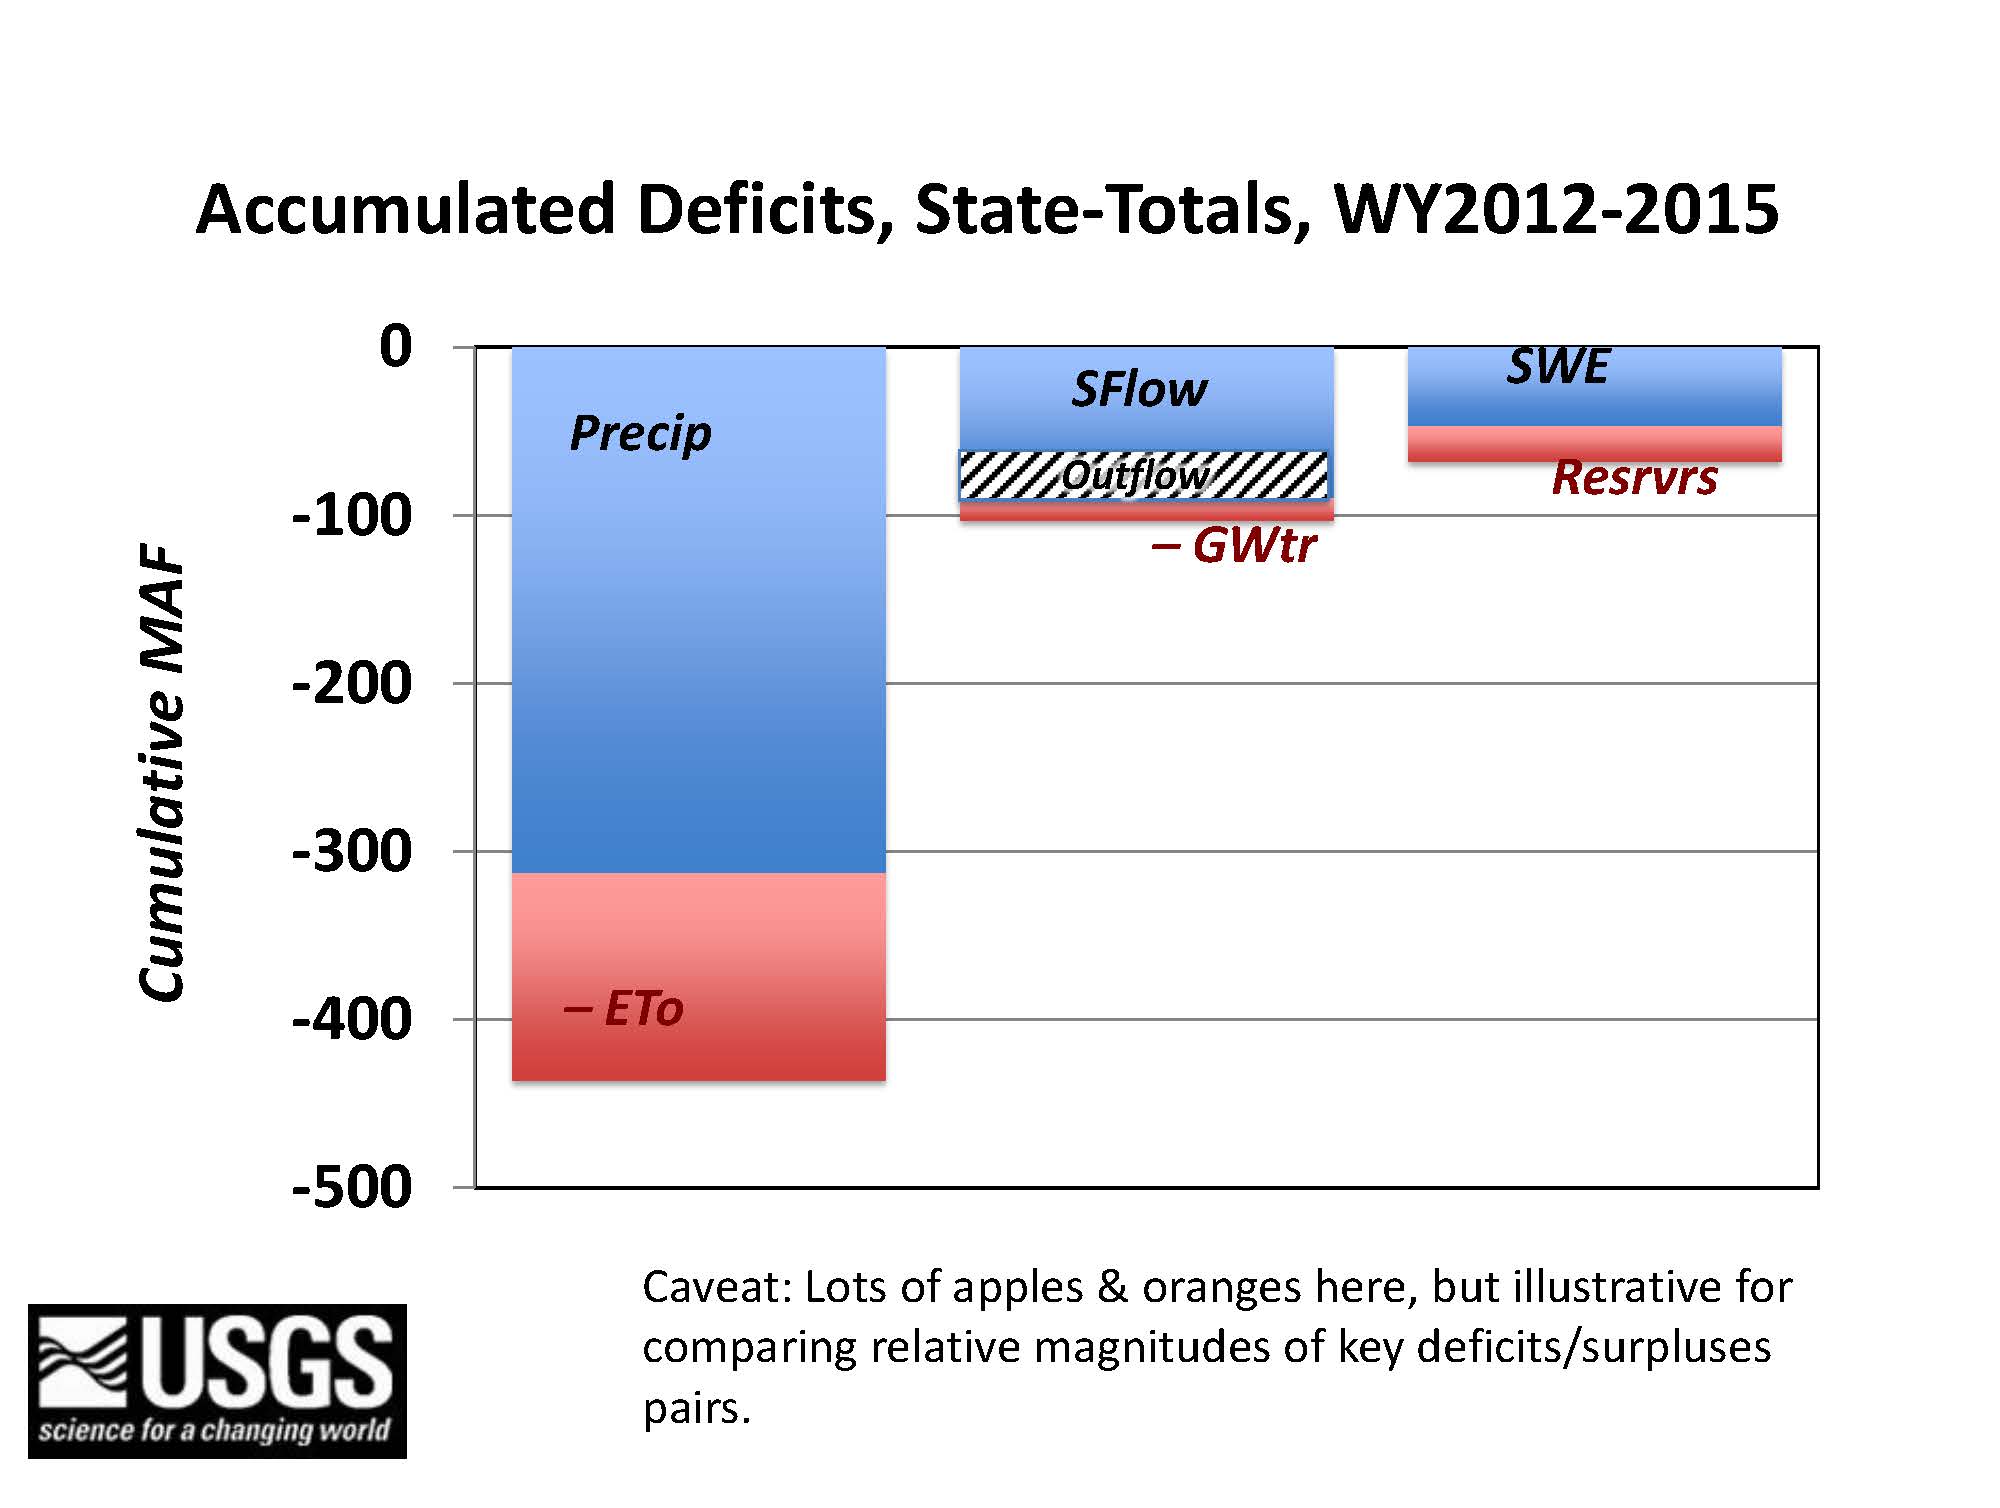 He then stacked up all the deficits, acknowledging that there are apples and oranges here. “There are different pieces here; I’ve sort of segregated it in different ways where I thought the best comparisons might be made,” he said. “Here’s what the evaporation deficit surplus adds up to for the Delta catchment, versus the precipitation. On the whole of that big area, there was about 313 MAF of water for the precipitation, and 120 or something like that for the evapotranspiration. Streamflow is a much larger number, especially to include in the Delta outflow, it’s like 90 MAF versus we saw a number on the order of 13 MAF for groundwater, and similarly the missing snow is a not nearly as much but a larger number than the amount of missing water in the reservoirs.”
WATER YEAR 2016
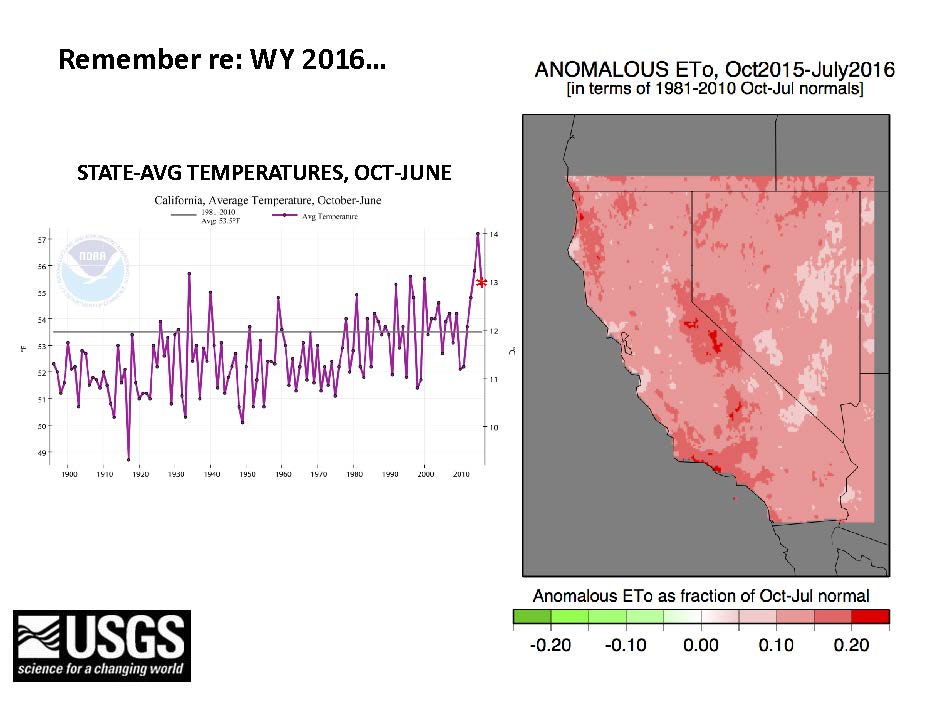
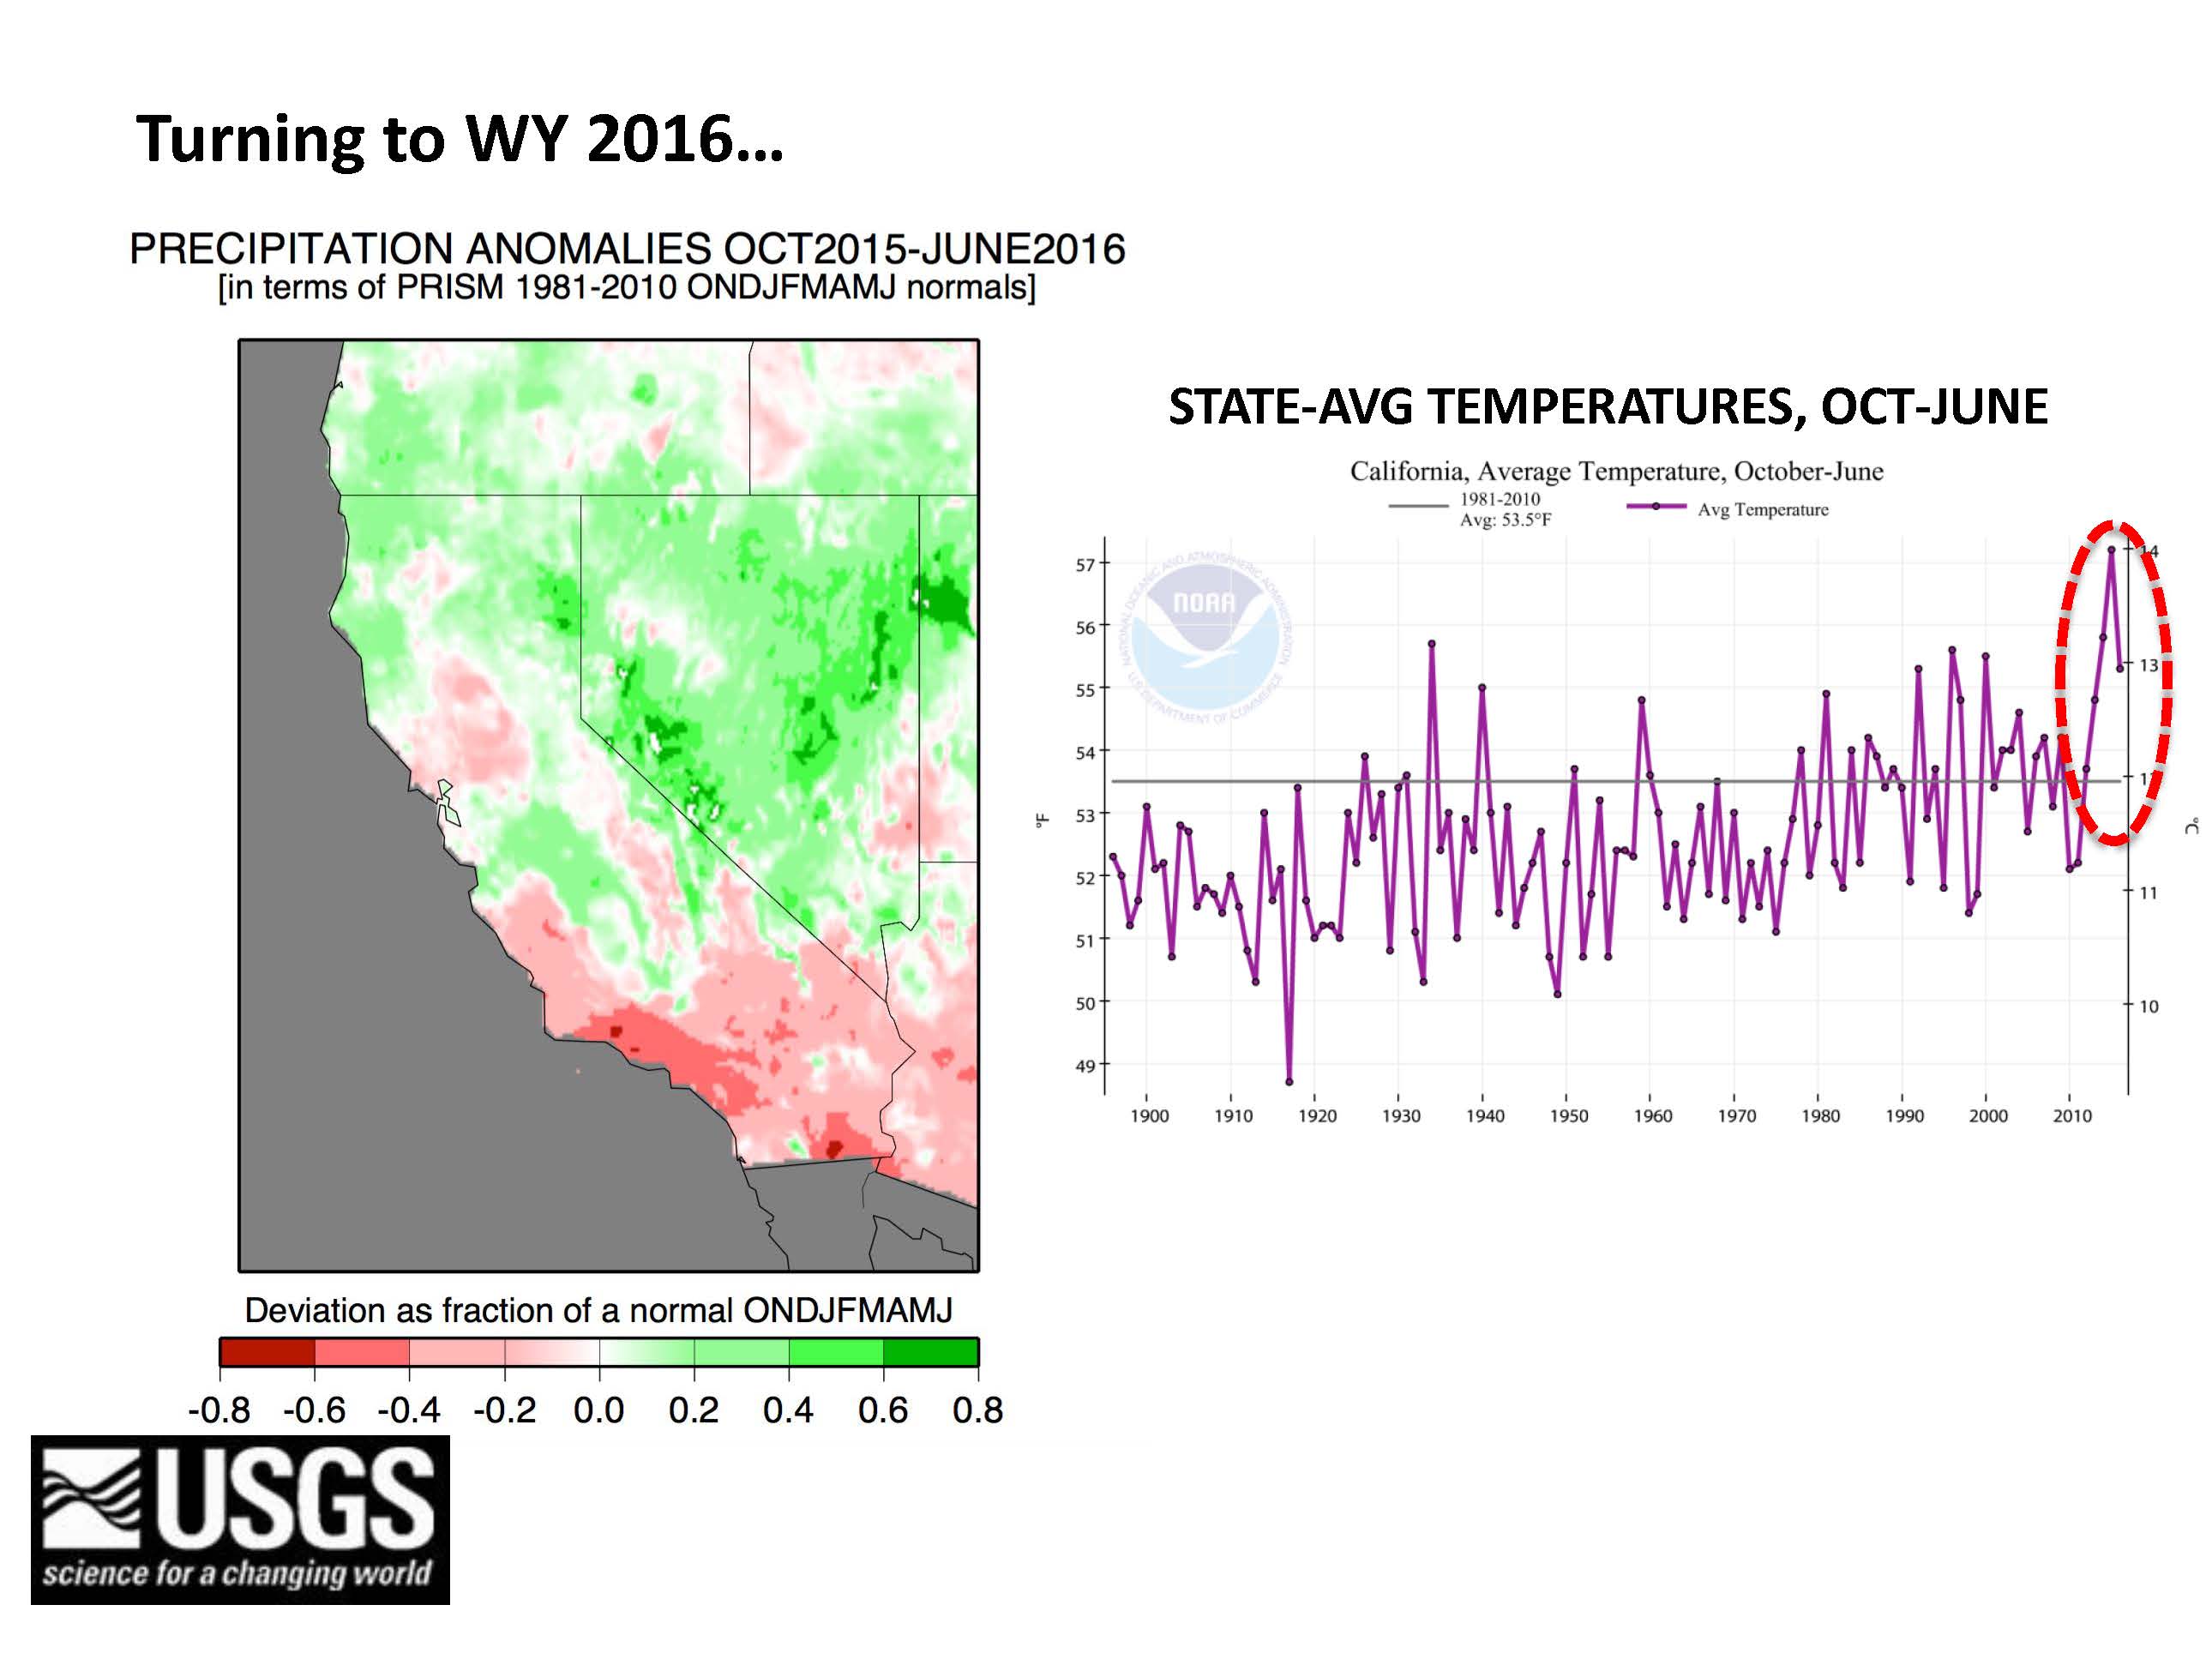 He then turned to the 2016 water year, which as of the date of this seminar (Sept. 7, 2016), was two months prior to the end of the water year. “On the left, the precipitation anomalies as fractions of normal, October through June precipitation for this year, and then on the other side there, the state average temperatures for October through June periods historically, including this year,” he said. “Remember we saw that the temperature in 2015 was a runaway record breaker. This year, it’s come down quite a bit, although if I could run over there and cover 2015 up, this year would still say, this is in the top year that we’ve been in.”
In terms of precipitation, the green colors on the map are where precipitation was higher than normal, and the red colors are where it was lower than normal. “Especially down in Southern California; there was about 40% of normal precipitation down in the LA Basin area, so Southern California really tanked this year. Northern California hung close to normal or 10-20% better than normal. If you average over the entire state, it didn’t add up to anything close to normal … but we don’t live at the state scale, so there are winners and losers.”
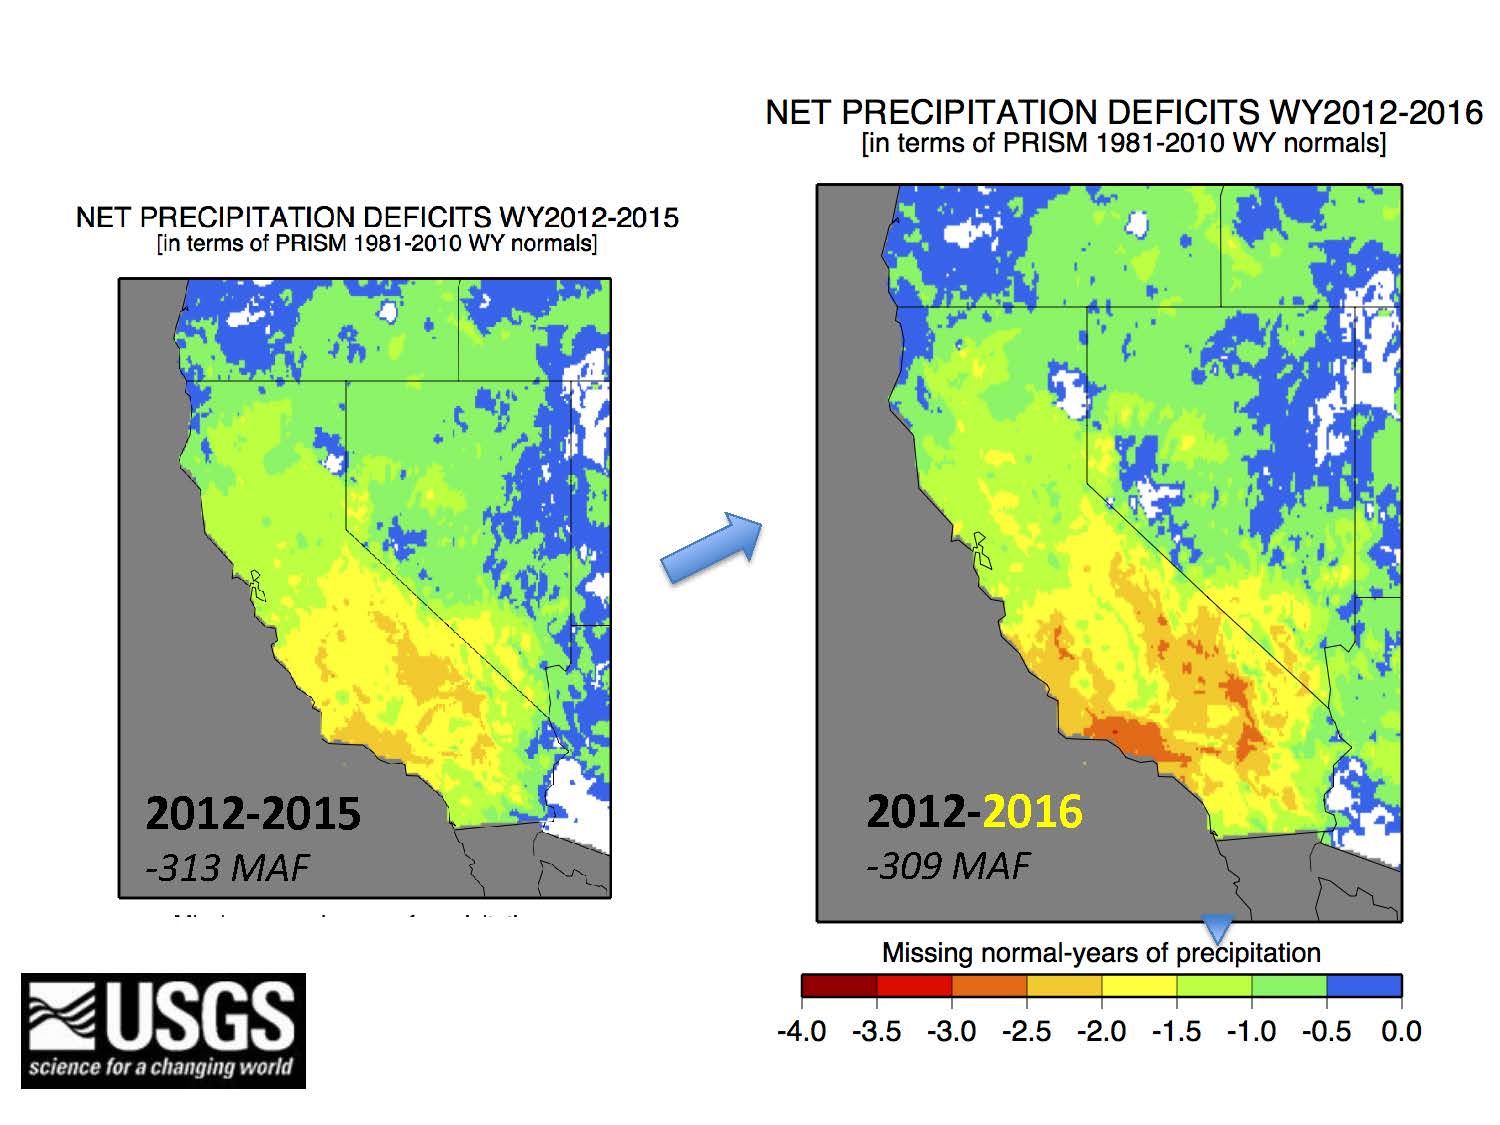 He presented a slide showing the accumulation of precipitation deficit from 2012 through June of 2016. “Up in the north, we did well,” he said. “Down in the south, it’s much more obvious. It dips from orange well into red in much of the south.”
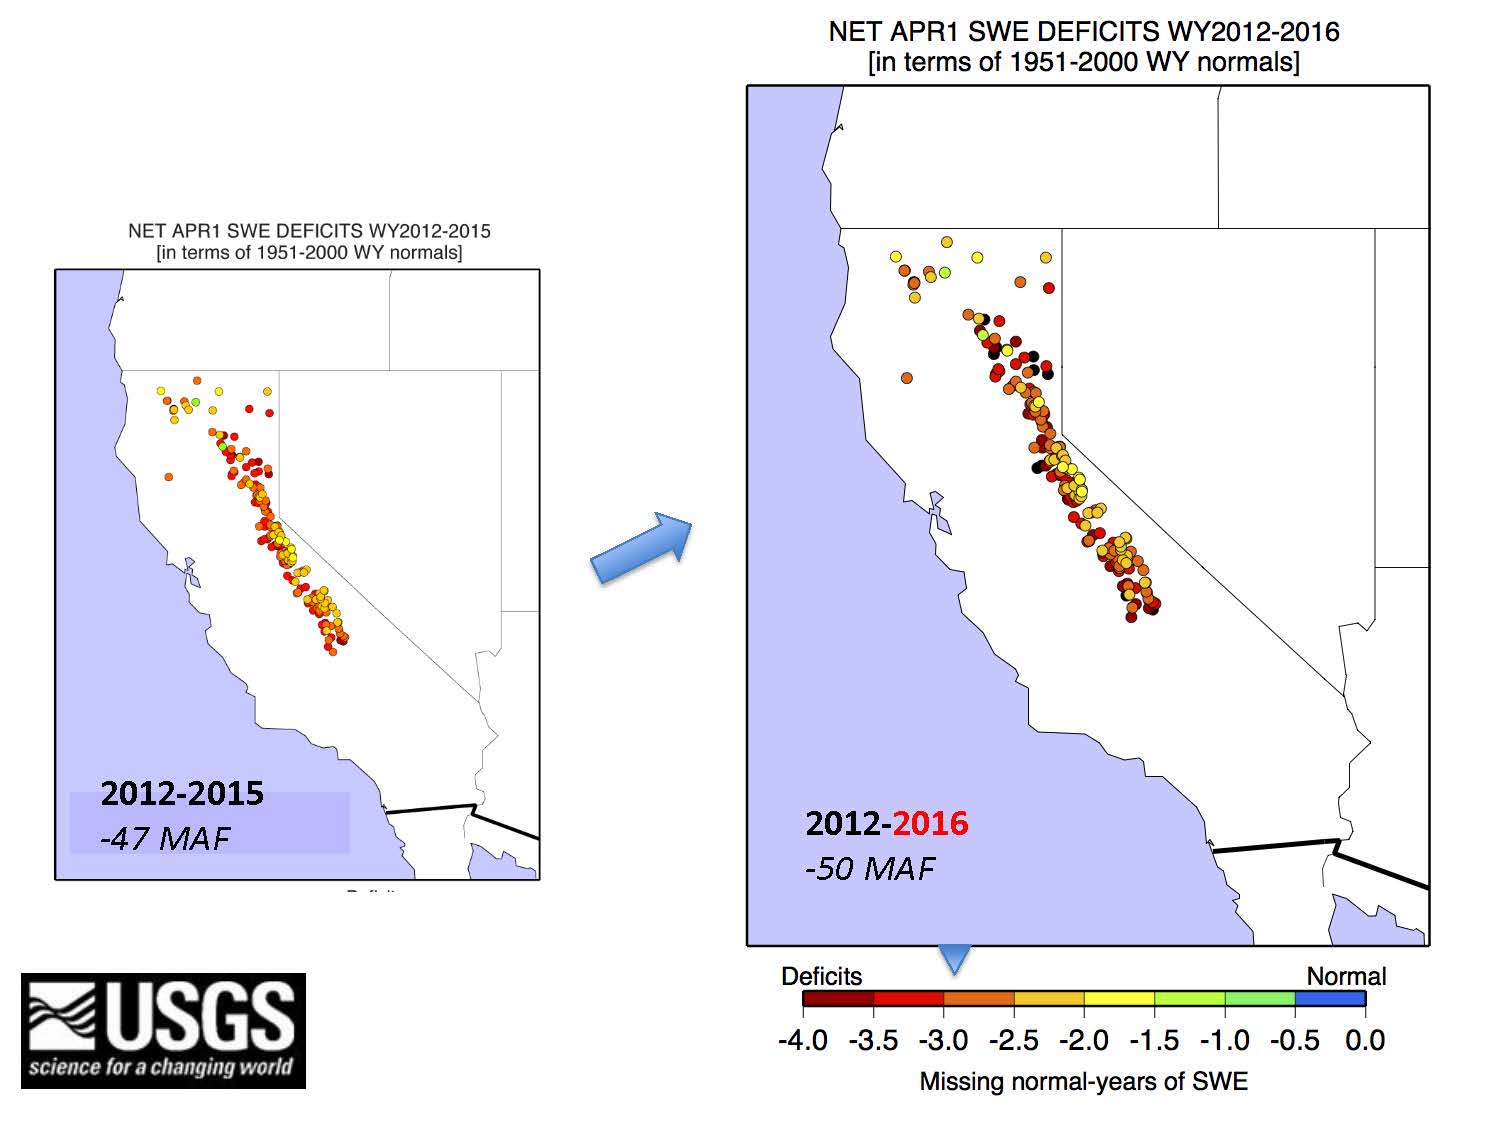 He presented a slide showing Snow Water Equivalent in the same manner. “We’re getting bright red into deep-browny sorts of red. Especially at the lower altitudes with the continuing warmth, those numbers are sinking even further down into deficit there, and accumulated over the whole Delta region, it managed to bump things up a little bit, from 47 MAF behind. At the end of this year, we’re about 50 MAF behind.”
“Remember, we had a not bad year at all in Northern California; it was slightly above normal in many places, but those temperatures keep eating at our snowpack nonetheless,” he added.
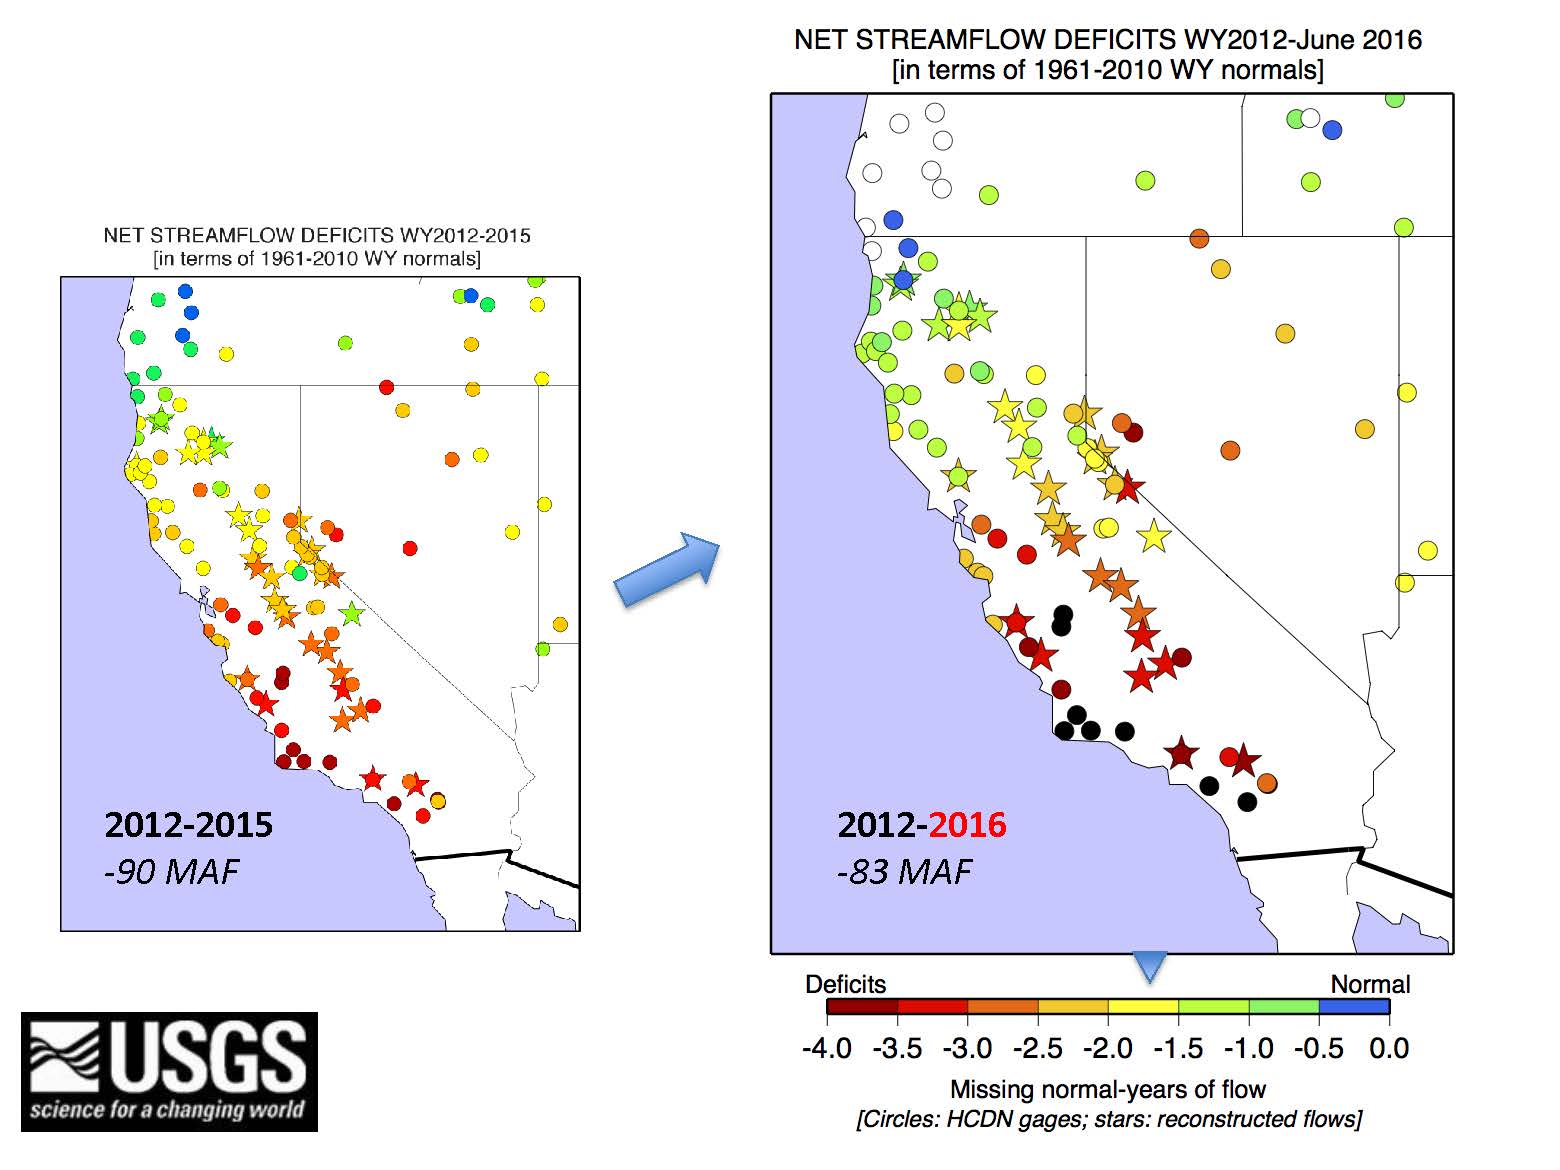 The results for streamflow are similar. “In Southern California where we go from red into virtually black, and with 2016 thrown in up north, we go from mostly yellow up here into the green, which is to say we made some progress against the accumulated missing streamflow,” Dr. Dettinger said. “Our larger streams and the like are up north, and so the fact that we had a relatively good year up there is such that it pushes this accumulating streamflow deficit down a little bit, but not by a huge amount.”
 He then presented a slide showing evaporative demand. “Basically it’s all red, so those warm temperatures along with drier conditions down in the south, clearer skies, some more solar radiation, and winds,” he said. “It’s not clear how that worked out, but basically the demands were up for the whole area. They are all red. In the Central Sierra, they were quite a lot, relative to any other place around.”
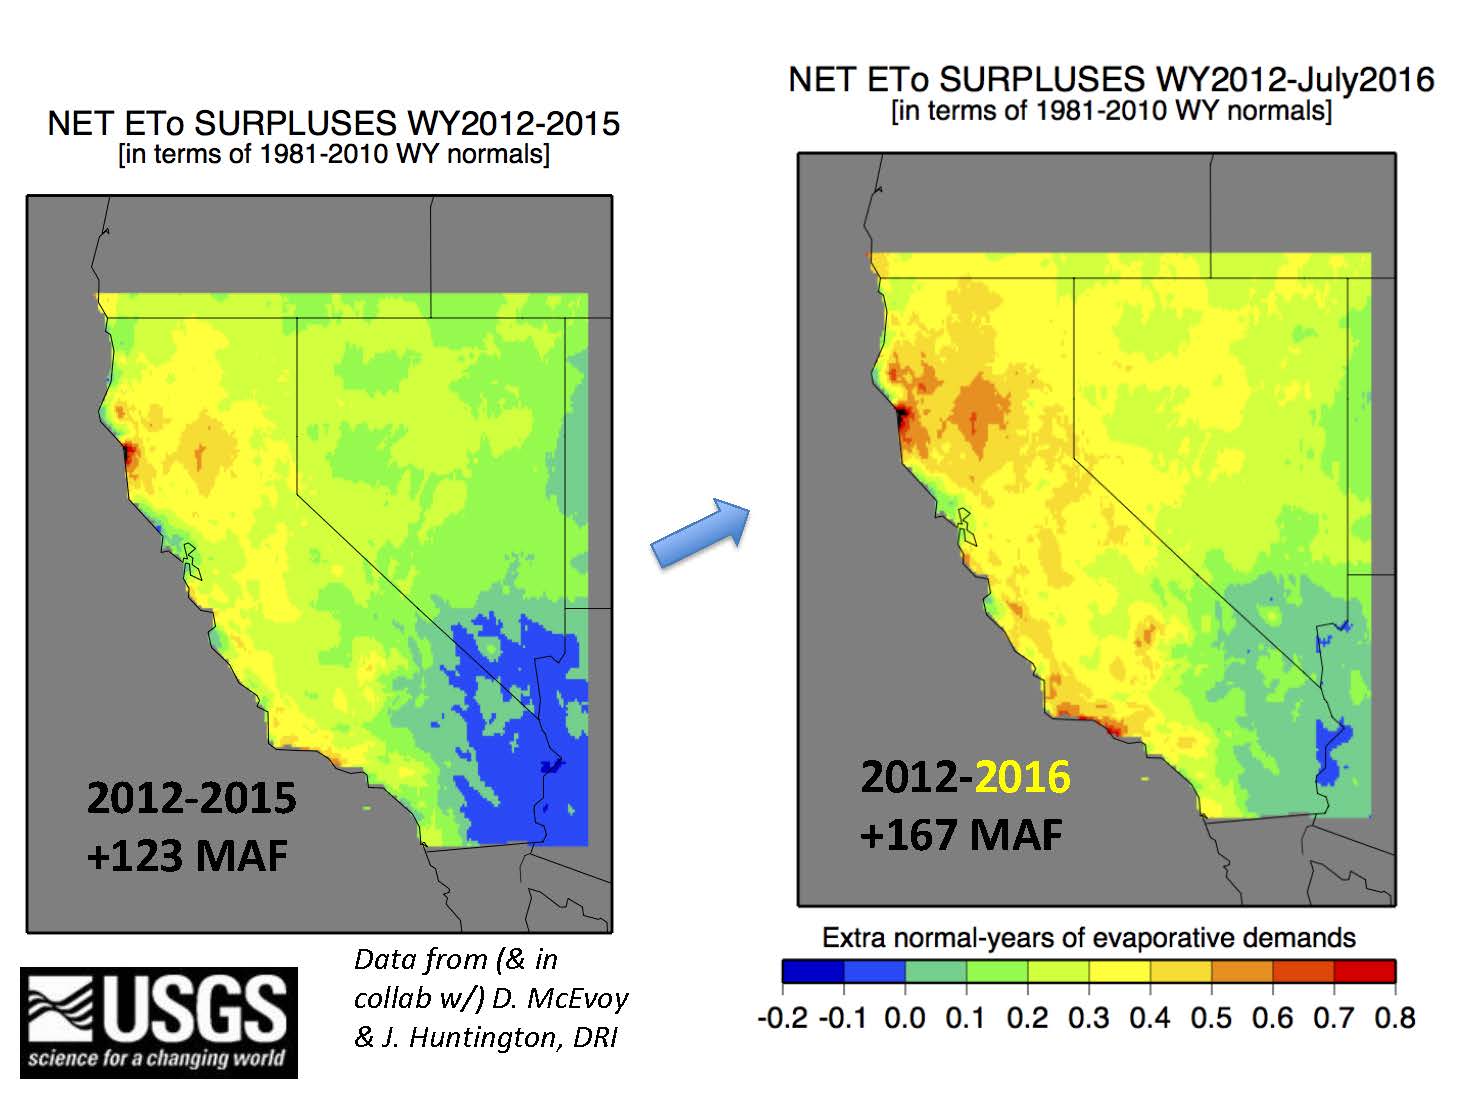 He then presented a map showing evaporative demand surpluses, now including the first half of the 2016 water year. “Especially up in the north there, it’s pushed us from moderate to values into pretty large areas there where the numbers are starting to get very large, almost a year behind and remember a year of ETO is a large number.”
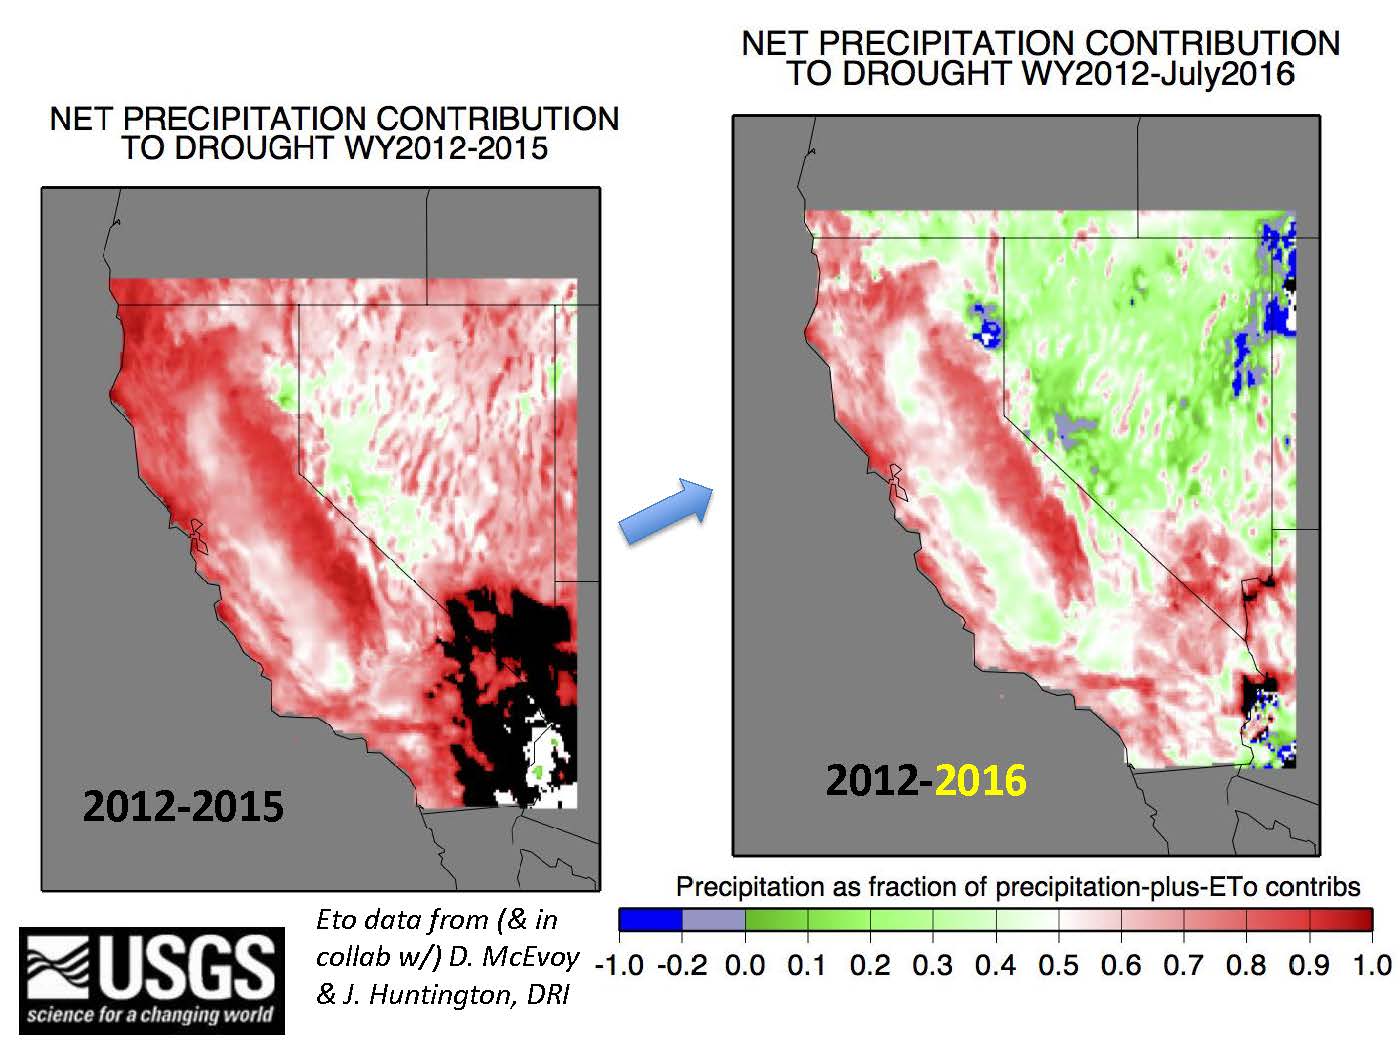 He then presented a slide showing the precipitation deficit contribution to the drought. “On the left is 2012-2015 and on the right is 2012-2016,” he said. “Basically the whole of Nevada basically goes green, which is to say over there they got enough precipitation and while the evaporative demand continued in this anomalously high amounts, that it pushes us over to where if you consider the 2012-2016 drought, it’s by now, it’s an evaporative demand drought. And that’s a big change for just throwing one year on the end of a drought. In the San Joaquin Valley in particular, we go into that mode, too. Remember that’s an area where this year, they did not do well in terms of precipitation, for evaporative demand has just pushed the precipitation deficit aside in the San Joaquin and Southern Central Valley.”
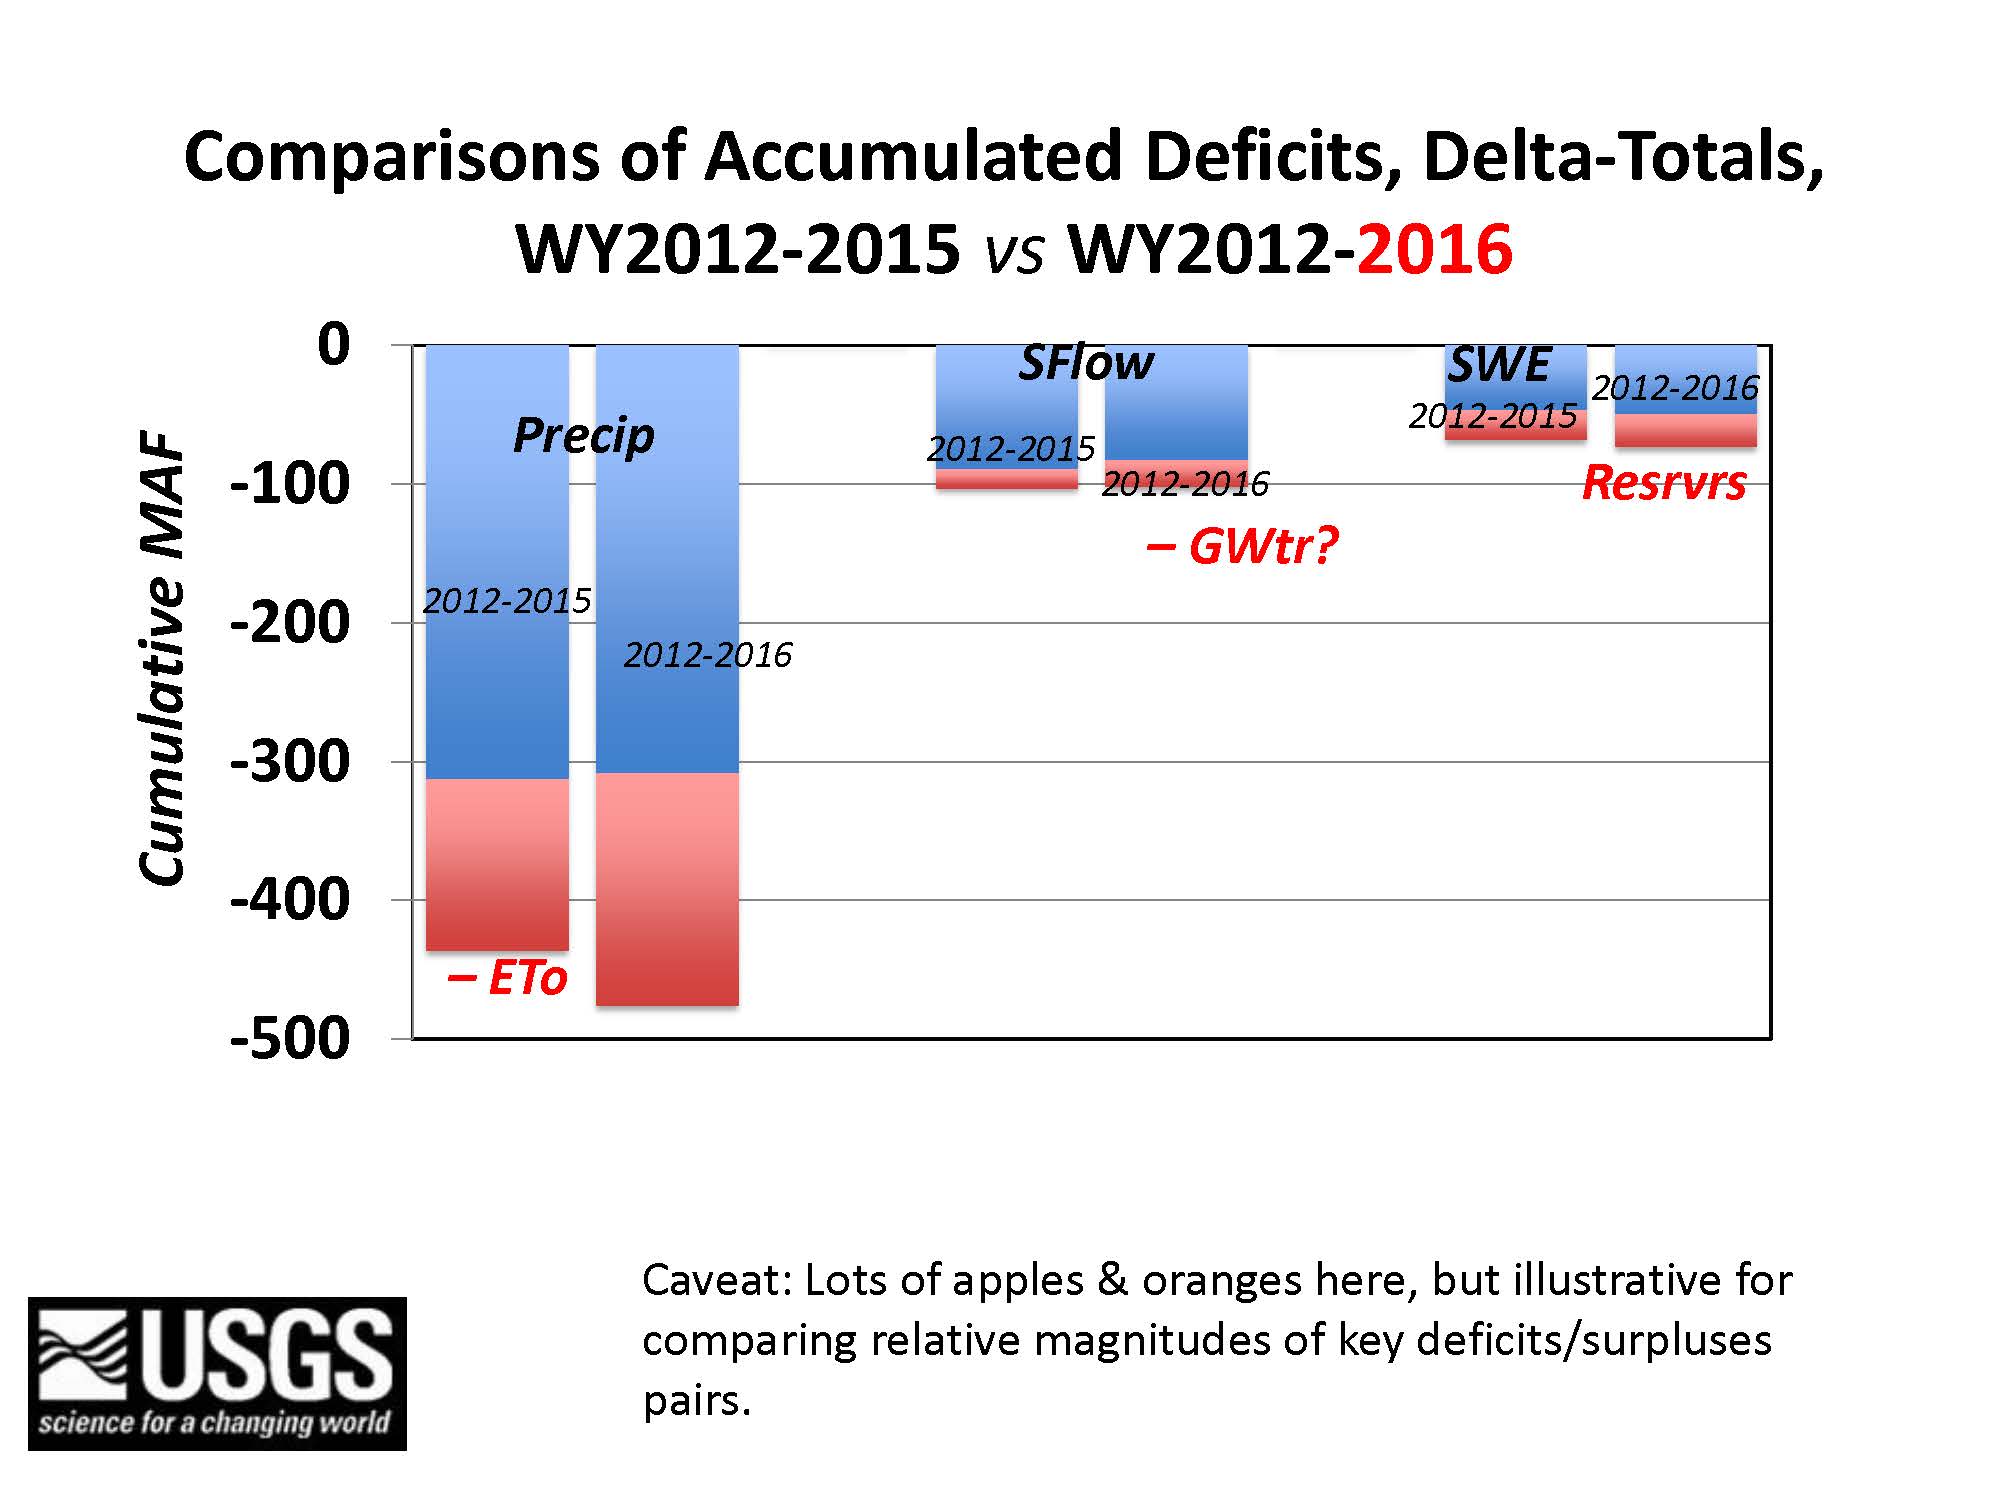 “If you look at the totals when you add it all up, in terms of MAF, that’s about 25% jump, which is a large number for throwing 9 months onto the end of this drought,” he said. “For this large Delta catchment area, the improvement we got, you have to look hard to see it on this graph. The ETO is a big jump there. My best shot at groundwater pumpage, given that I know what the carryover into reservoirs for this year; it looks like an increase there. Streamflow improved a little bit, but all of these numbers with the exception of ETO are really marginal changes. There were winners and losers and they averaged out at this large scale.”
THE CURRENT DROUGHT VERSUS DROUGHTS OF THE FUTURE
“This time, we have this record breaking warmth during this drought, and we’re looking at temperatures in the last few years that are in the vicinity of what we would expect in the 2030s and 2040s in current climate change projections,” he said. “In 2015, we had this absolutely terrifying 5% of normal April 1 snowpack. We’ve been making projections of these losses of snowpack for years. I realized when I saw the numbers for 2015, when they started emerging, even though we’ve been talking about it for years, I never conceptualized what it would take to get to a 5% of normalcy in a year, it’s amazingly low.”
Dr. Dettinger said that although the water year totals for precipitation have not been record bfeakers over the 120 years, if you look at any long period within the drought and compare that to historical drought, there are record breaking chunks of time in this drought. “There was a record breaking 13 month period between January 2012 through January 2013; it was only 35% of normal January through January totals. The next lowest one in this 120 year record was 53% so 20% more than this, so this was a standout 13 month period.”


He said DWR climatologist Michael Anderson pointed out to him that it began right after a major atmospheric river storm, and it basically ended with the arrival finally of another major atmospheric river storm.
“I started out by saying that the future drought will be these more persistent warmer droughts punctuated by large storms, and we have in the midst of this drought something that looks like what you might want to imagine these future droughts would look like,” he said.
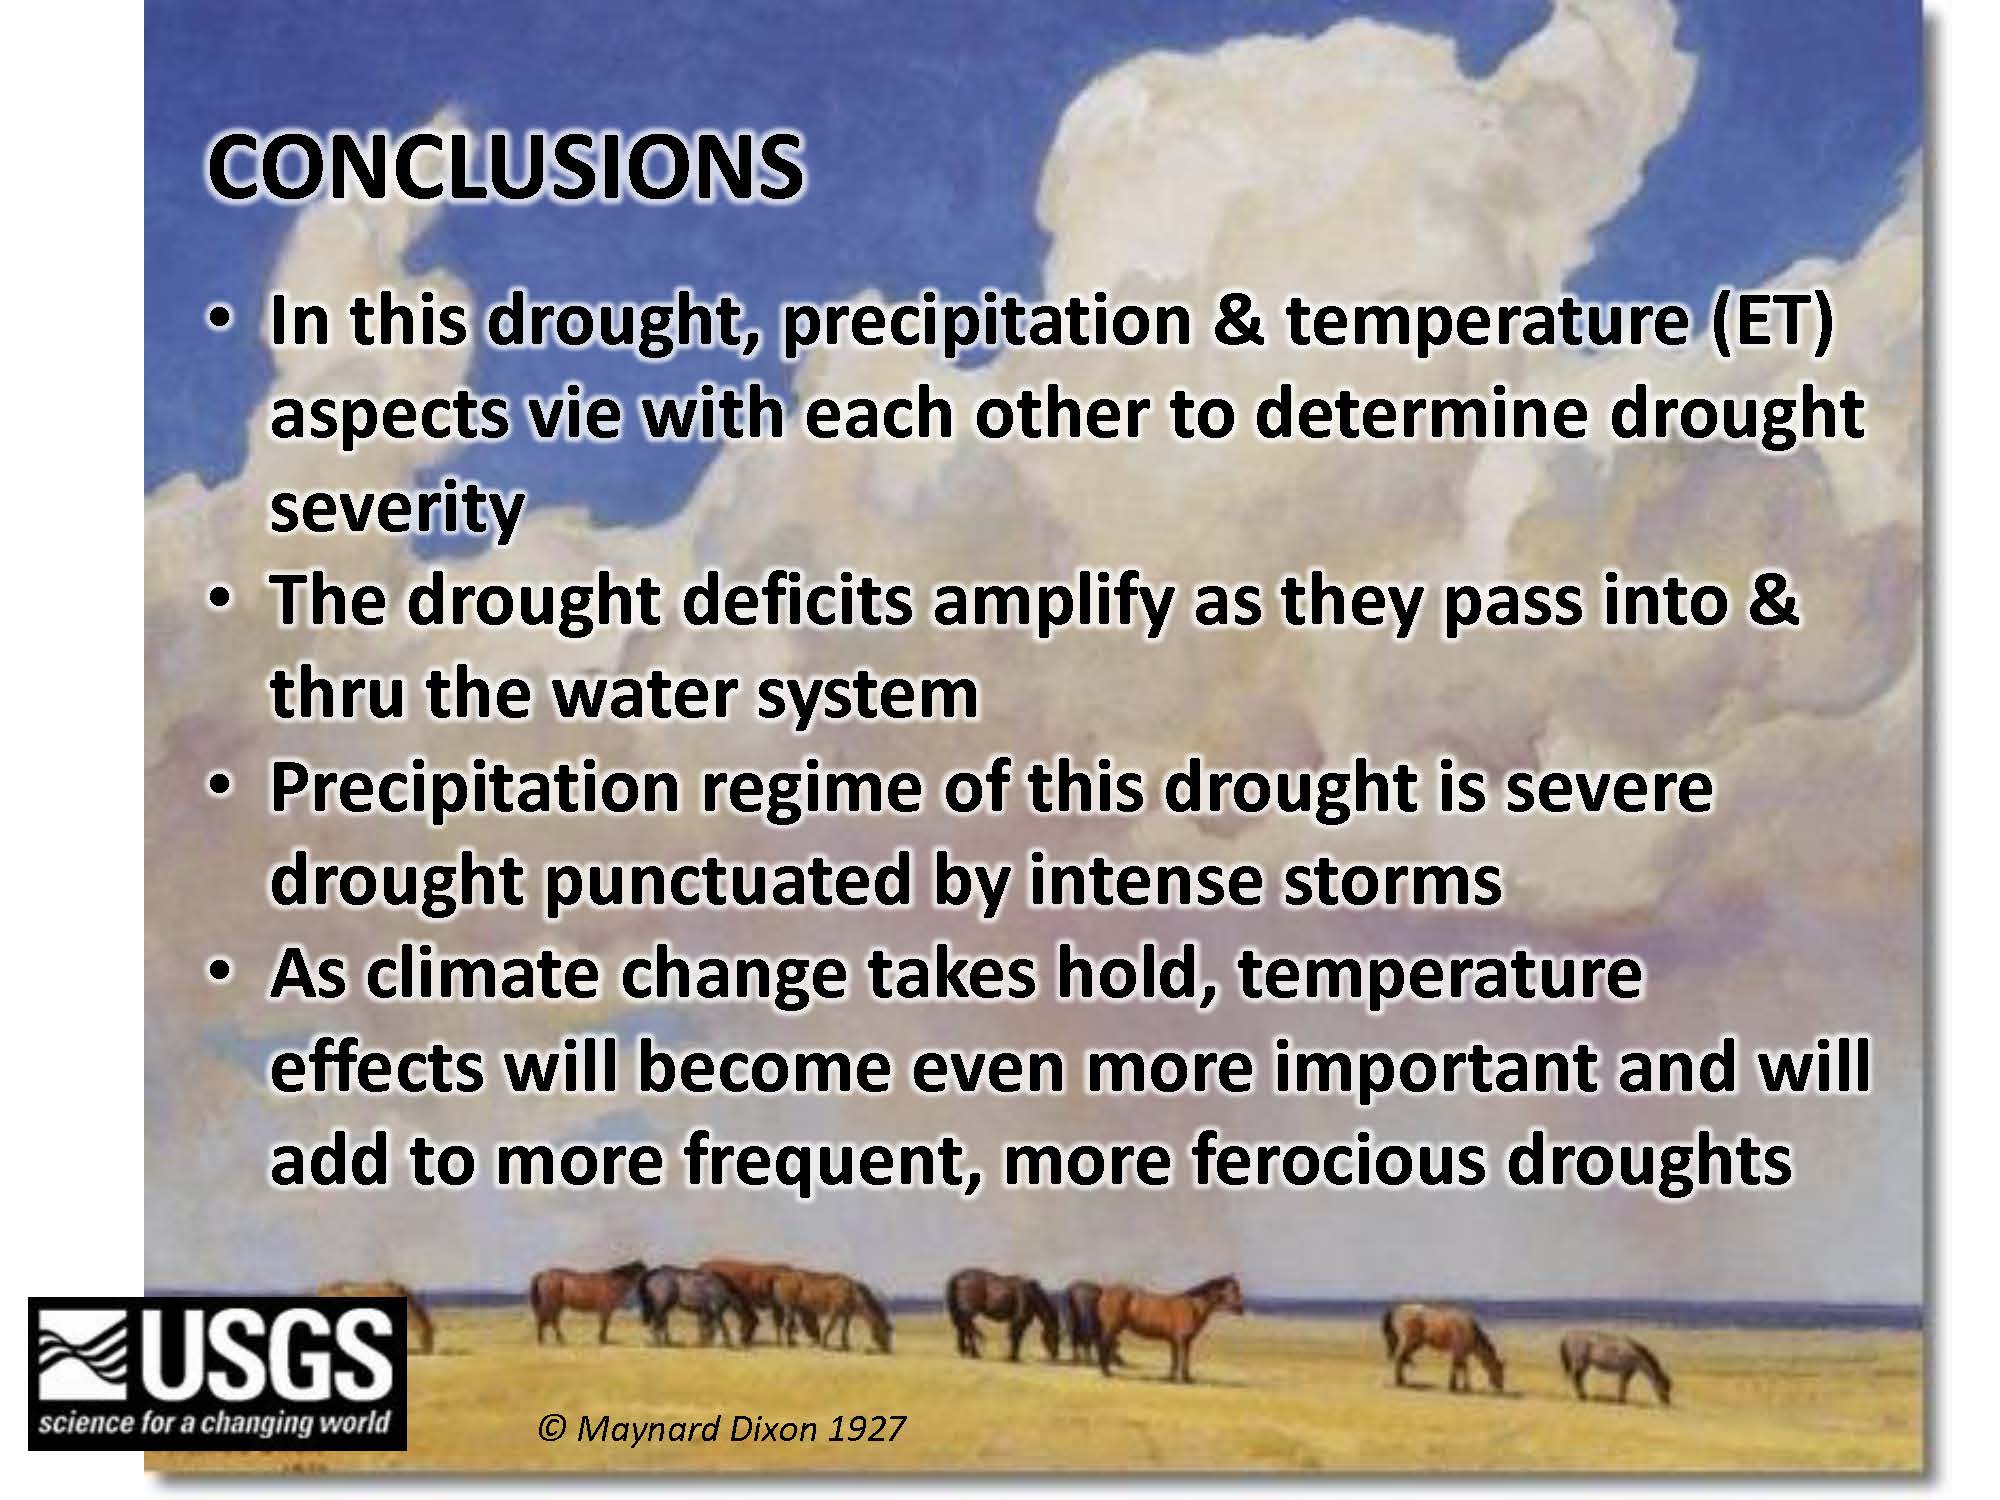 “So in this drought, precipitation and temperature, ET aspects have vied with each other to determine how severe the drought is, and over much of California, the precipitation deficit was the entire story, until this year when we had a normalish precipitation year,” Dr. Dettinger said. “With the temperature staying up in large parts of California, most of Nevada just flipped over where really on the whole this has been an evaporative drought. These drought deficits measured common units and in particular, years of missing water units – you could do it with percentages, you could do it with standard deviations to the extent – a lot of those things amplify as they pass into and through the water system.”
“The theme of this drought is severe drought punctuated by a few intense storms and that’s something that we anticipate that as climate change takes hold, these temperature effects will become even more important,” he said. “For me, the rapidity that certain areas flipped over from having what I would consider an evaporative drought from a precipitation drought suggest that isn’t something that is way off in the future. In this drought, we see it happen, and we can do that almost any time now. It’s only going to get worse as we move into the future.”
FOR MORE INFORMATION …
 Sign up for daily email service and you’ll never miss a post!
Sign up for daily emails and get all the Notebook’s aggregated and original water news content delivered to your email box by 9AM. Breaking news alerts, too. Sign me up!
