

When it comes to the upcoming winter season, there are many questions. Will it be wet or dry? What about El Nino? and what will it take to end the drought? Cindy Matthews, Senior Service Hydrologist with the National Weather Service/NOAA, answered these questions in her presentation at the November Delta Stewardship Council meeting on the long range forecast for the upcoming winter season.
 She began with a review of current conditions. “This is basically the third dry year in a row and it looks like we’re heading into a fourth one,” she said, presenting a slide of the three-year precipitation summary. “This is a three year collection of the percentage of average of the precipitation across California from the Western Region Climate Center, and as you can see, over most of California, we’re looking at 50 to 70% of normal precipitation for the last three years. What this does not show is that out of the last 8 years, seven of those have been below normal in most locations in California.”
 They took the 8-Station Index and did a cumulative precipitation total for the last three years to see how far we are behind. She noted that the red line is normal and the blue line is actual precipitation. “For the 8-Station Index, we are 32 inches behind normal for cumulative for the last three years,” she said. “Where they go together is in December 2012 when we had massive amounts of rain; we had 18 inches of rain in the Sierra above Oroville, but you’ll notice that was quickly eaten away by how much rain we did not get.”
 She then showed the same calculation that was done for the San Joaquin 5-Station Index. “You can see that deficit is incredible,” she said. “It’s almost 50 inches, which is more than one year’s total average for that station index. It’s a pretty grim picture.”
 She then presented a graphic of the U.S. Drought Monitor for November 11. “The U.S. Drought Monitor puts out a weekly graphic of what is happening across the nation,” Ms. Matthews said. “I wanted to make sure you understood that this document is used for many purposes by many agencies, so it does not necessarily truly reflect the drought impacts as to what’s happened. For example, in the far northwest corner of the state in that pink circle, you can see some of the degradations. It’s improved categories, but that was all based on that Halloween precipitation that we got up in the northwest. That was a great amount of precipitation but it did not end the drought. But because this document serves many purposes, they had to reflect the improvement in categories temporarily, so when you see this in other reports, remember that it does serve many purposes.”
 She then turned to the predictions for the upcoming winter season. “According to the Climate Prediction Center, there is a 58% chance of an El Nino occurring in the northern hemisphere for 2015,” she said, presenting a graphic of the models used to predict an El Nino. “With most of those models, there’s a starting point thereabouts in September where all the models take off and then they branch out and become a plate of spaghetti. Most of them are in the weak category, so we will probably end up in a weak El Nino if we end up in an El Nino at all.”
 “El Nino, despite what common folklore says, does not guarantee a lot of precipitation for California,” Ms. Matthews said. “What El Nino does do is it sets up where the storm track is, so in an El Nino year, the upper graphic shows that the storm track moves further to the south; the storms come off of Asia and goes streaming across the Pacific into California. Southern California is the only part of California that has any strong correlation to El Nino and precipitation; they have a correlation to above normal precipitation. The rest of California does not.”
“If we remain in a neutral year, where we’ve been for the last two years, our storm pattern is going to be closer to what you see in the bottom half of the graph,” she said. “It’s going to split the storm track. Things are going to go in Baja California, and go across the southern portion of the United States and it’s going to hit the Pacific Northwest.”
 She then presented a slide of historical precipitation for weak and neutral El Nino years, noting that for the last 65 years, they’ve been classifying El Nino and ENSO type years. “We went and looked back at those same 65 years for the 8-Station Index and the 5-Station Index and classified them or figured out which ones were above normal for precipitation and which ones were below normal. 57% of the weak El Nino years collected above normal precipitation. Only 36% of the neutral years collected above normal precipitation.”
 She then presented a slide of the same data collection and calculations for the 5-Station Index, noting that only 29% of the historical weak El Nino years collected above normal precipitation, and only 32% of neutral years collected above normal precipitation.
 She then displayed a slide of three month seasonal outlook for December, January, and February, noting that temperature is on the left and precipitation is on the right. “December, January, February and March are our highest precipitation months out of the year, so it looks like things are going to be warmer than normal,” she said. “What that means is that any storms coming in are going to have the higher snow levels which will keep that snowpack from getting as deep as we want it to get.”
As for precipitation, she noted that Southern California has a probability of above normal precipitation. “Unfortunately, Central California including the San Joaquin’s portion of the Sierra and the Northern Sierra is blank; that blank means equal chances. There is an equal chance of above normal precipitation, below normal precipitation, and normal precipitation. What that is saying is that the models have no strong indicators about what’s going to happen for precipitation.”
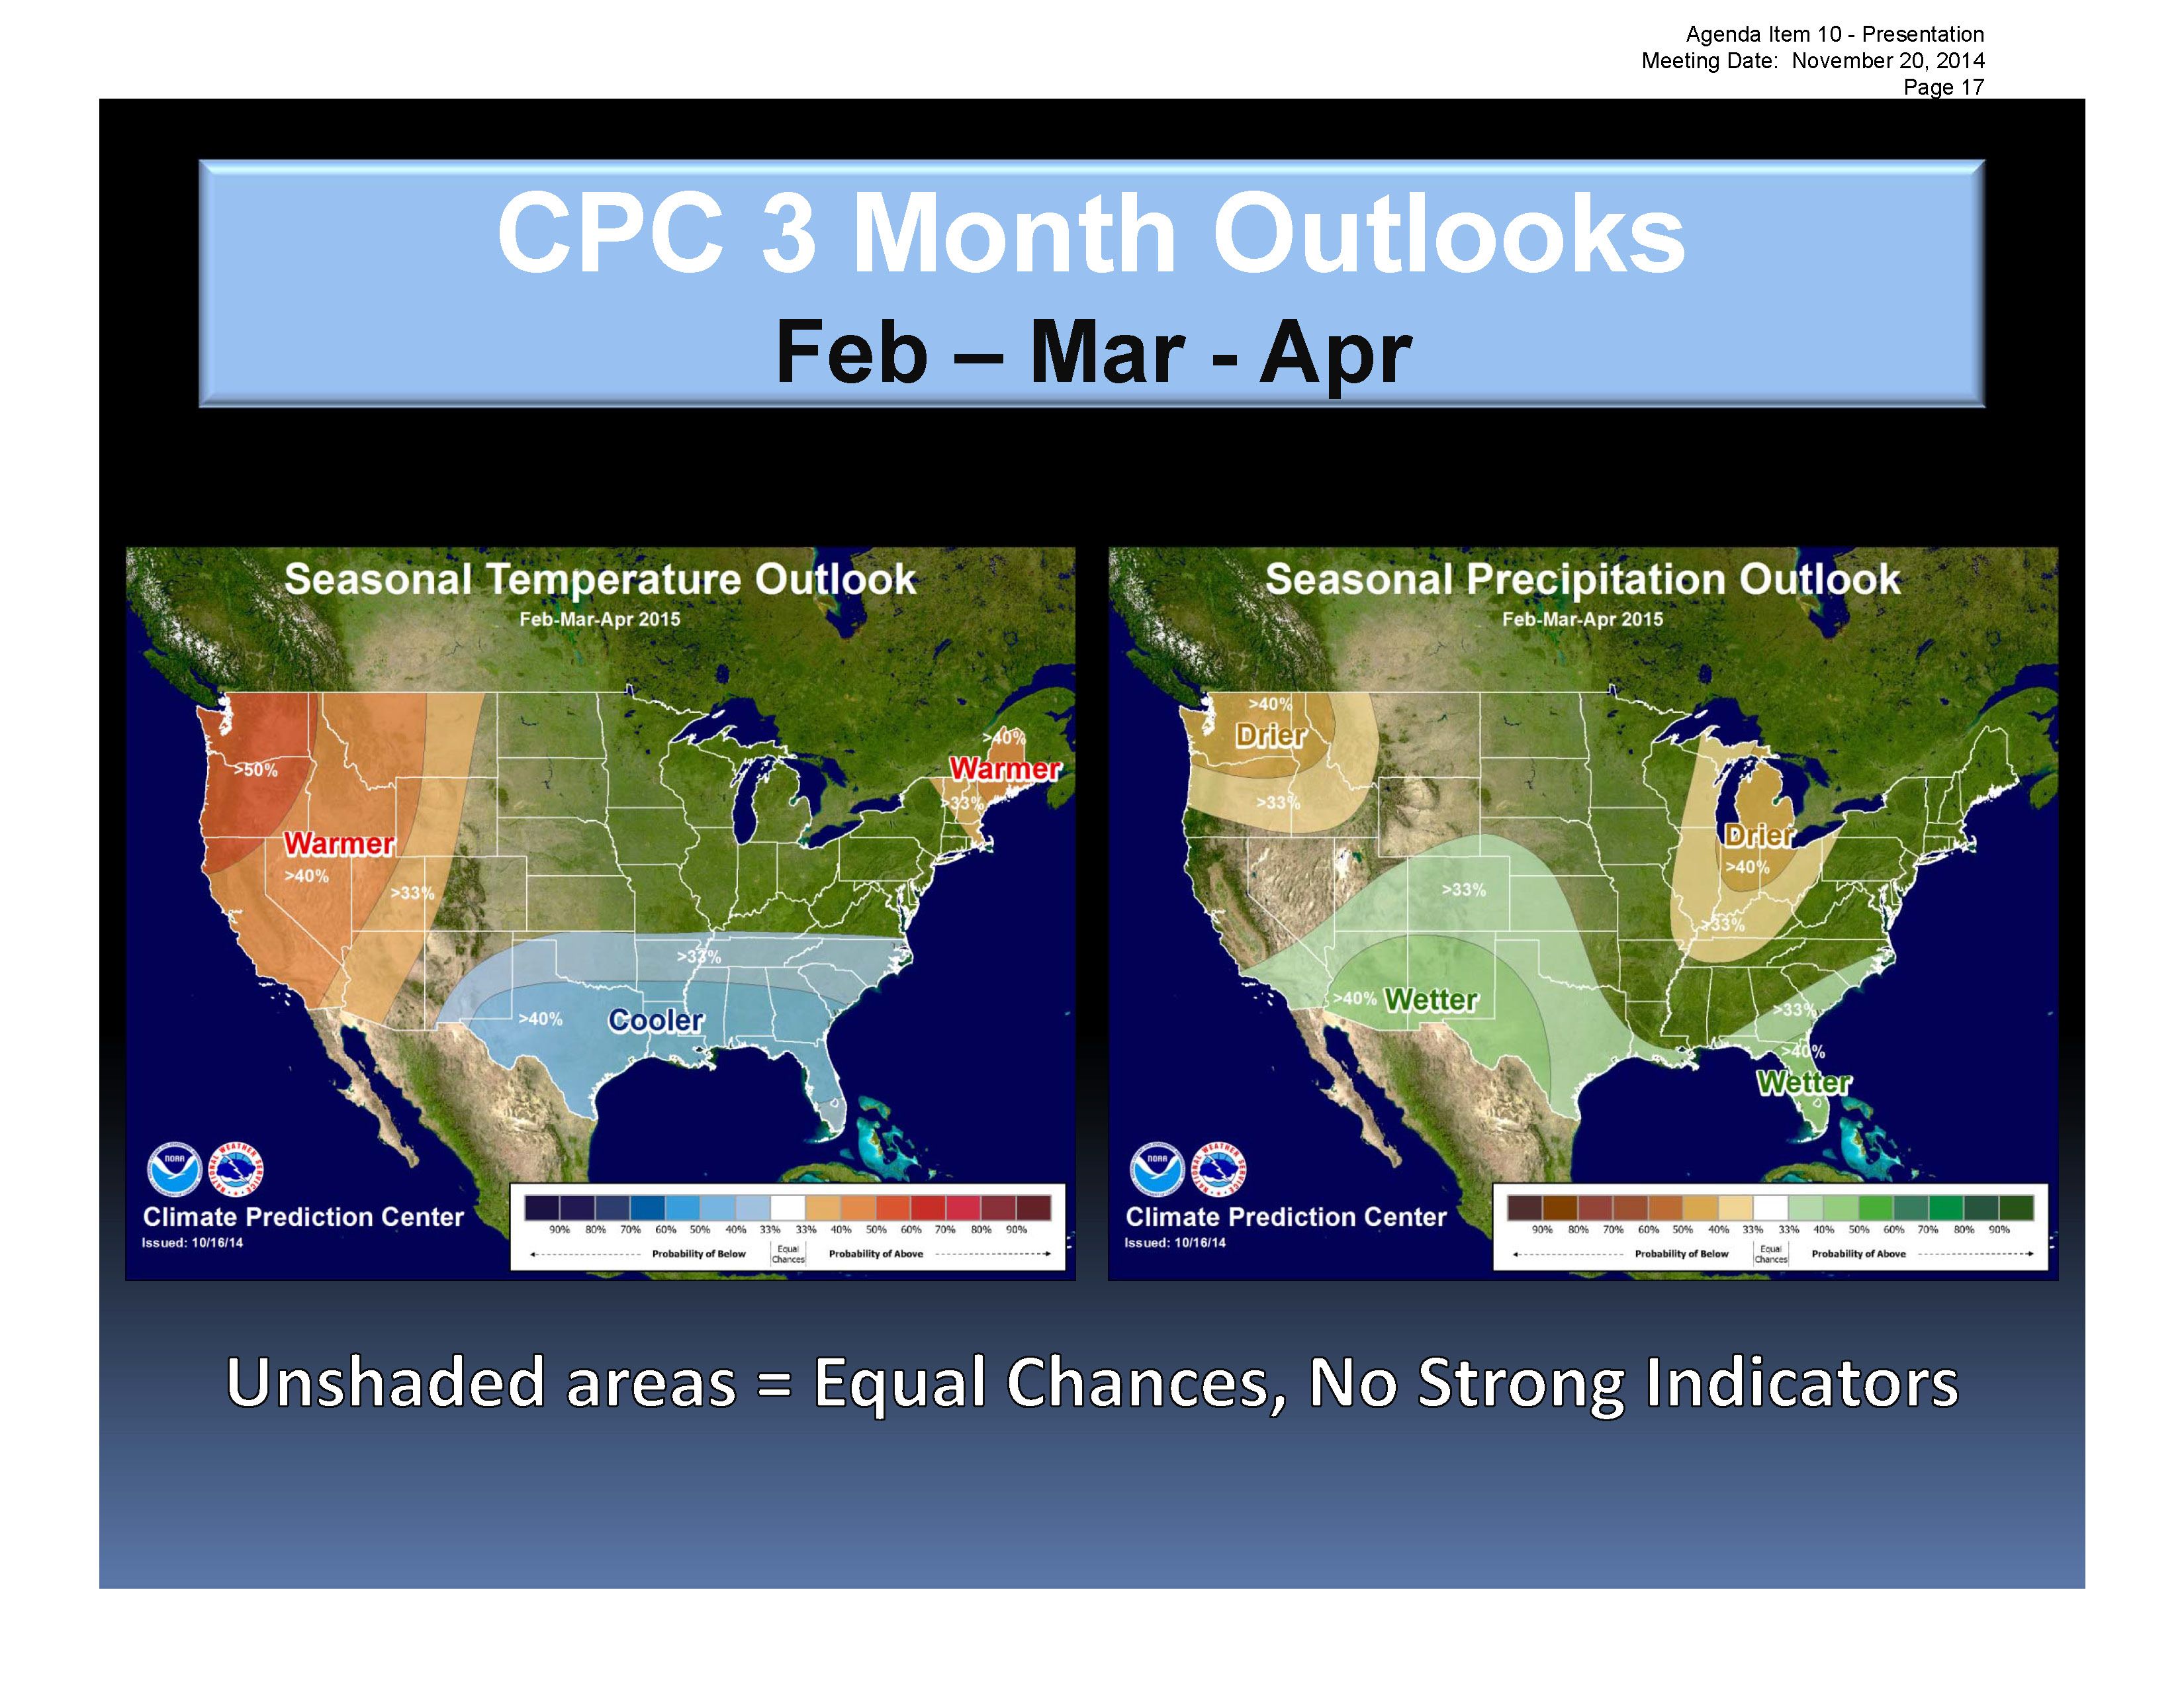 She then presented a slide of the predictions for February, March, and April, noting these are months where we build a lot of our snowpack. “Same thing, above normal temperatures are probably what’s going to happen; and equal chances again for precipitation, so we really do not know what’s going to happen precipitation-wise for the winter.”
 What would it take to end the drought? Ms. Matthews said she gets asked this question a lot, so she posed the question to state climatologist, Michael Anderson. “What I heard from him is that for drought busting years, it takes a sustained period of above normal precipitation and runoff and a sustained period of above average snowpack,” she said. “It’s going to take two of those four wet months to receive precipitation at 150% or more above normal, and it’s going to take a spring snowmelt of 150% of normal, or above, so the rains are going to fill the reservoir up to their flood control space, and the snow is going to fill them up and top them off for our water use as the spring progresses into summer.”
 Make a tax-deductible donation to Maven’s Notebook today and help make an impact on California water in 2015!
Click here for more information.
